


Short Summary
Location accounts for approximately 80% of a property’s capital growth—not the asset itself. This well-established principle fundamentally changes how smart investors approach suburb selection. Yet comparing thousands of suburbs across the metrics that actually drive performance has traditionally been nearly impossible.
HTAG’s Dex™ module solves this challenge, enabling investors to rank and compare any number of suburbs across 150+ property investment indicators with customisable weightings—all within minutes.
Why Location Selection Is the Highest-Yielding Activity in Property Investment
Before examining a single listing, successful investors understand a fundamental truth: the suburb selection process will determine approximately 80% of their returns. Asset characteristics—the property itself—contributes roughly 20%. This research, backed by academic studies published in the Journal of Housing Economics, reveals why many investors focus on the wrong activities.
When you prioritise location over property features, you’re addressing the high-yielding activities that maximise returns. Finding the perfect three-bedroom house matters far less than identifying the suburb positioned for optimal growth aligned with your investment brief.
The Opportunity Cost Problem Every Investor Faces
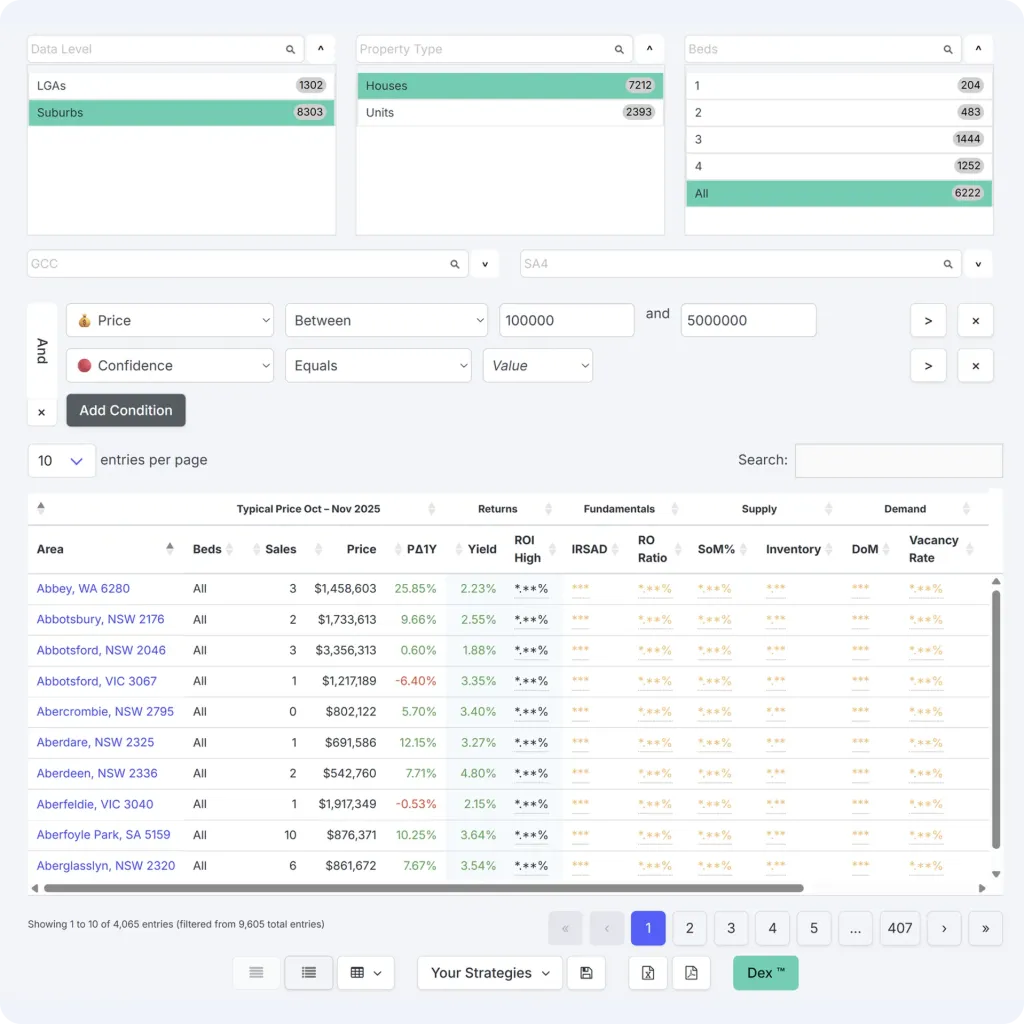
Opportunity cost—the cost of investing in a suburb that won’t deliver optimal growth compared to alternatives—represents one of the greatest hidden risks in property investment. With over 9,800 suburbs across Australia to evaluate, making informed comparisons without robust tools is practically impossible.
Consider attempting to compare even ten suburbs manually across metrics like rental yield, days on market, infrastructure spend, school rankings, vacancy rates, and growth trajectories. The human mind simply cannot process such volumes of information effectively, leading to what researchers call analysis paralysis—becoming so overwhelmed by data that decision-making stalls entirely.
This paralysis costs investors real money. Properties in high-growth suburbs sell quickly, and while you’re comparing spreadsheets, opportunities disappear. Research shows that spending too much time analysing potential investments results in missed opportunities, particularly in rising markets where prices move rapidly.
Introducing Dex™: Australia’s Most Comprehensive Suburb Comparison Module
HTAG’s Dex™ module is currently the only platform in Australia that allows investors to compare unlimited suburbs across 150+ metrics simultaneously. Whether you’re evaluating two suburbs or 10,000, Dex™ processes the analysis in minutes, providing ranked outputs based on your specific investment criteria.
The platform operates in two versions:
Dex™ Light contains 33 essential metrics for streamlined analysis, ideal for initial screening and investors building familiarity with data-driven insights.
Dex™ Pro delivers the full 150+ metrics for comprehensive due diligence, covering every dimension of suburb performance from short-term momentum indicators to long-term fundamentals.
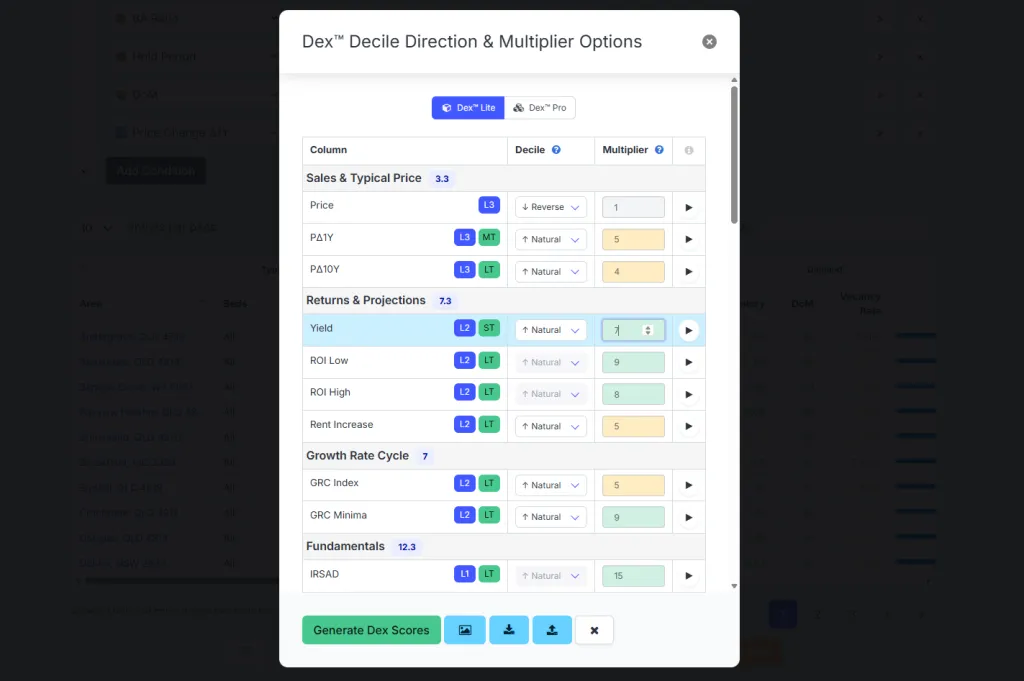
Understanding the Metric Hierarchy: L1, L2, and L3 Classification
One of Dex™’s most powerful features is its inherent metric hierarchy, which eliminates guesswork about which indicators matter most:
Level 1 (L1) Metrics represent the most critical indicators for investment success. These property investment indicators have the strongest correlation with capital growth and rental performance.
Level 2 (L2) Metrics provide important supporting data that refines analysis and adds nuance to suburb evaluation.
Level 3 (L3) Metrics offer contextual information that, while less impactful individually, contributes to comprehensive suburb understanding.
This classification system directly addresses analysis paralysis by guiding investors toward the metrics that matter most for their objectives. Rather than treating all 150+ data points equally, the hierarchy creates a structured framework for data analytics that mirrors how professional analysts evaluate markets.
Timeframe-Aligned Metrics: Short, Medium, and Long-Term Analysis
Property investment success depends heavily on matching your strategy to appropriate timeframes. A suburb performing brilliantly over the next two years may underperform over a decade, while a long-term growth story might require patience before delivering returns.
Dex™ classifies each metric by its relevant timeframe:
Short-term metrics identify suburbs with immediate momentum—those likely to deliver returns within one to three years. These indicators capture current market heat, including days on market trends, recent sales velocity, and emerging demand signals.
Medium-term metrics surface suburbs transitioning into growth phases over four to six years. These markets often represent the optimal balance between competition and growth potential.
Long-term metrics highlight suburbs with fundamental drivers that support sustained appreciation over seven to ten years, including infrastructure pipelines, demographic shifts, and supply constraints.
This temporal classification allows investors to layer information strategically. If you need to extract equity in two years to fund additional purchases, you’ll weight short-term indicators heavily. If you’re building a ten-year portfolio, long-term fundamentals take precedence.
Find Your Top-Performing Suburb Instantly
Overcome analysis paralysis by comparing thousands of markets against the metrics that actually drive growth.

Customisable Weightings: Tailoring Analysis to Your Brief
Every investor’s brief differs. Your budget, investment timeframe, risk tolerance, and equity extraction goals create a unique profile that should inform which metrics receive priority. Dex™’s multiplier system enables precisely this customisation.
The platform allows you to assign weightings or multipliers to specific metrics, amplifying their influence on final rankings. If you’re focused on capital growth for a two-year equity extraction, you might weight momentum indicators and days-on-market data more heavily. If cashflow is paramount, rental yield and vacancy rate metrics receive higher multipliers.
A built-in cheat sheet guides users through the weighting process, showing how different multiplier configurations affect outcomes and which weightings are typically appropriate for various investment strategies.
From Strategy to Shortlist: Streamlined Suburb Research
When combined with HTAG’s Goal Matching feature, Dex™ becomes even more powerful. Selecting your strategy pre-populates optimal weightings across all 150+ metrics based on your investment profile. This eliminates manual configuration and ensures your analysis aligns with your brief.
The workflow proceeds as follows:
- Define your strategy using Goal Matching (investment objective, budget, timeframe, equity extraction goals)
- Access Dex™ with pre-configured metric weightings
- Generate Dex™ scores across the entire suburb database
- Review ranked suburbs with scores reflecting your specific criteria
- Shortlist top performers for detailed due diligence
This process transforms what was traditionally weeks of manual research into minutes of structured analysis, dramatically reducing opportunity cost while increasing decision confidence.
The 150+ Metrics Powering Suburb Intelligence
HTAG has assembled Australia’s most comprehensive property data library, with upward of 150 metrics and expanding. These metrics span multiple dimensions of suburb performance:
Returns indicators capture historical capital growth, rental yield, and income potential—the metrics directly measuring investment performance.
Fundamental metrics assess underlying suburb health through economic indicators, employment data, and demographic composition.
Supply metrics evaluate listing volumes, building approvals, inventory levels, and development pipelines that influence future price movements.
Demand metrics measure buyer and tenant activity through days on market, auction clearance rates, vacancy rates, and absorption rates.
Each metric undergoes rigorous testing to validate its predictive value. Unlike platforms that simply aggregate data, HTAG’s predictive analytics framework ensures metrics contribute meaningfully to suburb ranking accuracy.
Eliminating Analysis Paralysis Through Structure
The greatest barrier to investment action isn’t lack of information—it’s information overload. When faced with too many variables, investors either make rushed decisions based on incomplete analysis or become paralysed, missing opportunities while searching for certainty that never arrives.
Dex™ addresses this challenge through structure:
Hierarchical organisation tells you which metrics deserve attention first Timeframe classification focuses analysis on relevant indicators for your strategy Customisable weightings ensure your priorities drive the ranking Automated scoring eliminates manual comparison across thousands of suburbs Visual ranking outputs present clear, actionable shortlists
This structured approach replaces scattered spreadsheet analysis with systematic, data-driven decision-making that professional property professionals employ.
Academic Rigour Behind the Platform
HTAG’s methodology reflects academic research standards. The 80/20 location-to-asset principle draws from peer-reviewed studies in property economics journals. Metric selection and weighting calibrations undergo statistical validation to ensure predictive accuracy.
This research-backed approach separates HTAG from platforms that simply display raw data. Every metric inclusion, hierarchy classification, and default weighting reflects evidence-based analysis of what actually drives suburb performance across different market conditions and investment timeframes.
Making Confident Property Decisions
Investment confidence comes from knowing your analysis is comprehensive, your methodology is sound, and your shortlist reflects genuine opportunity rather than gut feeling or media hype. Dex™ delivers this confidence by:
Eliminating blind spots through comprehensive metric coverage across returns, fundamentals, supply, and demand Reducing bias through systematic, weighted analysis rather than subjective assessment Accelerating research from weeks to minutes without sacrificing analytical depth Aligning analysis with strategy through customisable weightings matched to your investment brief
Whether you’re a first-time property investor or managing a growing portfolio, Dex™ provides the market insights and analytical power to identify suburbs with minimal opportunity cost and maximum alignment with your goals.


