

Education Hub
Our education hub is a place for investors to explore key property insights. Learn about fundamental, supply, and demand metrics, stay updated with market news, and access helpful guides to make informed decisions.


Education Hub
No comments
Area vs Property: What Drives 85.7% of Growth [2026]
Area or the perfect property? HtAG data on 1,157 markets shows the area explains 85.7% of 5-year capital growth — and a $648,568 gap between regions.
No comments
How to Use Equity to Buy Your Next Investment Property in Australia [2026]
A data-driven guide to equity recycling in Australia: how much equity you can release, and how to screen the redeploy suburb with live HtAG signals.

No comments
Vacancy Rates by Suburb in Australia: What the Data Reveals About Investment Risk [2026]
Vacancy rates above 3% signal an 84% probability of yield decline within two quarters. Learn how to read suburb-level vacancy data — and the traps investors miss — using HtAG Analytics data.

No comments
How Buyers Agents Research Suburbs: The 6-Step Data Framework [2026]
How do professional buyers agents research suburbs? HtAG Analytics breaks down the 6-step data framework used across 135+ validated recommendations — from macro filtering to street-level due diligence.

No comments
Suburb Median Price Growth: What the Numbers Really Mean for Property Investors [2026]
HtAG Analytics reveals why raw suburb median price growth misleads investors — and the forward-looking metrics that detect market turns 6-12 months earlier.
![What Is the Property Market Cycle in Australia? The 4 Phases Explained [2026]](https://www.htag.com.au/wp-content/uploads/2026/03/cycle.png)
No comments
What Is the Property Market Cycle in Australia? The 4 Phases Explained [2026]
The property market cycle in Australia moves through 4 phases. HtAG Analytics tracks cycle position across 15,000+ suburbs — 18% are in Phase 1 recovery as of Q1 2026.

No comments
Suburb Growth Forecasts Australia 2026: Where the Data Points Next
HtAG Analytics data across 3,704 suburbs reveals Victoria leads with 196 suburbs entering recovery phase. State-by-state 2026 growth forecasts inside.

No comments
Best Suburbs to Invest in Victoria 2026: Why the Answer Depends on Your Brief
The best Victorian suburb to invest in depends entirely on your hold period, equity extraction timing, and risk profile. Here is why a generic suburb list will mislead you — and what brief-driven suburb selection actually looks like.

No comments
Suburb Growth Forecasts 2026: Where the Growth Rate Cycle Is Signalling Early Momentum
HtAG Analytics data identifies 392 suburbs in early GRC momentum for 2026. Regional Victoria leads with Camperdown (5.0% yield, 0.23% vacancy) and Hamilton (4.7% yield, RCS 88) flagged as early-cycle opportunities.

No comments
LGA vs Suburb Data: Why Council-Level Averages Hide the Best Investment Suburbs in Australia
HtAG Analytics data across 196 LGAs shows the average growth spread between best and worst suburbs within a single council area is 47–60 percentage points. Here’s why suburb-level analysis is essential.

No comments
The IRSAD Crossover Effect: Why Lower Socioeconomic Suburbs Outperform Premium Markets on Capital Growth
HtAG Analytics data across 3,603 suburbs shows IRSAD decile 1 suburbs averaged 88.5% five-year growth vs 36.3% for decile 10 — a 52-point gap. The crossover zone (IRSAD 2–5) offers the best risk-adjusted returns.

No comments
The Danger of AI Property Advice: Why Full Data Beats 3 Metrics (Salisbury North Case Study)
ChatGPT recommended Salisbury North as a top SA investment suburb using 3 metrics. HtAG Analytics ran 106 data points and found elevated risk, fading momentum, and an RCS of just 21/100.

No comments
How to Check Public Housing Rates Before Buying an Investment Property – And Why It Matters
HtAG Analytics data across 3,603 suburbs shows suburbs with 0–2% public housing delivered 73.5% five-year growth vs 42.5% for those above 20%. Here’s how to screen before you buy.

No comments
Why Cheap Suburbs Deliver Poor Returns – And How to Find Undervalued Suburbs in Australia
HtAG Analytics data across 4,254 suburbs reveals why cheap suburbs underperform and how to find genuinely undervalued suburbs in Australia using IRSAD and affordability metrics.

No comments
Australian Property Market Review 2025 – What 3,600 Suburbs Reveal Heading into 2026
HtAG Analytics data across 3,600 suburbs: WA led 2025 at 14.2% growth, VIC trailed at 4.7% — but Victoria is the only state with expanding yields and early-cycle recovery signals heading into 2026.
Product Demos

No comments
Australian Property Forecasts 2026: What 2.3 Million Data Points Reveal About the Next 12 Months
Short Summary A property market forecast is only as good as the data and methodology behind it. HtAG Analytics has … Read more

No comments
How to Use Property Heatmaps to Spot Unrealised Investment Value (aka Gentrification)
Short Summary Stop waiting decades for gentrification. Learn how to use HtAG’s Street Lens and granular property heatmaps to identify … Read more

No comments
Top 10 High-Yield Suburbs in Regional Australia (2026 Q1 Update): An HTAG Analytics Report
Short Summary The Q1 update confirms that opportunity exists for those who look beyond the headlines. Whether it is the … Read more
No comments
HtAG vs. Free Property Data: Why “Free” Costs You Money
Short Summary While free property data is useful for casual browsing, it provides only a “descriptive” view of the market—telling … Read more

No comments
5 Predictive Metrics to Find Suburbs About to Boom (Backed by Data)
Short Summary The five signs a suburb is about to boom aren’t mysterious. They’re quantifiable, observable, and predictable when you … Read more
No comments
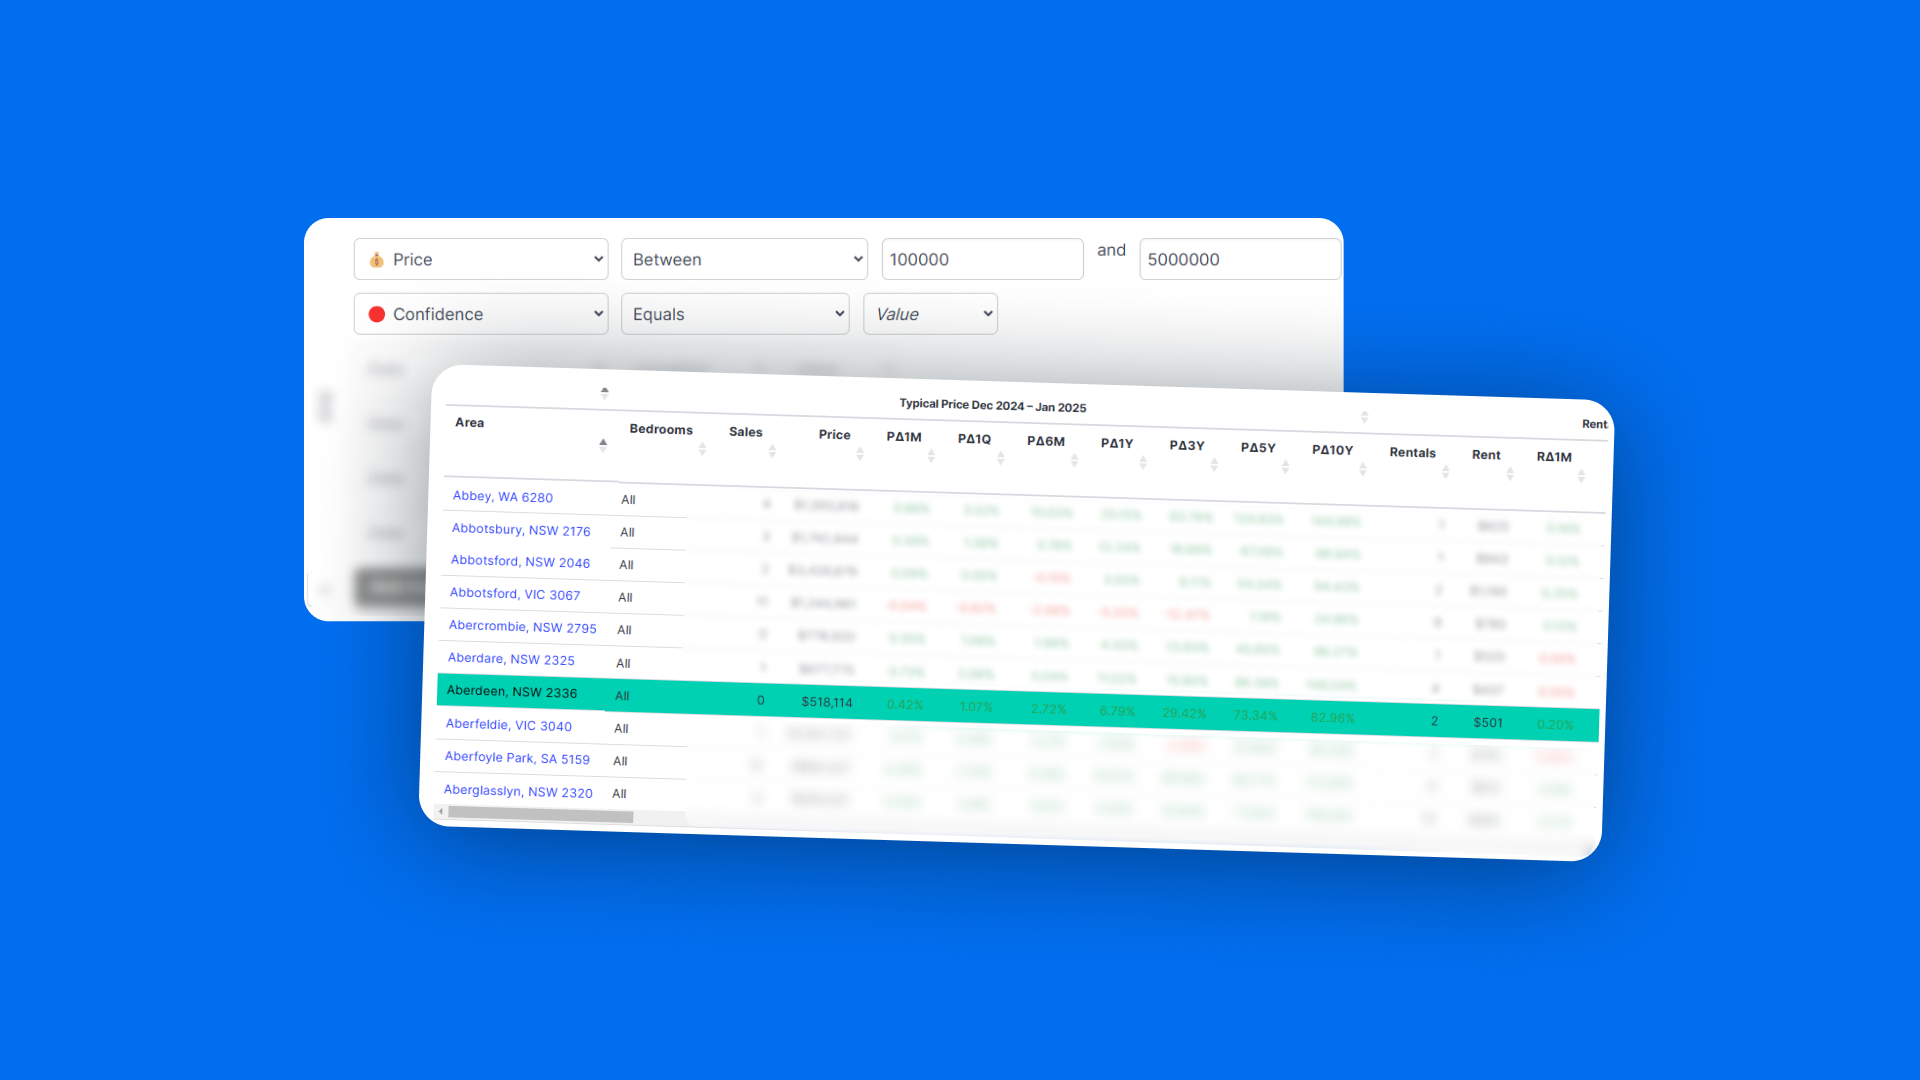
Dex™ Suburb Ranking: Compare Thousands of Suburbs Across 150+ Property Investment Metrics
Short Summary Location accounts for approximately 80% of a property’s capital growth—not the asset itself. This well-established principle fundamentally changes … Read more
No comments
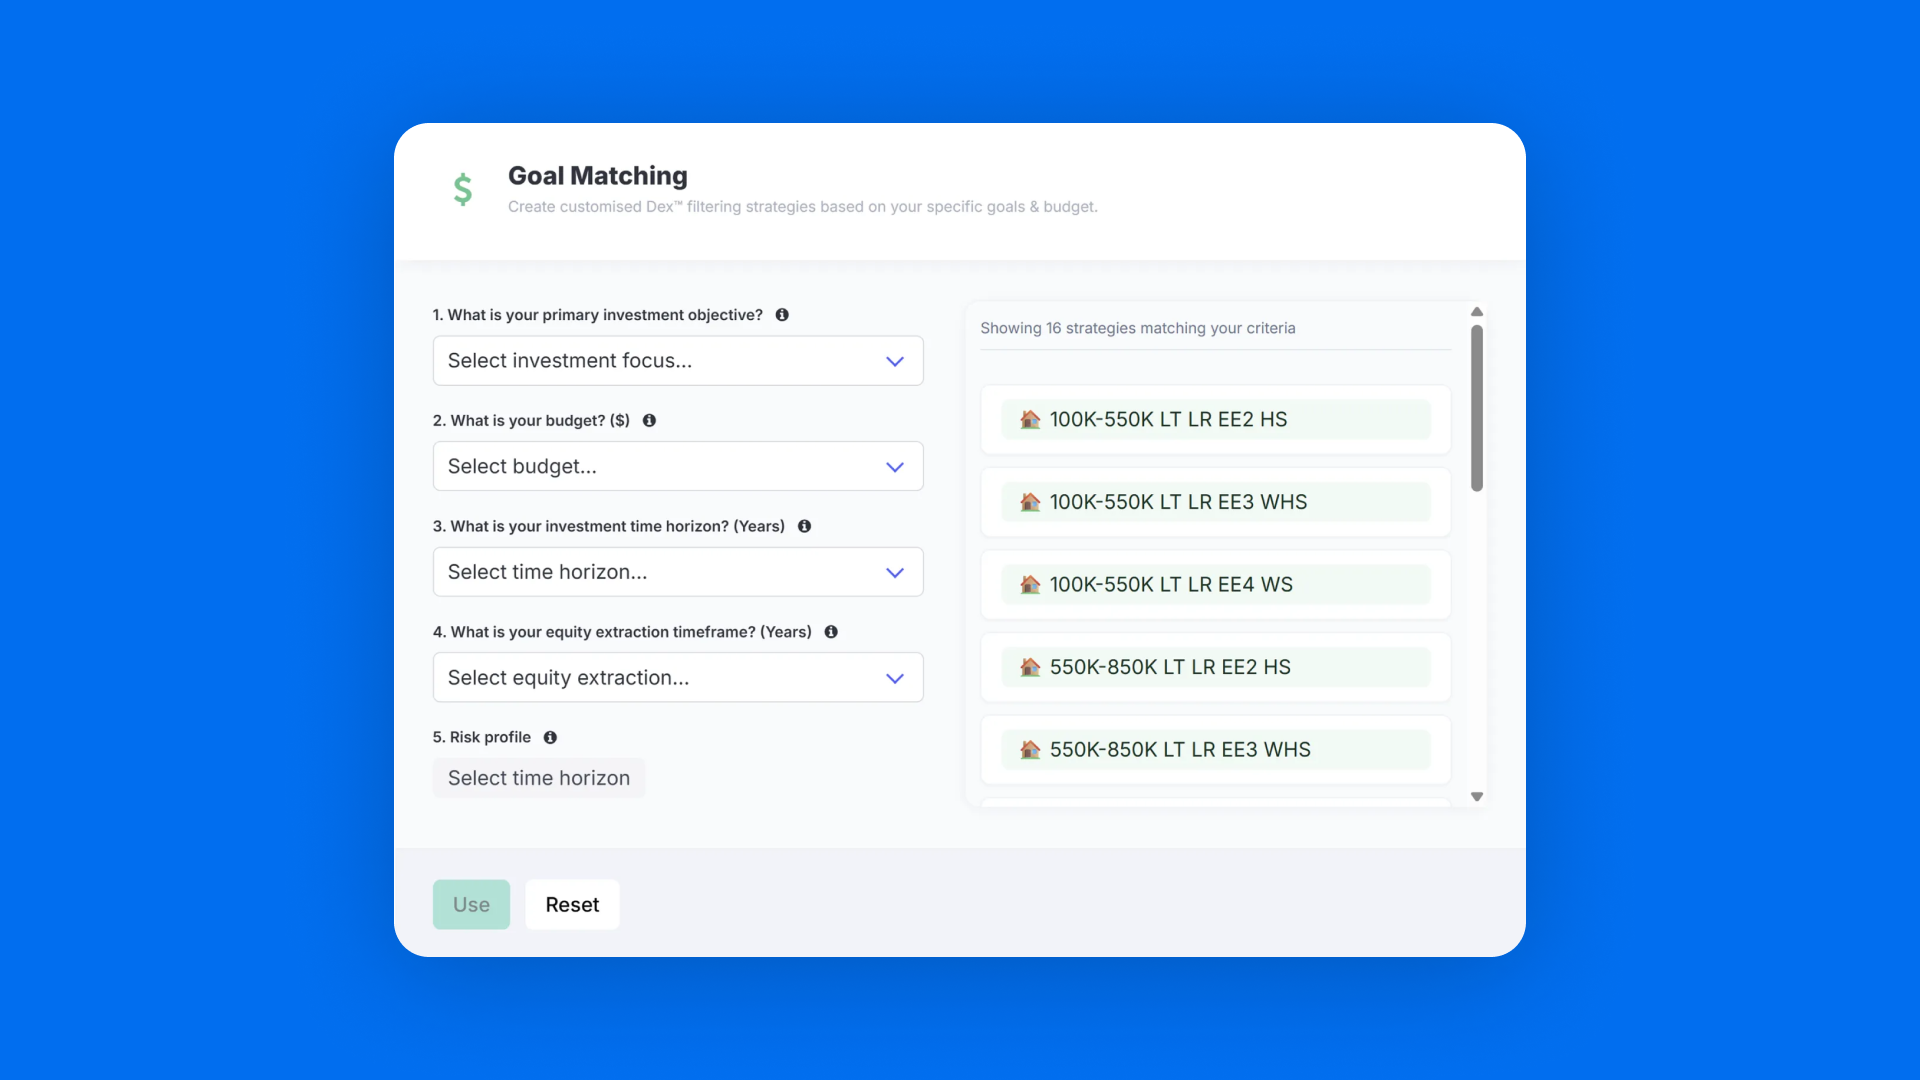
Goal Matching: The Data-Driven Approach to Aligning Property Investment with Your Financial Objectives
Short Summary Not every suburb is a hotspot for every investor. This fundamental truth underpins successful property investment, yet it’s … Read more
Fundamental Metrics

1 comment
Unravelling Property Affordability via the “Years to Own” Metric
As property prices have continued to soar across Australia in the past 3 years, prospective homebuyers are grappling with the … Read more
2 comments
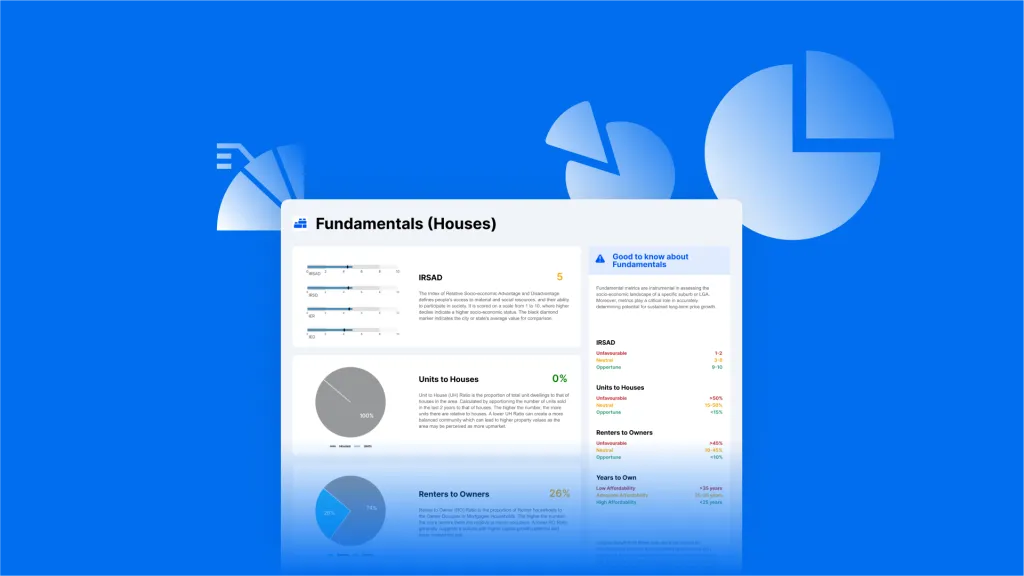
Market Fundamentals: Renter to Owner, Unit to House Ratio & IRSAD
In this article we explore 3 fundamental real estate market metrics and explain why many investors chose to benchmark suburbs … Read more
Supply Metrics
7 comments
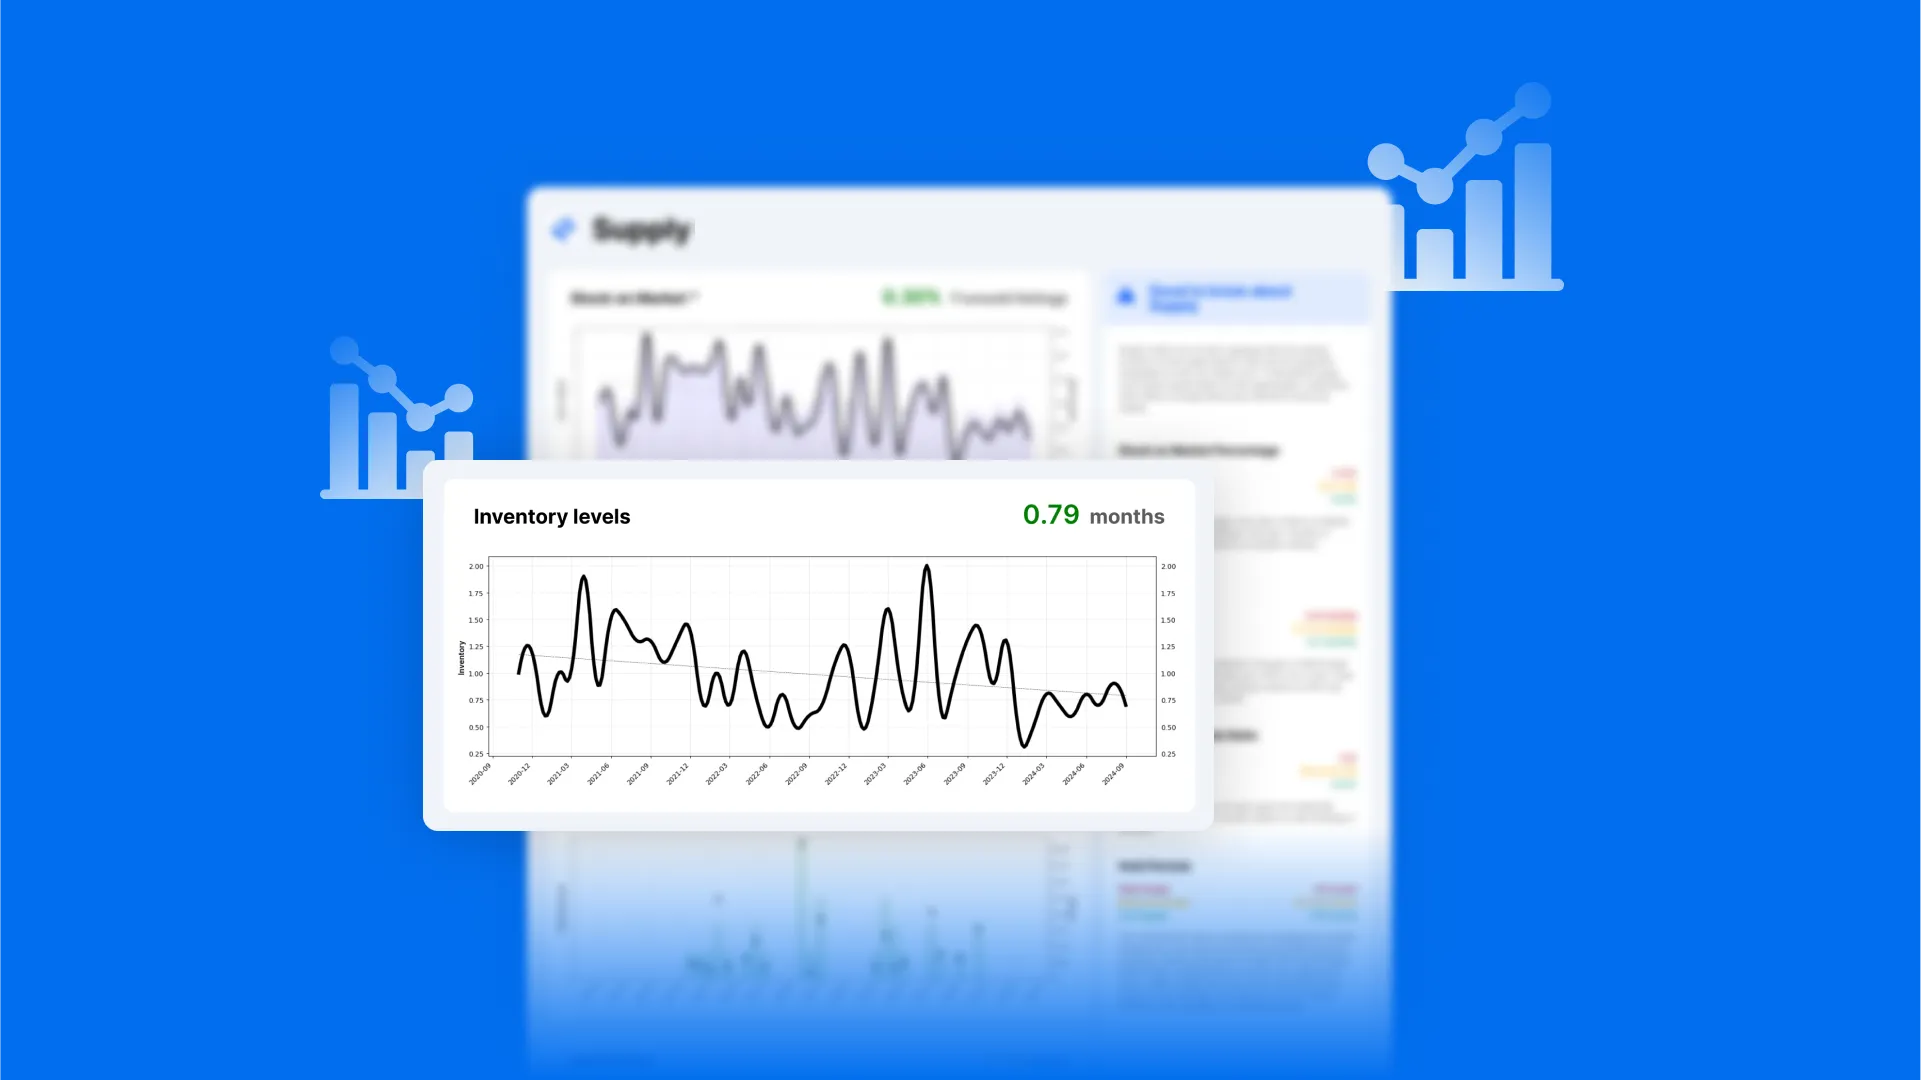
Inventory Levels – Measuring Months of Supply
The real estate market is always changing. Inventory metric (also known as months of supply) is a major indicator of … Read more
1 comment
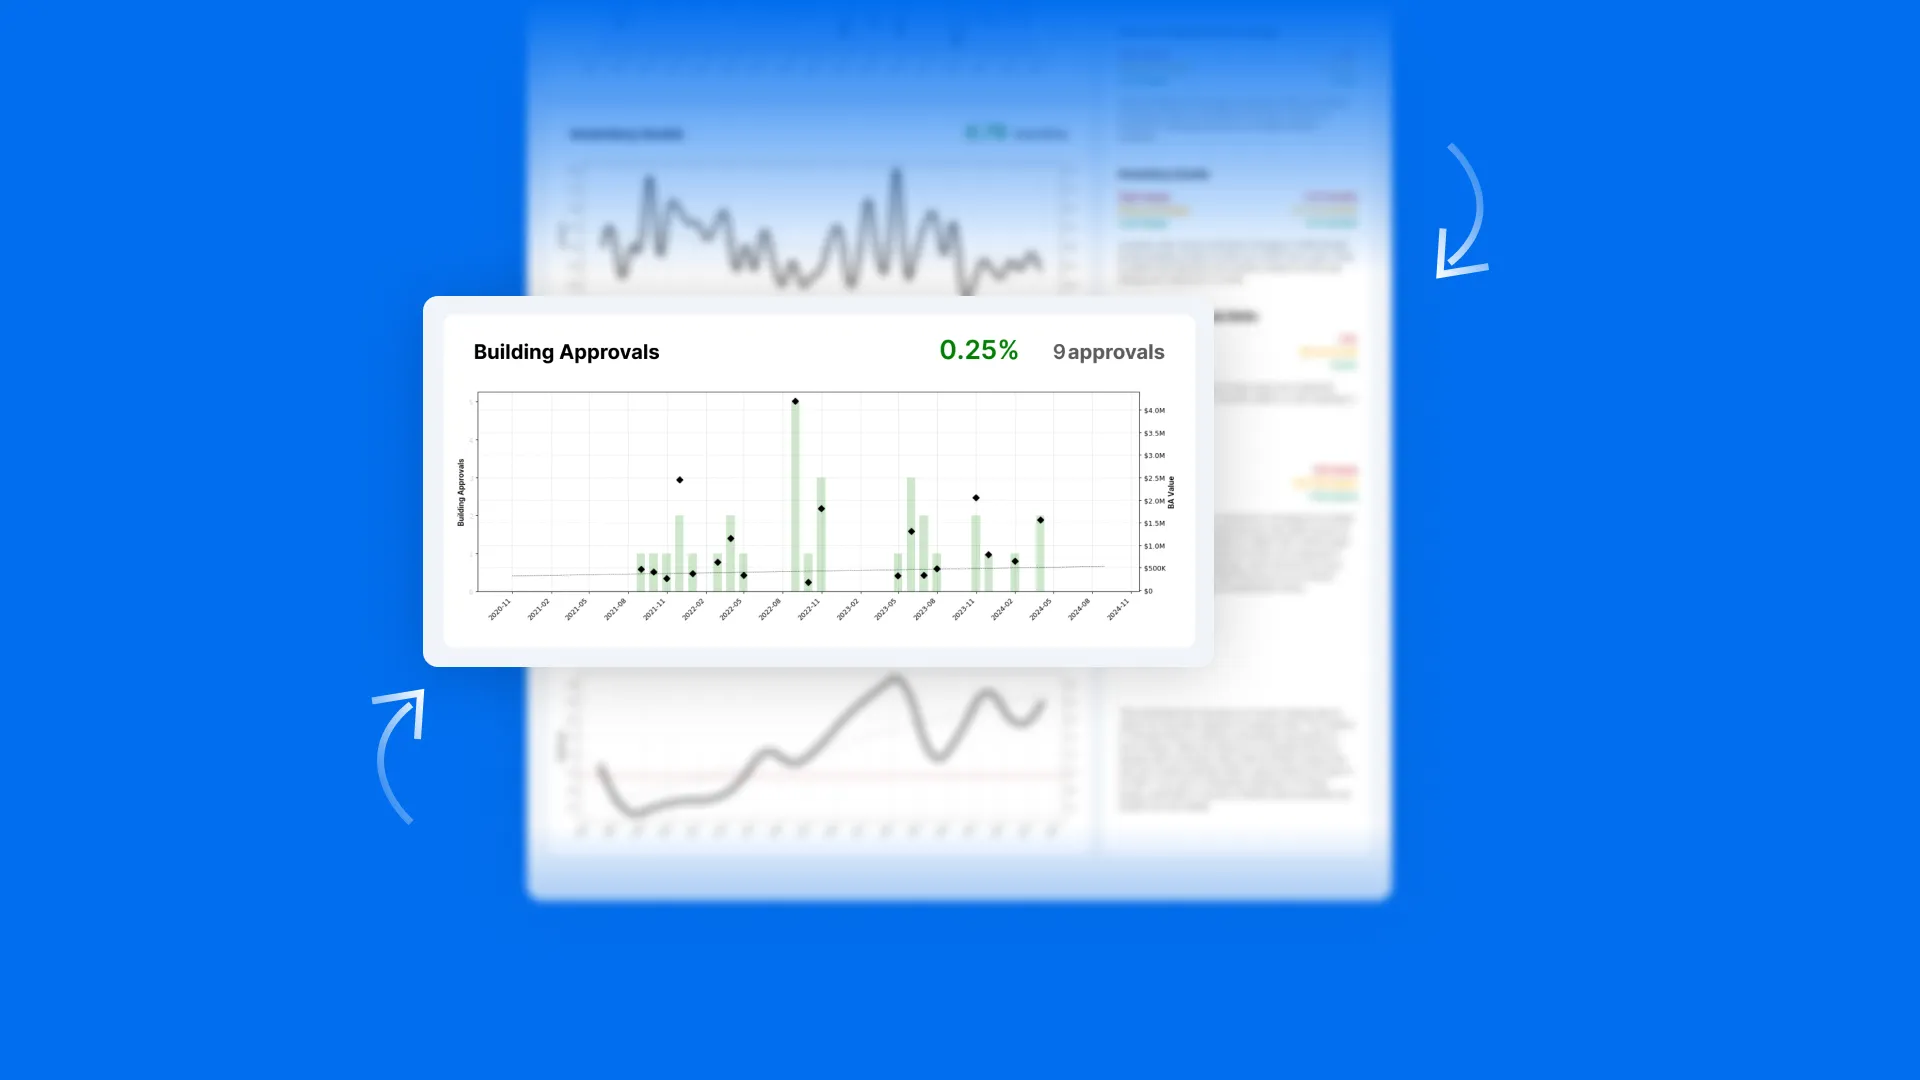
The Role of Building Approvals in Projecting Future Housing Supply
Building approvals are crucial numbers in the building industry and provide an insight into the trends and current state of … Read more

2 comments
Use Real Estate Hold Periods as a Supply Indicator
Real estate hold periods offer valuable insights into the property market, providing an indicator of supply by measuring the duration … Read more
8 comments
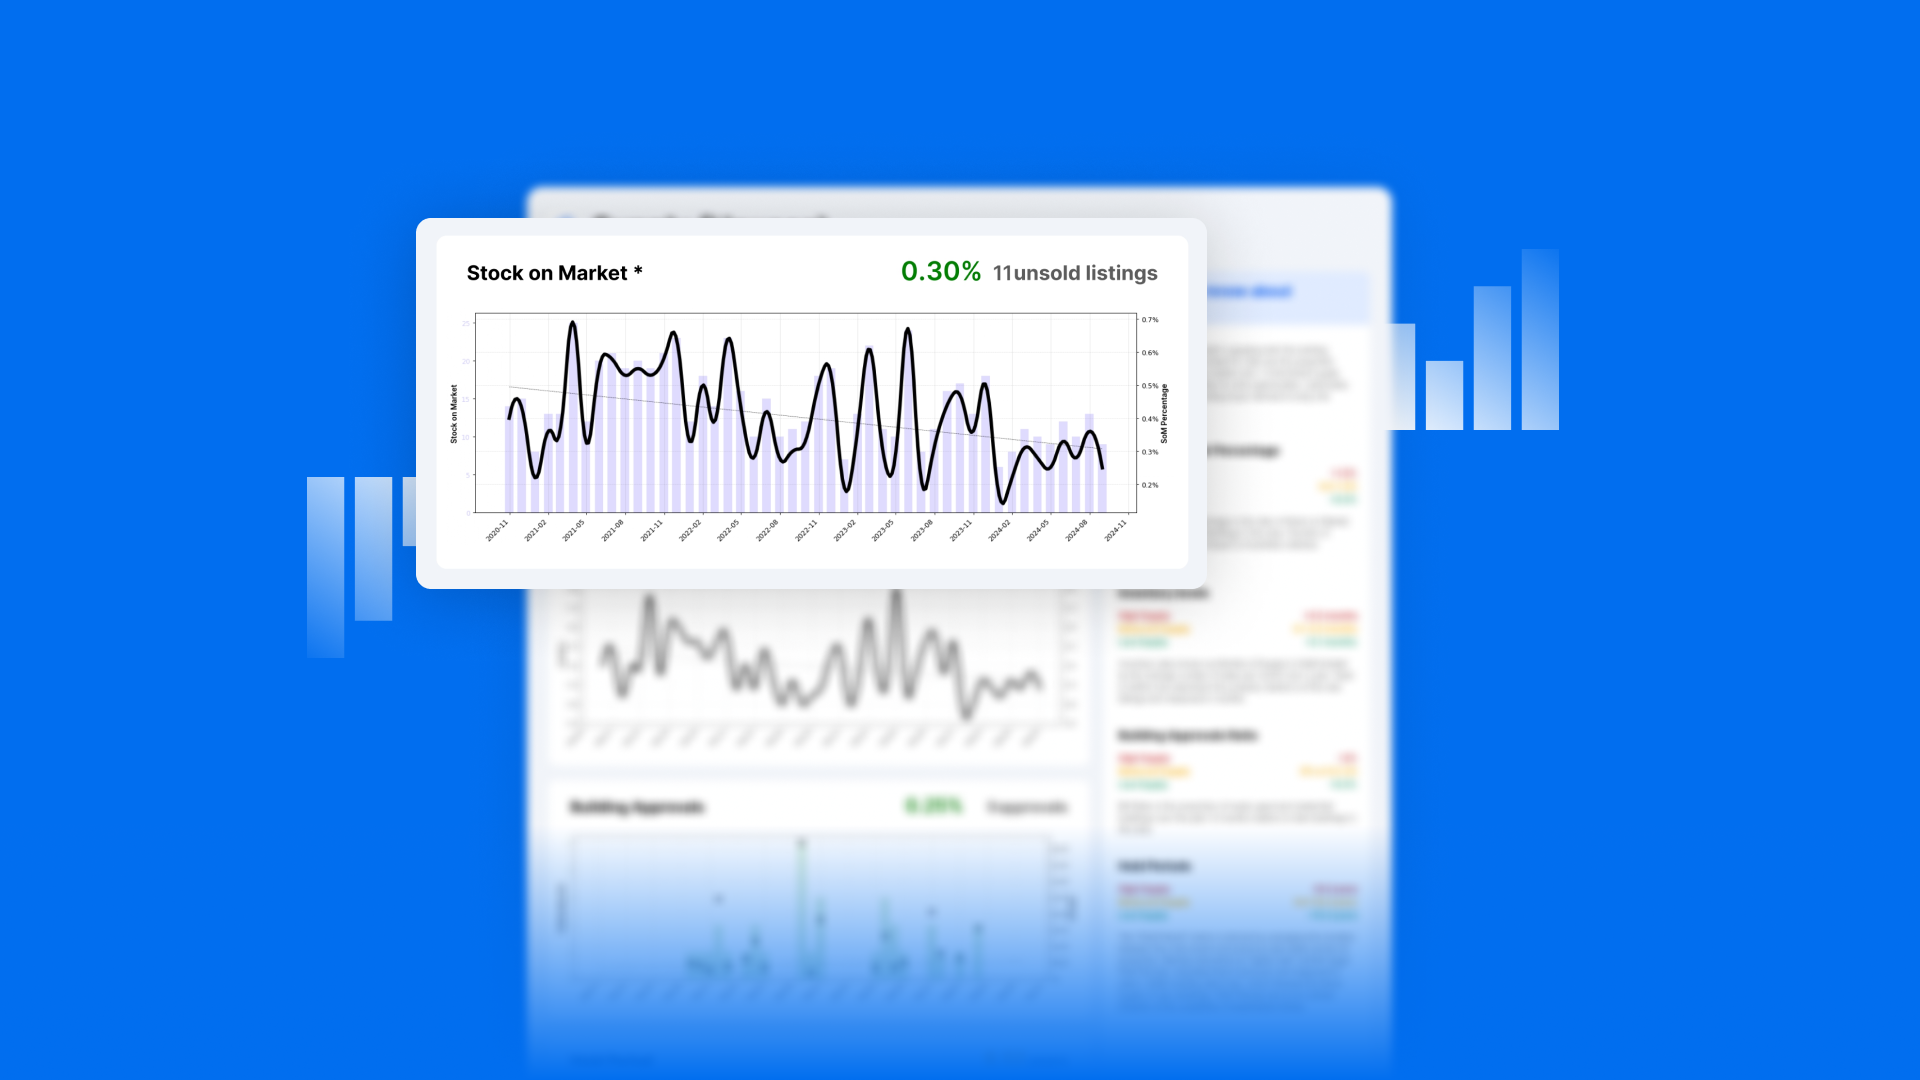
Understanding Stock on Market (SoM) for Real Estate Investment
If you’re serious about property market research it’s crucial to get a grasp on the role of the ‘Stock on … Read more
Demand Metrics
10 comments
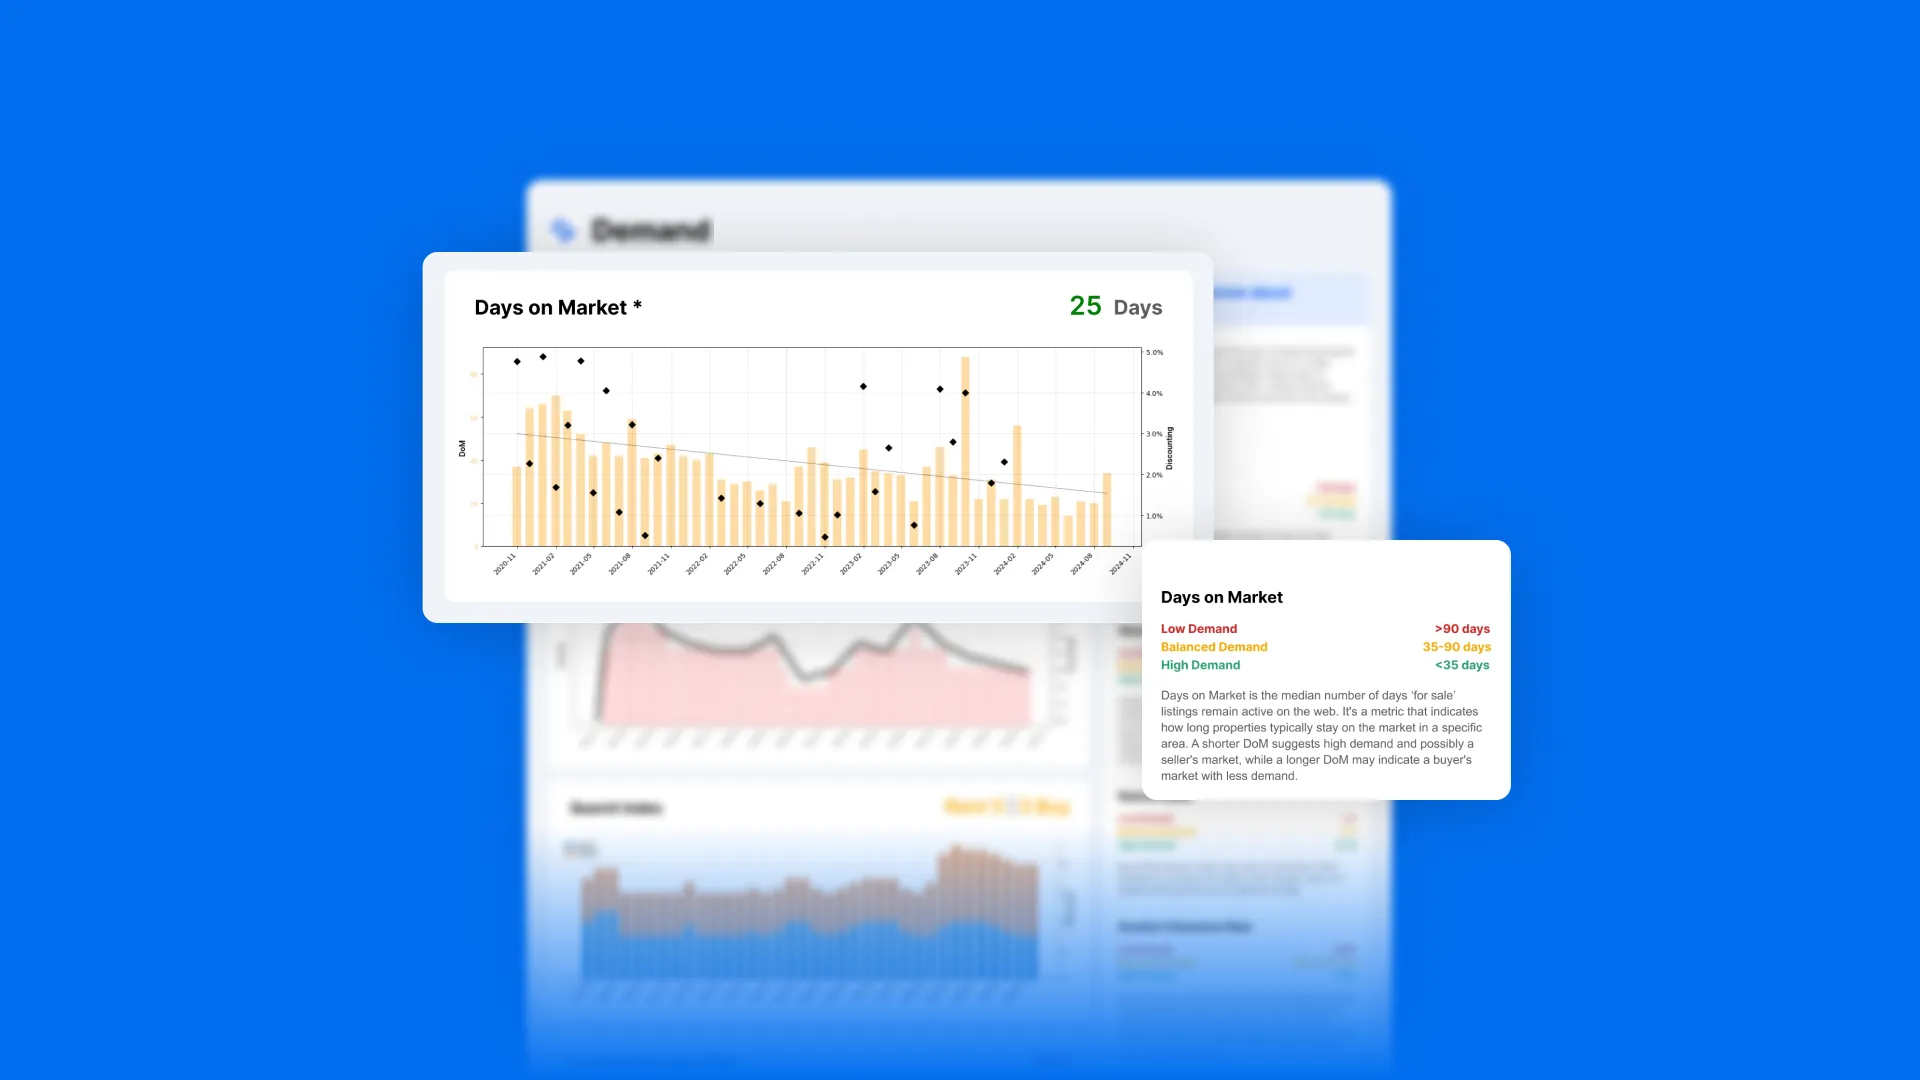
Breakdown of Days on Market (DoM) and Discounting Metrics
Navigating the real estate market requires a deep understanding of key indicators that shape investment decisions. Two such pivotal metrics … Read more

13 comments
Vacancy Rate Metric Explained
Vacancy rate is a key indicator of the real estate rental market. It essentially tells you how easy it is … Read more
No comments
What do Auction Clearance Rates Mean for Property Buyers and Sellers?
If you’re thinking of selling your property at auction, you’ll want to know what clearance rates are and how they … Read more
1 comment
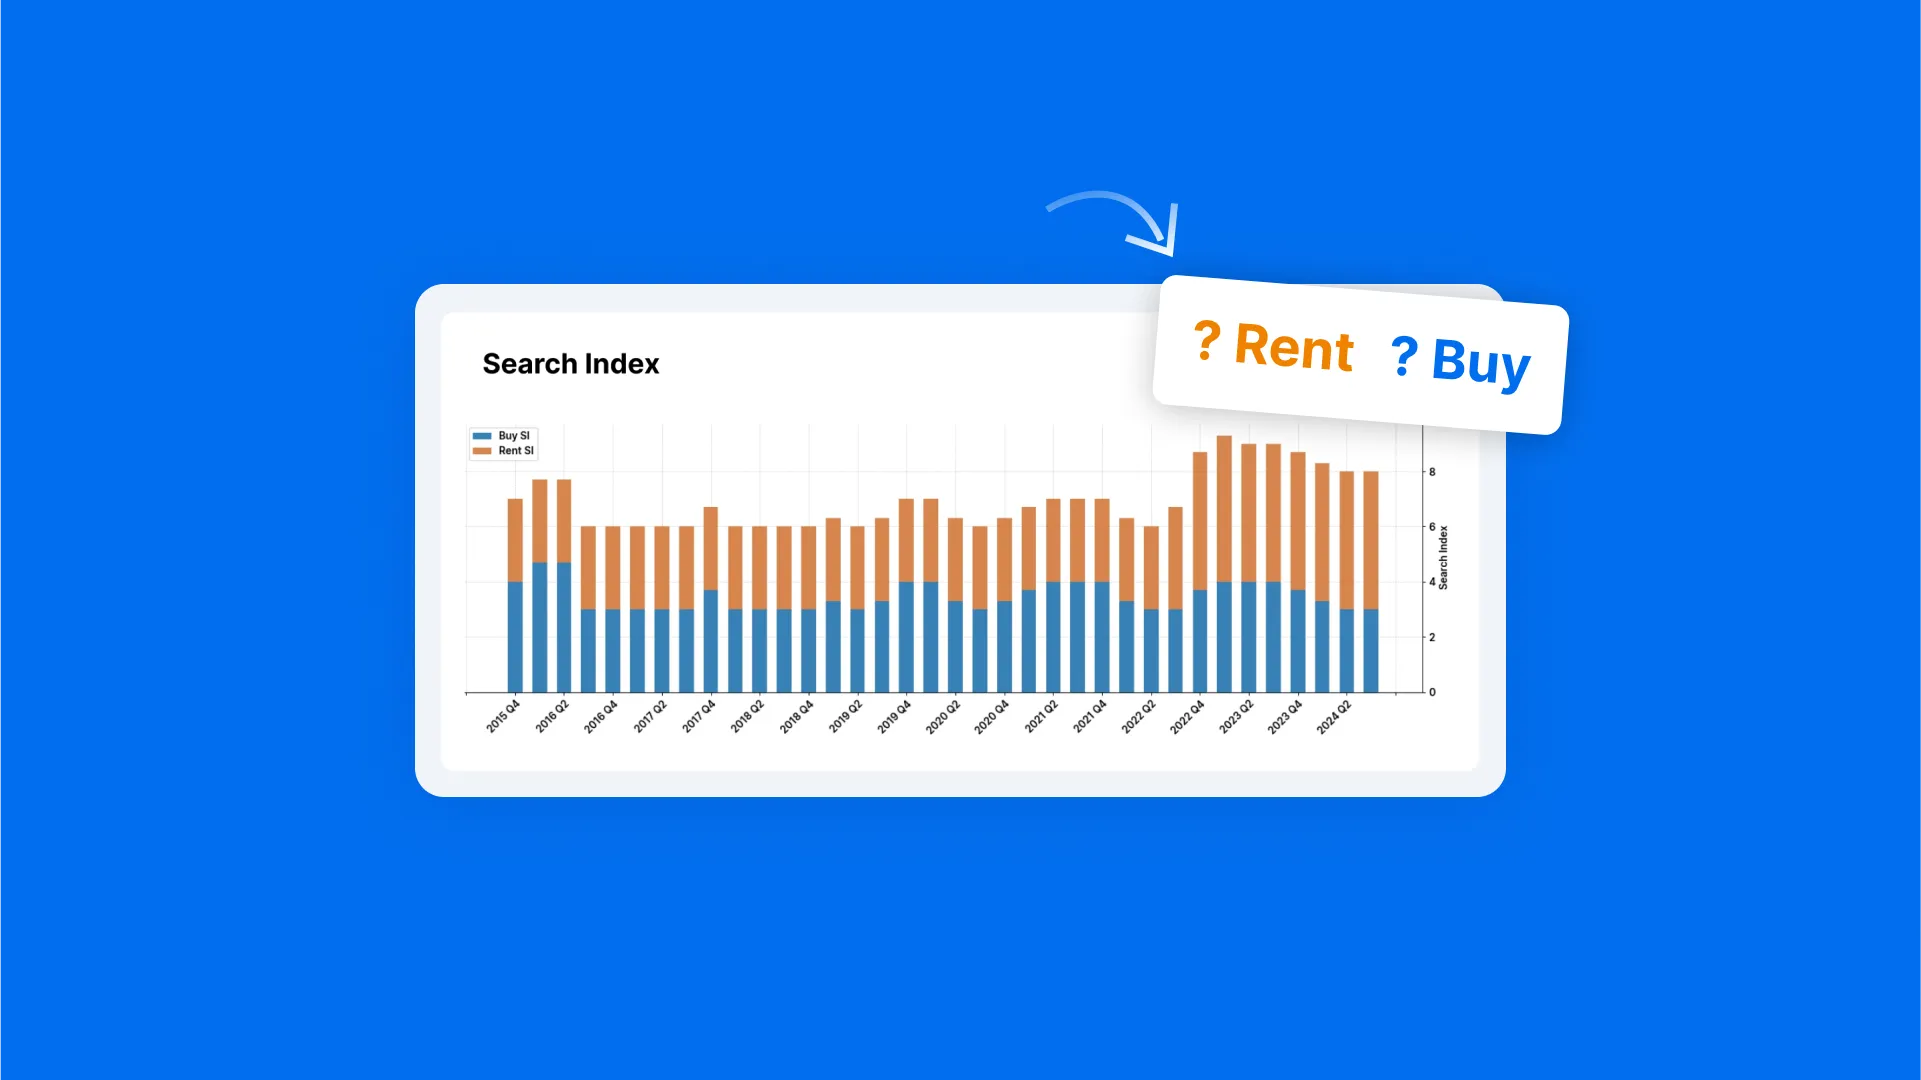
Online Search Index: A Valuable Metric For Understanding Market Demand
More and more Australians are using the internet to research their housing options, and this is having a major impact … Read more


Dive into our extensive library of educational articles crafted by industry experts to level up your property investment game. From market trends and analysis to risk management and wealth-building strategies, we cover all aspects of successful data-driven real estate investing. Equip yourself with the knowledge and confidence to make informed decisions and maximize your investment returns.
Have a question? Leave a comment below.
Do you have a Macro measure for NoM (Net Overseas Migration) as a contributing factor for growth forecasting?
Hi Dan,
Thanks for bringing up such an insightful query.
Indeed, net overseas migration (NoM) plays a significant role in socio-economic changes at a national and state level. At HtAG, our strength lies in delving into detailed metrics to discern market conditions at the more granular levels of Local Government Areas (LGAs) and suburbs throughout Australia.
However, it’s important to note that NoM data at such a detailed level is not available.
Our approach, therefore, involves employing a hierarchical method in our predictive modeling. This means we integrate insights from broader levels – including country, state, and major city data – as contextual indicators that bolster our analysis at the more specific LGA and suburb levels.
While net overseas migration is indeed a key driver, particularly in major cities like Sydney, Melbourne, and Brisbane, its impact tends to be more nuanced when examining suburbs within these capitals. This is because the dispersion of migrants across a city’s suburbs is influenced by a variety of factors that our platform already accounts for.
Some of these factors include employment opportunities, economic diversity, socioeconomics, and housing characteristics, among others.
Therefore, even if precise NoM data were available for LGAs and suburbs, its direct impact might be less significant than it appears, given that our predictive models already incorporate a wide range of over 50 metrics to assess market potential at this local level. These metrics effectively capture the underlying growth scenarios that NoM would contribute to, enabling a comprehensive analysis without direct NoM data.
In summary, while NoM is a critical macro measure for understanding growth trends, especially in larger cities, our platform’s detailed examination of a broad set of metrics ensures a thorough market analysis that supplements migration impacts with other critical factors at the local level.
Where can I find DeX tutorials to learn ?
Hi Karan,
You’ll find Dex tutorials (and many other valuable resources) in our Mastermind Community. You can access Mastermind from your HTAG account dashboard – simply click on the community link to get started.
Just a quick note: Mastermind requires a separate signup from your main HTAG account. However, if you join using the same email address you used for HTAG, you’ll automatically unlock additional membership levels and features.