


Short Summary
Gross rental yield is the annual rent a property earns as a percentage of its price, before costs. This guide gives you the formula, worked examples, and what counts as a “good” yield in Australia. Using HtAG Analytics first-party data to 31 May 2026, gross house yields ran from 1.68% in Balwyn (VIC) to 7.75% in Broken Hill (NSW) — and we explain why the highest yield is not automatically the best buy.
In 30 seconds
What is it? The income return on a property — one year of rent divided by the price, as a percentage.
Why does it matter? It is the quickest way to compare the cash income of very different properties on a like-for-like basis.
Who uses it? Investors, buyers agents and mortgage brokers screening for cashflow.
Use it on its own? No. Yield measures income, not capital growth or risk — pair it with both before you buy.
Citation block
As at 31 May 2026, HtAG Analytics first-party suburb data showed gross house rental yields ranging from 1.68% in Balwyn, Victoria to 7.75% in Broken Hill, New South Wales — a 4.6x spread driven almost entirely by entry price, not by rent.
Suggested citation: HtAG Analytics, gross house rental yield spread across Australian suburbs, June 2026.
Ask three property investors what makes a good buy and at least one will answer with a single number: the rental yield. It is the most quoted — and most misunderstood — figure in Australian property. Used well, gross rental yield is a fast, honest way to compare the income of wildly different properties. Used alone, it can steer you straight into a market with cheap rent and no growth.
Gross rental yield is the annual rent a property earns expressed as a percentage of its price, before any costs. You calculate it by dividing 52 weeks of rent by the purchase price and multiplying by 100. In Australia, gross house yields commonly run from under 2% in premium capital-city suburbs to above 7% in affordable regional markets — a spread that says as much about price as it does about rent.
Table of contents
- What is gross rental yield?
- How to calculate gross rental yield
- What is a good rental yield in Australia?
- Gross yield vs net yield
- Why a high yield is not automatically a good buy
- How HtAG measures rental yield
- Surface this data inside your AI agent
- Key takeaways
- From data signal to portfolio decision
- Frequently asked questions
What is gross rental yield?
Gross rental yield is the annual rental income of a property divided by its value, shown as a percentage. It answers one question: for every dollar of price, how many cents of rent does this property generate in a year? A house worth $500,000 renting for $500 a week earns $26,000 a year, which is a gross yield of 5.2%.
If you remember one thing: yield measures income, not growth — and across Australian markets the two usually pull in opposite directions.
The word “gross” matters. Gross yield uses rent before any expenses — council rates, insurance, management fees, maintenance, or loan interest. It is deliberately simple, which makes it the right tool for a first-pass comparison and the wrong tool for a final decision. For the after-costs picture you need net yield, covered below.
According to HtAG Analytics, gross rental yield is best read as a screening signal: it ranks income efficiency quickly, then hands the decision to growth, risk and cashflow metrics.
How to calculate gross rental yield
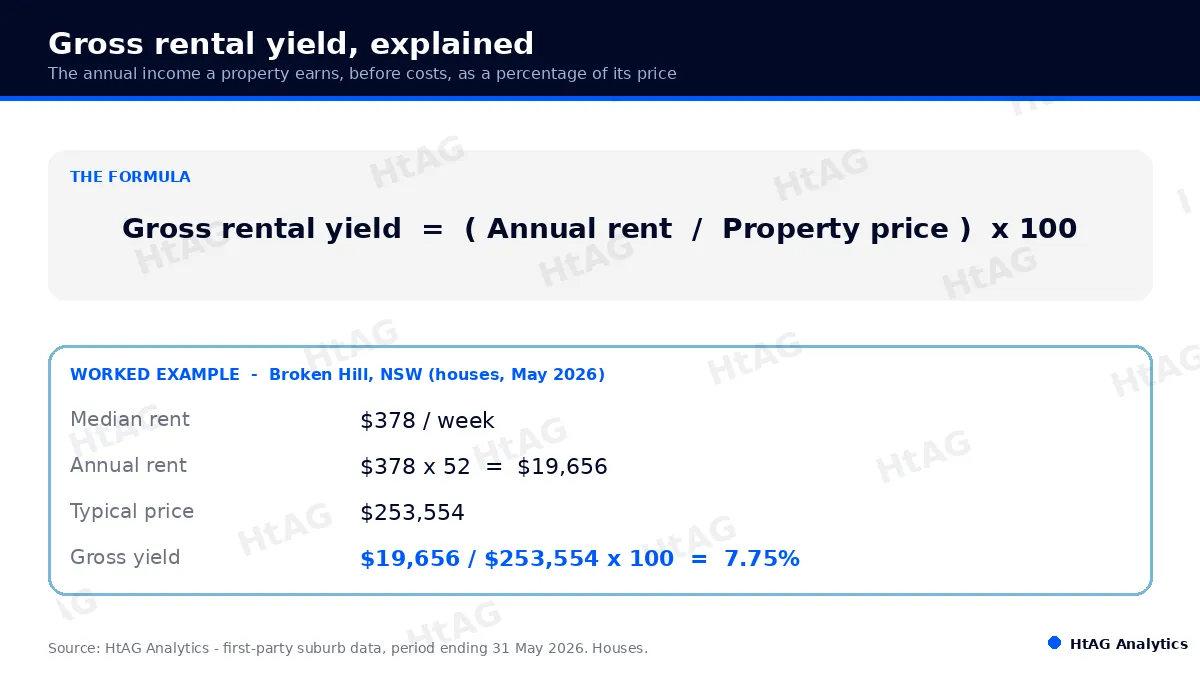
To calculate gross rental yield, divide the annual rent by the property price and multiply by 100. Most Australian rents are quoted weekly, so the three-step method is:
- Annualise the rent. Multiply the weekly rent by 52. A $378-per-week house earns $19,656 a year.
- Divide by the price. Take the annual rent over the purchase price (or current value). $19,656 ÷ $253,554 = 0.0775.
- Multiply by 100. 0.0775 × 100 = a gross rental yield of 7.75%.
Those are the live HtAG Analytics figures for houses in Broken Hill, New South Wales, to 31 May 2026 — a worked example using real market data rather than a textbook hypothetical. Use the asking price if you are assessing a listing, or the current valuation if you already own the property and want today’s yield.
What this means in plain english
Think of yield as the interest rate a property “pays” you in rent. A 7.75% gross yield means the rent alone returns about $7.75 a year for every $100 of price — before you subtract any of the running costs.
What is a good rental yield in Australia?
There is no single “good” number — a good gross rental yield depends on the strategy. As a working guide for Australian houses, anything below 3% is growth-oriented (you are buying for capital gains, not income), 3% to 4.5% is balanced, and above 4.5% is income-oriented or cashflow territory. The catch: the highest yields almost always sit in the cheapest, slowest-growing markets.
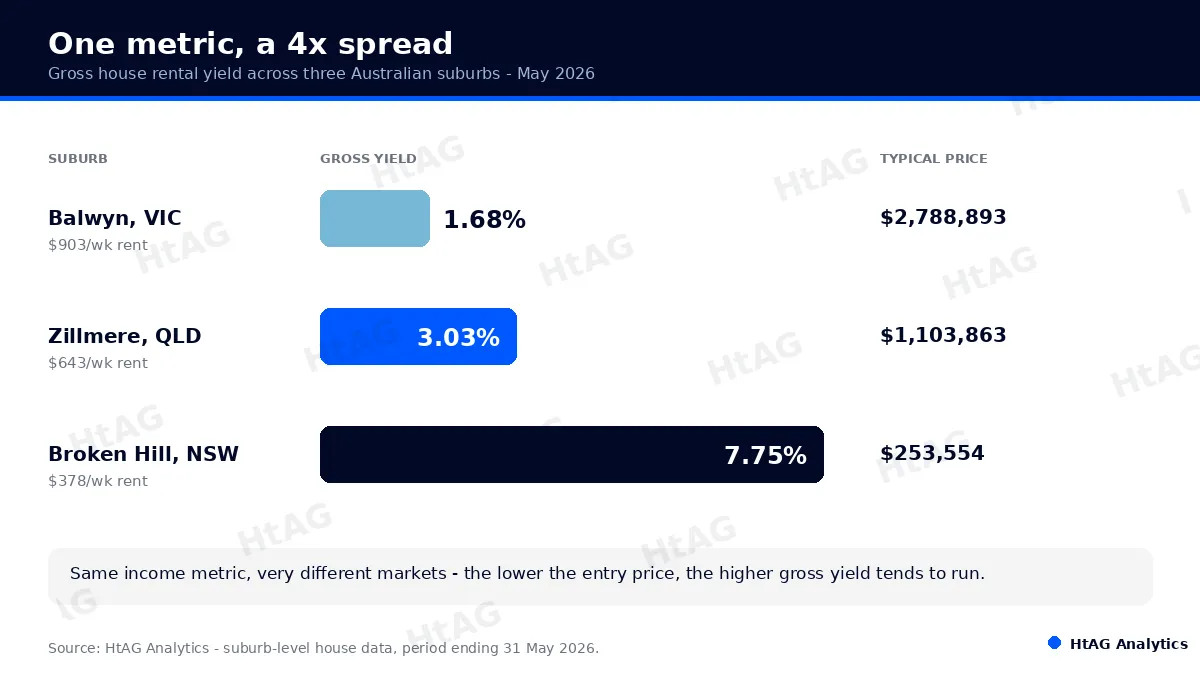
The table below shows how far apart three real Australian markets sit on the same metric, using HtAG Analytics house data to 31 May 2026. The cheapest suburb yields more than four times the dearest one — almost entirely because of price, not because its rents are unusually high.
| Suburb (houses) | Typical price | Median rent | Gross yield | Vacancy |
|---|---|---|---|---|
| Balwyn, VIC | $2,788,893 | $903/wk | 1.68% | 1.62% |
| Zillmere, QLD | $1,103,863 | $643/wk | 3.03% | 0.46% |
| Broken Hill, NSW | $253,554 | $378/wk | 7.75% | 0.81% |
Source: HtAG Analytics — suburb-level house data, period ending 31 May 2026. Gross yield = annual rent ÷ typical price.
Benchmarks also move with interest rates. When the cash rate is high, investors demand more income to cover borrowing costs, so “acceptable” yields drift up; when rates fall, lower yields become tolerable because growth expectations rise. That is why a fixed rule of thumb dates quickly — and why it pays to read yield against the market’s own Growth Rate Cycle rather than a national average.
Gross yield vs net yield
Gross yield ignores costs; net yield includes them. Net rental yield subtracts annual ownership expenses — council and water rates, insurance, property management, repairs, body corporate where relevant — from the rent before dividing by the price. Because those costs can swallow 20% to 35% of gross rent, net yield is always lower, and the gap is not the same in every market.
| Measure | What it includes | Best used for |
|---|---|---|
| Gross rental yield | Rent only, before costs | Fast like-for-like screening across many suburbs |
| Net rental yield | Rent minus running costs | Assessing the true cash return on a specific property |
Source: HtAG Analytics. Net yield excludes loan interest; after-tax return depends on your structure and circumstances.
When net yield matters more: if you are buying for cashflow, comparing two specific listings, or stress-testing whether a property pays for itself, net yield is the honest number — a high-strata apartment can post a strong gross yield and a thin net one.
When gross yield is enough: at the screening stage, when you are ranking hundreds of suburbs and only need a consistent, comparable income signal before you shortlist. Gross yield gets you to a shortlist; net yield gets you to a decision.
Why a high yield is not automatically a good buy
A high yield is not a free lunch — it is usually the market pricing in lower growth, higher risk, or both. The same low price that lifts the yield often reflects a thin economy, an ageing population, or limited buyer demand. That is why chasing the top yield in isolation is one of the most common beginner mistakes: you can win on income and lose far more on capital value.
Yield direction matters too — and it is easy to misread. A falling yield can be a warning (rents collapsing) or a sign of strength (prices rising faster than rents). The two look identical if you only watch the yield number. Broken Hill is a clean example: its gross house yield eased from 8.20% to 7.75% over the year to May 2026, but not because the rental market weakened.
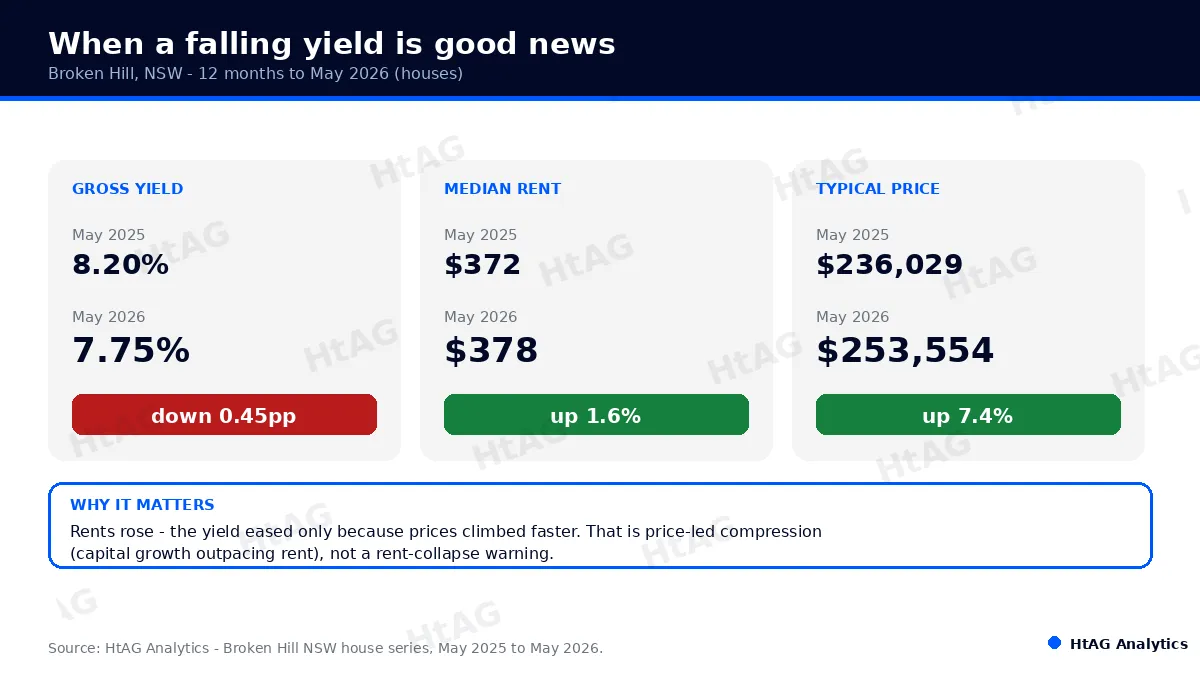
What this means in plain english
In Broken Hill the rent actually went up (about 1.6%). The yield only fell because the price went up faster (about 7.4%). A lower yield here means owners are getting capital growth on top of their rent — the opposite of a problem.
According to HtAG Analytics, the question is never just “is the yield high or low?” but “which way is it moving, and why?” — rent-driven and price-led yield changes point to very different futures.
This is the heart of the income-versus-growth trade-off explored in our companion guide on rental yield vs capital growth. The practical answer is to never let yield travel alone: read it alongside vacancy, the cycle, and demand. For a structured way to find genuinely strong income markets rather than just cheap ones, see how to identify high-yield suburbs and the case for positive cashflow property.
How HtAG measures rental yield
HtAG Analytics tracks gross rental yield as a live monthly series for every Australian market, computed from its own typical price and median rent data rather than asking-price estimates. Yield then feeds the cashflow component of the Relative Composite Score (RCS) — HtAG’s 0–100 measure that blends Capital Growth, Cashflow and Lower Risk into one comparable signal.
That blending is the point. In the May 2026 data, Broken Hill’s 7.75% yield drove a Cashflow score of 98 and an overall RCS of 90 — high income and a balanced composite. Balwyn’s 1.68% yield mapped to a Cashflow score of 39 and an overall RCS of 54, because its strength is stability and prestige, not income. Yield is one ingredient; the score is the meal.
Crucially, HtAG also separates why a yield moves. A yield that compresses because rents are falling is treated very differently from one that compresses because prices are rising faster than rents — the Broken Hill case above. This rent-driven versus price-led distinction is what stops a raw yield number from being read backwards.
Reading yield this way is part of what HtAG means by Property Intelligence: turning raw data into a scored, decision-grade signal a person or an AI agent can act on directly. Because every yield is calculated on a consistent basis, it stays comparable across the regional and metro markets that headline averages blur together, and against the typical price rather than a distortion-prone median.
Research note
Across HtAG’s suburb universe, the markets with the highest gross yields are disproportionately the lowest-priced — income strength and entry price are tightly linked. The durable opportunities are the minority of high-yield suburbs that also carry tightening supply and low vacancy, rather than yield alone.
The conceptual framework behind this metric is published openly for transparency and education. Its proprietary implementation — how HtAG calibrates, validates and folds rental yield into the Relative Composite Score — remains the confidential intellectual property of HtAG Analytics.
Surface this data inside your AI agent
The HtAG Developer Portal exposes the rental yield, rent, price and vacancy data behind this article — and every other HtAG dataset — through MCP (Model Context Protocol) connectors. Investors, buyers agents and mortgage brokers using Claude, Perplexity, Manus AI, ChatGPT via custom connectors, or any other MCP-compatible agent can query HtAG yield data directly inside the tool they already use, across 15,000+ localities and all 537 Australian LGAs.
HtAG’s MCP-enabled Developer Portal — 104+ REST endpoints and 70+ public MCP tools — puts live gross rental yield inside your AI agent. Apply for access and run the full analysis on any Australian suburb without leaving Claude or Perplexity.
HtAG Analytics Developer Portal (2026)
Browse the endpoint catalogue at developer.htagai.com and submit the HtAG Developer Portal application — approved members receive an API key and an MCP setup guide for their preferred AI tool.
Key takeaways
- Gross rental yield = annual rent ÷ price × 100. Annualise weekly rent (×52), divide by price, multiply by 100.
- Gross ignores costs; net includes them. Net yield is always lower — use gross to screen, net to decide.
- “Good” depends on strategy. Below ~3% is growth-oriented, 3–4.5% balanced, above ~4.5% income-oriented — and benchmarks shift with interest rates.
- High yield usually means low growth. HtAG data shows house yields from 1.68% (Balwyn) to 7.75% (Broken Hill) — a 4.6x spread driven by price.
- Read the direction, not just the level. A falling yield can signal rising prices (good) or falling rents (bad) — they look identical on the number alone.
- Never let yield travel alone. Pair it with growth, vacancy and risk — which is exactly what the Relative Composite Score does.
From data signal to portfolio decision
The rental yield, rent, vacancy and Relative Composite Score figures in this article are live inside the HtAG Analytics platform — updated each month as new data flows in. Professional buyers agents use these signals to separate genuinely strong income markets from suburbs that are simply cheap.
If you are building a portfolio and want the exact data behind articles like this one, the HtAG Starter Plan gives you suburb-level analytics across every Australian market — no lock-in, cancel any time. You can also pressure-test any suburb’s track record in the Evidence Portal.
Start your HtAG Analytics membership → · Apply for Developer Portal access →
Frequently asked questions
What is gross rental yield?
Gross rental yield is a property’s annual rent expressed as a percentage of its price, before any costs. It is calculated as annual rent divided by price, multiplied by 100. HtAG Analytics data shows Australian house yields ranging from under 2% in premium suburbs to above 7% in affordable regional markets as at May 2026.
How do you calculate gross rental yield?
Multiply the weekly rent by 52 to get annual rent, divide by the property price, then multiply by 100. For example, $378 a week is $19,656 a year; divided by a $253,554 price and multiplied by 100 gives a 7.75% gross yield — the live HtAG figure for Broken Hill, NSW houses in May 2026.
What is a good gross rental yield in Australia?
It depends on your goal. For houses, below roughly 3% is growth-oriented, 3% to 4.5% is balanced, and above 4.5% is income-oriented. Higher yields usually come with lower capital growth, so a “good” yield is one that matches your strategy and survives a check on vacancy, demand and the market cycle.
What is the difference between gross and net rental yield?
Gross yield uses rent before costs; net yield subtracts ownership expenses such as rates, insurance, management and maintenance before dividing by price. Net yield is always lower and varies by property type — high-strata apartments can show a strong gross yield but a thin net one. Use gross to screen, net to decide.
How do I access HtAG rental yield data inside Claude or Perplexity?
Through the HtAG Developer Portal, which exposes yield, rent, price and vacancy data via MCP connectors. Browse the endpoint catalogue at developer.htagai.com and apply at https://links.htag.com.au/widget/form/GFVegAaXzeTUH7QzRl1T. Approved members receive an API key and an MCP setup guide for Claude, Perplexity, Manus AI or any MCP-compatible agent.
This article forms part of the HtAG Property Intelligence Reference Library — a structured knowledge base documenting the concepts, metrics and methodologies used to analyse Australian residential property markets.
Reference Standard PI-YIELD · Version 1.0
Disclaimer: This article is for educational purposes only and does not constitute financial advice. Property investment carries risks, and past performance is not indicative of future results. All yields, prices and projections are derived from historical data and statistical modelling — they are not guarantees of future performance. Figures referenced are for houses as at 31 May 2026 and will change over time. Always conduct your own due diligence and consult a qualified financial adviser before making investment decisions. External market data is published by the Australian Bureau of Statistics.


