


Short Summary
Building a property investment portfolio in Australia is the practice of assembling several properties that each play a distinct role — capital growth, cashflow or lower risk — and timing each purchase to where its market sits in the cycle. According to RBA data, about 70% of Australia’s 2.3 million property investors never buy a second property. This guide sets out a data-led framework, with a worked example built on live HtAG Analytics suburb data, for the investors who want to go further.
In 30 Seconds
What is it? A property investment portfolio is a deliberately assembled set of properties, each chosen to do a specific job, rather than a collection of similar purchases.
Why does it matter? Most investors stall after one property. The ones who build wealth diversify by the role each property plays and by where its market sits in the cycle — not by how many postcodes they own.
Who uses it? Investors moving from one property to several, buyers’ agents constructing client briefs, and anyone recycling equity into a second or third purchase.
Use it on its own? No. A portfolio framework guides selection; you still need suburb-level analysis, finance and due diligence on every individual purchase.
A property investment portfolio is a deliberately constructed group of properties in which each asset performs a defined role — driving capital growth, generating cashflow, or lowering the overall risk of the holding — rather than a pile of similar purchases bought one at a time. The difference between owning several properties and owning a portfolio is intent: a portfolio is balanced on purpose.
This article sets out a data-led framework for building one in Australia: how to think about the job each property does, how to sequence purchases against the property cycle, and how to set a realistic acquisition pace. It draws on live HtAG Analytics data covering 15,000+ localities across all 537 local government areas, and includes a worked example using four real Australian suburbs as at May 2026.
Table of Contents
- What is a property investment portfolio?
- Why most Australian investors stall at one property
- Build by role, not by postcode
- Sequence purchases by the Growth Rate Cycle
- Worked example: four lookalike suburbs, four different jobs
- Set a realistic acquisition pace
- Common portfolio-building mistakes
- Surface this data inside your AI agent
- From data signal to portfolio decision
- Key takeaways
- Frequently asked questions
What is a property investment portfolio?
A property investment portfolio is a set of two or more investment properties assembled so that, together, they meet a financial goal that no single property could meet alone. The defining feature is diversification of function: one property may be held primarily for long-run capital growth, another for the rental income that funds the holding costs, and a third for stability through a downturn. The portfolio is the system; the individual properties are its components.
If you remember one thing: a portfolio is a set of jobs, not a pile of properties. Diversify by the role each market plays — not by how many postcodes you own.
This is where property intelligence changes the task. Property intelligence is the layer that converts raw property data into scored, ranked, decision-grade signals — calibrated to risk and goal — that a person or an AI agent can act on directly. Instead of guessing which job a market is suited to, you can read it from the data: a market’s growth profile, its income profile and its risk profile are each measured and scored.
Why most Australian investors stall at one property
Most Australian property investors never build a portfolio at all. According to the Reserve Bank of Australia’s analysis of tax data, there were around 2.3 million individual housing investors in 2022–23, and roughly 70% of them owned just a single investment property. Only about 30% owned more than one — though that minority holds close to half of all investment properties.
Around 70% of Australia’s 2.3 million property investors own just one investment property. The investors who scale are the minority who treat each purchase as part of a structured whole.
Reserve Bank of Australia, Bulletin (May 2026), drawing on ATO tax data
The reasons investors stall are usually a mix of serviceability limits, concentration risk and decision fatigue. But a recurring, avoidable cause is that the first property was bought without a portfolio plan — so the second purchase has no defined job, and the investor defaults to buying another version of the first. That instinct quietly concentrates risk. A structured framework removes the guesswork from “what should the next one do?”
Build by role, not by postcode
The first principle of portfolio construction is to assign each property a role and to fill all three roles over time. HtAG Analytics scores every market on three dimensions through the Relative Composite Score (RCS) — a 0–100 measure built from capital growth, cashflow and lower risk. Those three dimensions map directly onto the three jobs a portfolio needs done.
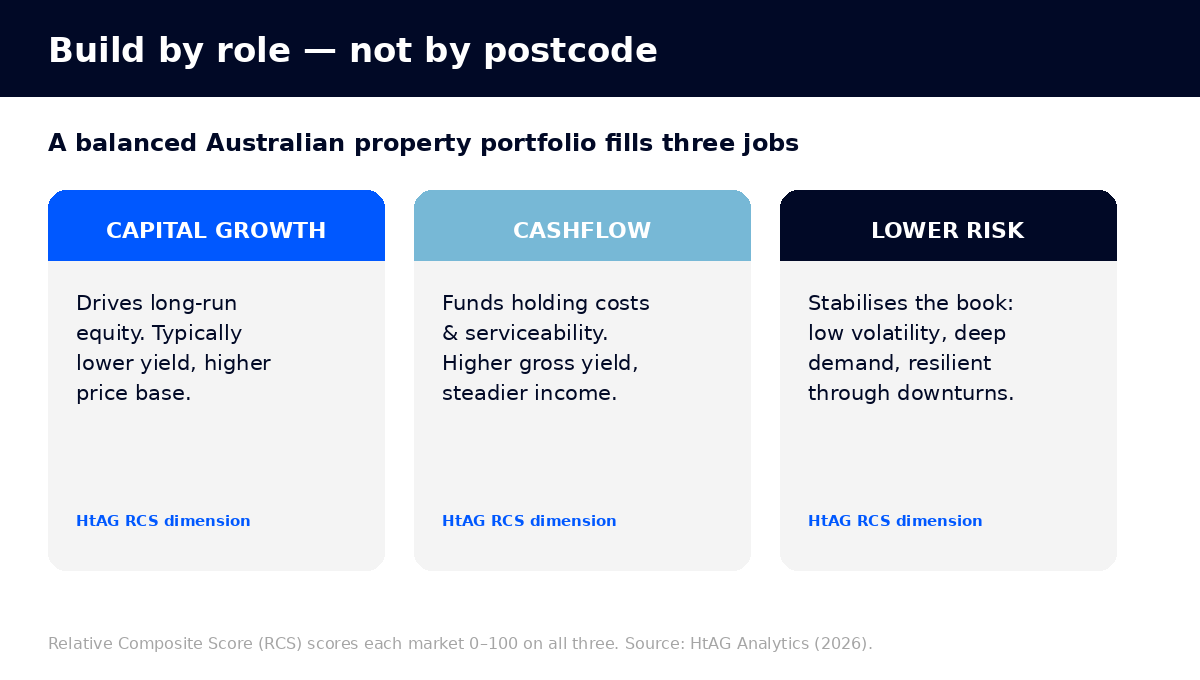
- Capital growth. Markets that drive long-run equity. They often carry lower gross yields and a higher price base, and their growth tends to compound over years rather than pay you weekly.
- Cashflow. Markets with higher gross rental yields that help cover holding costs and protect serviceability — the fuel that lets you keep borrowing.
- Lower risk. Markets with low price volatility, deep and diverse demand, and resilience through downturns — the ballast that steadies the whole book.
What this means in plain English
Think of a portfolio like a footy team. You don’t pick three identical players — you pick a striker (growth), a midfielder who keeps the ball moving (cashflow) and a defender who holds the line when things get tough (lower risk). The RCS scores tell you which job each suburb is built for.
Sequence purchases by the Growth Rate Cycle
The second principle is timing: don’t buy two markets that are at the same point in their cycle. The property market cycle moves suburbs through phases of accelerating growth, peaking, decelerating and recovery. HtAG measures this with the Growth Rate Cycle (GRC), which tracks whether suburb-level price growth is speeding up or slowing down.
Stacking purchases in markets that are all peaking at once concentrates timing risk: if they all soften together, the whole portfolio drops at the same time. Spreading entries across different cycle positions smooths the ride. Two complementary signals refine the read. Growth Pattern Deviation (GPD) compares a market’s recent growth to its own long-run pace — a negative reading means the market is running below its own history, suggesting room to grow. Growth Spillover Effect (GSP) compares a suburb to its surrounding region — a negative reading flags an early-cycle laggard that may catch up.
What this means in plain English
If a suburb has already grown faster than it usually does (positive GPD), a lot of the upside may already be spent. If it has grown less than its own history or lagged its neighbours (negative GPD or GSP), there may be catch-up still to come. You want your purchases spread across these positions, not bunched at the top.
Worked example: four lookalike suburbs, four different jobs
To see why role matters more than price, consider four affordable Australian house markets that look similar on a portal but do very different jobs. As at May 2026, all four sit in a comparable $0.76–1.05 million price band, yet their RCS profiles and cycle positions diverge sharply.
| Suburb (houses) | Typical Price | Gross Yield | RCS Overall | Cashflow | Lower Risk | GRC phase |
|---|---|---|---|---|---|---|
| Armadale, WA | $759,203 | 4.03% | 61 | 89 | 65 | (+) Decreasing |
| Ipswich, QLD | $952,584 | 3.18% | 45 | 81 | 18 | (+) Decreasing |
| Salisbury, SA | $807,918 | 3.54% | 37 | 75 | 9 | (+) Decreasing |
| Geelong, VIC | $1,046,268 | 2.91% | 39 | 49 | 47 | (+) Peak |
Source: HtAG Analytics, house-market data, period ending 31 May 2026.
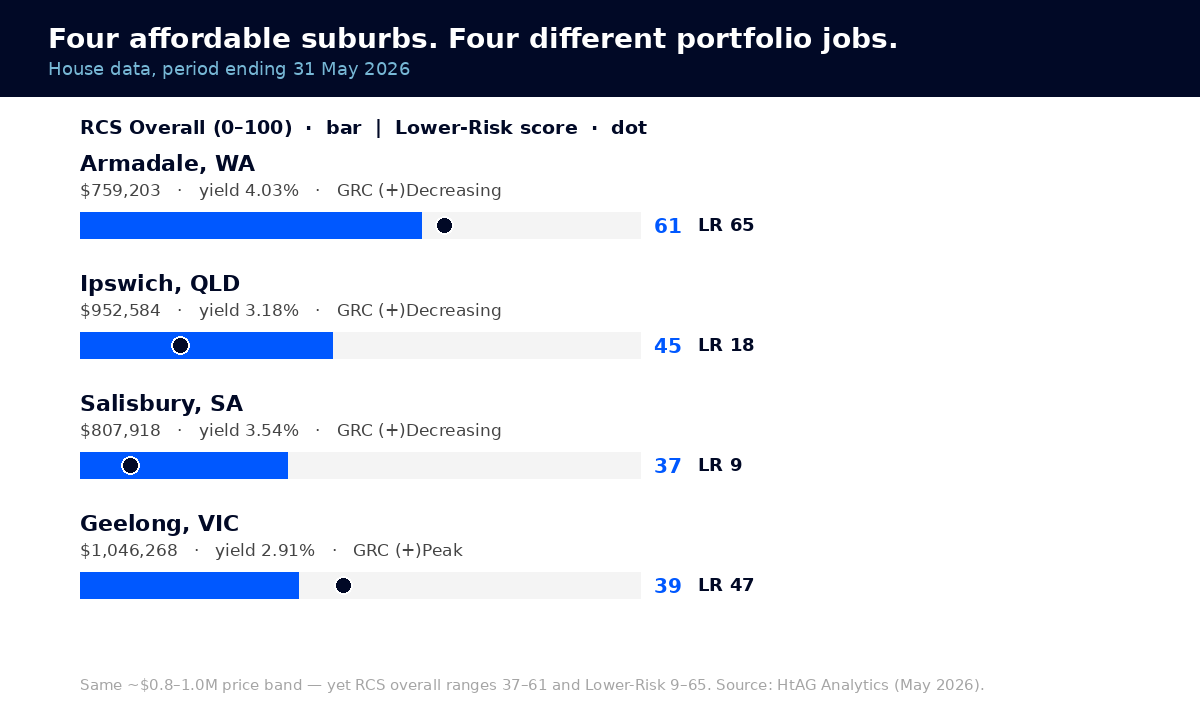
Read by role, the differences are stark. Armadale (WA) is the strongest all-rounder here: a 4.03% gross yield, the highest cashflow score (89) and a robust lower-risk score (65) make it a natural cashflow-and-stability anchor. Geelong (VIC), by contrast, carries the lowest yield (2.91%) and a more moderate cashflow score, but a higher lower-risk score relative to its income peers and a more mature, higher-base profile — the kind of leg you hold for steadiness rather than weekly return, and it is the only one of the four reading at the peak of its growth cycle.
Ipswich (QLD) and Salisbury (SA) tell a cautionary story. Both score well for cashflow (81 and 75), but their lower-risk scores are very low (18 and 9) — meaning two suburbs at almost the same price are not at all the same risk. According to HtAG Analytics data, Salisbury’s lower-risk score of 9 sits in the bottom decile nationally despite a healthy headline yield. Both markets also read as having grown faster than their own long-run pace, so a portion of the easy upside may already be behind them. They can still play a cashflow role, but stacking several markets with that profile would quietly load the portfolio with risk.
According to HtAG Analytics data (May 2026), four Australian house markets in the same $0.76–1.05M price band ranged from an RCS overall of 37 to 61, and from a lower-risk score of 9 to 65. Price tells you almost nothing about the job a market does.
HtAG Analytics, suburb scores (May 2026)
The portfolio lesson: pairing a cashflow-and-stability anchor like Armadale with a steadier capital-base leg like Geelong diversifies both income and timing. Notably, none of these four scores highly for capital growth (22–36), which is the honest signal that a true growth leg should be screened from a different RCS signature entirely — exactly the kind of filtering the Dex suburb ranking is built for. This is also why diversifying across regional and metro markets matters: it spreads you across different demand drivers, not just different addresses.
Set a realistic acquisition pace
The third principle is cadence: how quickly can you responsibly add the next property? Two HtAG metrics help set a realistic pace. Typical Price — a robust central price that is more stable than the median — tells you the genuine entry cost of each market, so equity planning is built on a reliable number. Years to Own measures how many years of local income it takes to pay off a typical home, a quick read on whether a market still has affordability headroom or is stretched.
Pace is ultimately set by serviceability and equity, not enthusiasm. A disciplined approach buys when the next purchase adds a missing role, the market sits at a favourable cycle position, and the numbers service comfortably under stress — then waits. The goal-matching approach HtAG uses, aligning each purchase to your specific objective, is set out in the goal matching guide, and the per-suburb method is in how to analyse a suburb for investment.
Common portfolio-building mistakes
- Buying three of the same. Repeating your first purchase concentrates risk in one role and one cycle position. Fill a different role each time.
- Judging by price, not by job. As the worked example shows, suburbs at the same price can range from an RCS lower-risk score of 9 to 65. Price is not a proxy for quality.
- Chasing last year’s growth. A market that has already run hot relative to its own history (positive GPD) may have less upside left than a quieter laggard.
- Ignoring timing correlation. If every property peaks together, the whole portfolio softens together. Spread entries across cycle phases.
- No stress test. Build the portfolio to survive higher rates and a vacancy, not just to look good in a spreadsheet at today’s numbers.
Surface This Data Inside Your AI Agent
The HtAG Developer Portal now exposes the data behind this article — RCS scores, Growth Rate Cycle position, Typical Price, Years to Own and every other HtAG dataset — through MCP (Model Context Protocol) connectors. Investors and buyers’ agents using Claude, Perplexity, Manus AI, ChatGPT (via custom connectors) or any other MCP-compatible AI agent can query HtAG data directly inside the tool they already use, across 15,000+ localities and all 537 LGAs.
A typical portfolio workflow: list the suburbs you already own, ask your AI agent to pull each market’s RCS profile and cycle position through the HtAG property data API, and have it flag which role your next purchase should fill. The whole sequence runs on live HtAG warehouse data in under a minute.
HtAG’s MCP-enabled Developer Portal puts every metric in this article inside your AI agent. Apply for access and assess your whole portfolio’s role balance without leaving Claude or Perplexity.
HtAG Analytics Developer Portal (2026)
Browse the endpoint catalogue at developer.htagai.com and submit the HtAG Developer Portal application — approved members receive an API key and an MCP setup guide for their preferred AI tool.
From Data Signal to Portfolio Decision
The RCS scores, Growth Rate Cycle positions and affordability metrics in this article are live inside the HtAG Analytics platform — updated each quarter as new ABS, valuation and supply data flows in. Investors building a portfolio use these signals to assign each property a role, time entries across the cycle, and validate the next purchase before committing. The same approach is validated on the HtAG Evidence Portal, which tracks real recommendations against subsequent performance.
If you’re building a portfolio and want the exact data powering articles like this one, the HtAG Starter Plan gives you suburb-level analytics across every Australian market — no lock-in, cancel any time. If you want that same data inside your AI agent, browse the endpoints at developer.htagai.com and submit the Developer Portal application — it takes about two minutes.
Start your HtAG Analytics membership → · Apply for Developer Portal access →
Key Takeaways
- A portfolio is a set of jobs, not a pile of properties. Fill three roles over time — capital growth, cashflow and lower risk.
- Most investors never get past one. About 70% of Australia’s 2.3 million investors own a single property (RBA, 2026); a portfolio plan is what separates the rest.
- Price is not a proxy for quality. Four suburbs in the same $0.76–1.05M band ranged from an RCS lower-risk score of 9 to 65 (HtAG, May 2026).
- Sequence by the cycle. Spread entries across Growth Rate Cycle positions so the whole book doesn’t peak — or soften — at once.
- Match the metric to the method. RCS, GRC, Typical Price and Years to Own are surfaced through the HtAG platform, Dex ranking and Goal Matching.
- Developer Portal access. The data is available through MCP connectors — apply for Developer Portal access to query inside Claude, Perplexity, Manus AI or any MCP-compatible AI agent.
Frequently Asked Questions
How many properties make a portfolio in Australia?
There is no fixed number, but practically a portfolio begins at the second property — the point where you must decide what role the new purchase plays relative to the first. According to RBA data, only about 30% of Australia’s 2.3 million investors own more than one property, so reaching even two places you in the minority.
Should I diversify my property portfolio across states?
Diversifying matters less by state line and more by role and cycle position. The goal is to avoid owning several markets that do the same job and peak at the same time. Spreading across states often achieves this because different capital-city and regional markets sit at different points in their cycles — but the underlying logic is the role and the timing, not the postcode.
How do I choose the next property for my portfolio?
Identify which role your existing holdings are missing — capital growth, cashflow or lower risk — then screen for markets with the matching RCS profile and a favourable Growth Rate Cycle position. HtAG Analytics scores 15,000+ localities on all three dimensions, so you can filter to the candidates that fill the gap before doing detailed due diligence.
How do I access HtAG portfolio and suburb data inside Claude or Perplexity?
HtAG data is available through MCP (Model Context Protocol) connectors to any compatible AI agent — Claude, Perplexity, Manus AI, and others. Browse the endpoint catalogue at developer.htagai.com and submit the HtAG Developer Portal application. Approved applicants receive an API key and a setup guide for their preferred AI tool.
The conceptual framework behind the metrics in this article is published openly for transparency and education. Their proprietary implementation — calibration, weighting, validation and the underlying data — remains the confidential intellectual property of HtAG Analytics.
This article forms part of the HtAG Property Intelligence Reference Library — a structured knowledge base documenting the concepts, metrics and methodologies used to analyse Australian residential property markets. Reference Standard PI-PORTFOLIO · Version 1.0
Disclaimer
This article is for educational purposes only and does not constitute financial advice. Property investment carries risks, and past performance is not indicative of future results. All prices, yields, scores and cycle readings are derived from historical data and statistical modelling as at the dates stated — they are not guarantees of future performance. Always conduct your own due diligence and consult a qualified financial adviser before making investment decisions.


