
Find the
Warmspots™
Invest in suburbs before they become Hotspots.
Use HtAG and become your own Buyer’s Agent.
15% ROI
There’s nothing average
about the returns.
ROI amongst HtAG users vs.
the 5% average return in Australia*
37%
Increased chance of getting your offer approved due to lower buyer saturation
56 Hours
Time saved doing research in one platform rather than piecing it together from various sources.
4.6/5 on Trustpilot
Once it’s a hotspot, it’s already too late.
Smart investors don’t invest in areas where most of the growth has already happened.
They seek out areas that are primed to grow, but aren’t crowded (yet).
But how do you find those areas?
Using HtAG, you can find the Warmspots™ that are set to boom, reaping above average cashflow and growth.
Don’t rely on hype, outperform it instead.
Tools to outperform
the hotspots
Use over 1 billion data points to invest without the hype

Proptech SaaS for Investors

Streamline Your Suburb Search
Save Time with Market Research

Become a Data-Driven Research Pro

Detailed PDF Suburb Reports

Engage and Shine with Comments

Market Insights Reports
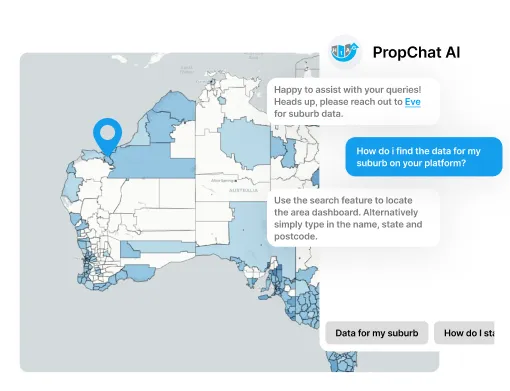
Always Supported by AI & Team

Guided by AI Assistant

Other Awesome Features
Data Talks.
We Translate.
Harness Proptech to your Advantage
HtAG Analytics revolutionises decision-making for buyers agents by offering a comprehensive Software as a Service, designed to streamline market selection for property investor clients.
Keep Reading
Centred around our innovative Relative Composite Score (RCS) predictive model, the platform automates market research and enables investors to effortlessly harness, tailor and analyse markets based on their defined strategies.
Our platform not only simplifies the discovery of optimal investment opportunities through pinpoint market matching but also enriches subscribers with the knowledge to become data-driven market experts.
With features like personalised report generation and a vibrant community for support &engagement, HtAG Analytics goes beyond data provision to foster a supportive ecosystem.
Read Less


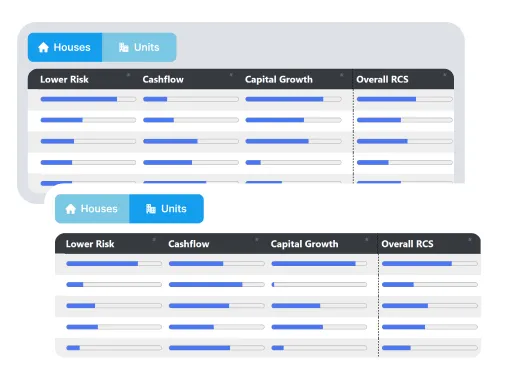
Create Client Briefs
with Ease
Imagine transforming the cumbersome task of matching client briefs to suitable markets into a seamless action.
With HtAG Analytics, the grind is gone.
Keep Reading
Our platform eliminates the hassle, offering prebuilt strategy filters for Cashflow, Capital Growth, or a Balanced approach.
This addition allows you to quickly identify markets that align with your investment goals, fostering a tailored experience that fits your unique demands.
Your peers will marvel at your efficiency, and you’ll wonder how you ever managed without it.
Read Less
Unlock the full power of
HtAG today
Elevate your investment strategies with targeted data-driven insights designed to help you exceed the average.
Most Popular
Professional
Best for: Buyers Agents & Brokers

Investor
Best for: Property Investors Ready to Buy

Most Popular
Professional
Best for: Buyers Agents & Brokers
Investor
Best for: Property Investors Ready to Buy
Harness the power of comprehensive property data and real estate insights from HtAG Analytics, developed for Australian property professionals and investors. Our proprietary algorithm covers more than 5,000 local markets, integrating property transaction data into advanced machine learning models to provide detailed property insights, historical price trends, and long-term market outlooks — all tailored to your or your clients’ investment strategies. With up to 150 key metrics, you can effortlessly compare and rank thousands of suburbs using the latest national property data. Our innovative tools — including HtAG AI Copilot, Zapiio Portfolio Modelling, the RCS™ ranking system, Dex™ methodology, GeoDex™ suburb heatmaps, and StreetLens™ street-level heatmaps — deliver comprehensive property insights and local market data online. These solutions empower you to define and refine your investment portfolio goals, match suburbs to your property brief, assess market risk using rich property data, project indicative returns, perform visual comparative market analysis (CMA) and much more. All of this is backed by dedicated support and thousands of hours of educational content & coaching in our mastermind community — so you’re never left on your own and always have access to the guidance and property insights you need to succeed.
Compare Plans
Starter
Investor
Pro
01 – Quick Stats – Essential Metrics:
Typical Price
Median Rent
Indicative Yield
02 – Quick Stats – Supply:
Stock on Market
Inventory
Building Approvals
Hold Periods
03 – Quick Stats – Demand:
Days on Market
Vacancy Rates
Search Index
Clearance Rates
04 – Quick Stats – RCS™ Predictive Model:
Lower Risk RCS™
Capital Growth RCS™
Cashflow RCS™
05 – Heatmaps – Metrics:
1 Y Price Change
Gross Yield
All RCS™ Metrics
06 – State/City Heatmaps – Layers:
LGA Layer
Suburb Layer
01 – Tabular Data – Dex Suburb Ranking & Filters:
Strategy presets
Export in Excel format
100 rows per mo
300 rows per mo
Filters per day
Adjust metric weights
02 – Tabular Data – Essentials:
Sales & Typical Price
1M, 1Q, 1Y Price Change
Rentals & Median Rent
1M, 1Q, 1Y Rent Change
Indicative Yield
3Y, 5Y, 10Y Price Change
3Y, 5Y, 10Y Rent Change
03 – Tabular Data – Forecast:
Capital Growth – Low
Capital Growth – High
ROI – Low
ROI – High
Projected Rent Increase
Volatility Index
04 – Tabular Data – Fundamentals:
IRSAD
Renter to Owner Ratio
Units to Houses Ratio
Growth Rate Cycle
Affordability Index
05 – Tabular Data – Supply:
Stock on Market
Inventory
Building Approvals
Hold Periods
06 – Tabular Data – Demand:
Days on Market
Vacancy Rates
Search Index
Clearance Rates
07 – Tabular Data – RCS™ Predictive Model:
Lower Risk RCS™
Capital Growth RCS™
Cashflow RCS™
Overall RCS™
08 – Tabular Data – Other:
Population
Annual Sales
Confidence
Dwellings
School Rank
Infrastructure Investment
01 – Quick Stats – Essential Metrics:
Typical Price
Median Rent
Indicative Yield
Growth Rate Cycle
02 – Charts – Fundamentals:
IRSAD
Renter to Owner Ratio
Units to Houses Ratio
Demand Profile
Affordability Index
03 – Charts – Supply:
Stock on Market
Inventory
Building Approvals
Hold Periods
04 – Charts – Demand:
Days on Market
Vacancy Rates
Search Index
Clearance Rates
01 – AI Initiatives:
Ana: Support Guide GPT
HTAG Copilot
50 credits per mo
100 credits per mo
150 credits per mo
02 – Portfolio Modelling:
Track Your Portfolio
Model Your Portfolio
Model Your Clients’ Portfolios
03 – Collaboration & Coaching:
Referral Hub
Pre-qualify for BA Directory
Mastermind Community
L1, L26M
L1, L3,L4
04 – Store Discounts:
Suburb PDF Reports
30%
100%WL
Whitepapers
30%
100%
Socio-Economic Toolkit
6M Level 2 Mastermind is available with the Investor 6-Month Subscription (not included in the 1-Month Plan).
WL White-labelled PDFs include your company logo.
01 – General:
Users
Region
Price
02 – Data:
CoreLogic Market Listings
Domain Market Listings
Flood & Bushfire Maps
Zoning Overlays
03 – Additional Documents:
Branded Due Diligence PDF
Title Search
Contamination Report
For a comprehensive overview of what the Archistar Addon brings to your research toolkit, including its standout feature of offering nationwide access to detailed property data, feel free to explore further details here. This addon is designed to enhance your property investment strategies by providing in-depth property information right when needed.
PO Box 37 Jannali, NSW 2226
9AM-5PM Mon-Fri
+61 (0)2 8055 3772

Data Beats Hype