


Short Summary
HtAG Analytics compared all 5,280 suburb-level house markets in Australia as of May 2026. Regional suburbs enter 37% cheaper ($800,636 vs $1,268,961 median typical price), yield more (3.15% vs 2.79%) and have grown further over 10 years (119.6% vs 93.2%) — but metro markets sell 21 days faster and carry deeper exit liquidity. The right answer depends on your strategy, and on which state you are buying in.
Regional vs metro property investment in Australia is, in 2026, a choice between two measurably different risk profiles — not a debate about which is “better”. According to HtAG Analytics data covering 5,280 suburb-level house markets in May 2026, the median regional suburb offers a 37% lower entry price, a 0.36 percentage point higher gross yield and stronger 5- and 10-year cumulative growth, while the median metro suburb sells 21 days faster and sits in a deeper, more liquid market.
In a nutshell: regional Australia currently wins on entry price, yield and long-run growth, and metro Australia wins on liquidity, market depth and downside resilience. The split is also not uniform — regional Victoria and regional NSW have outperformed their capitals over five years, while Greater Brisbane and Greater Perth have beaten their regional counterparts. This article walks through the numbers behind each claim.
The analysis below uses suburb-level medians rather than city-wide averages, because aggregated city figures hide the spread that investors actually buy into — the same reason LGA-level averages hide the best investment suburbs. All price figures use HtAG’s typical price rather than raw medians; if you are not familiar with the difference, see why typical price is a more reliable metric than median price.
Table of Contents
Regional vs Metro: The 2026 Numbers
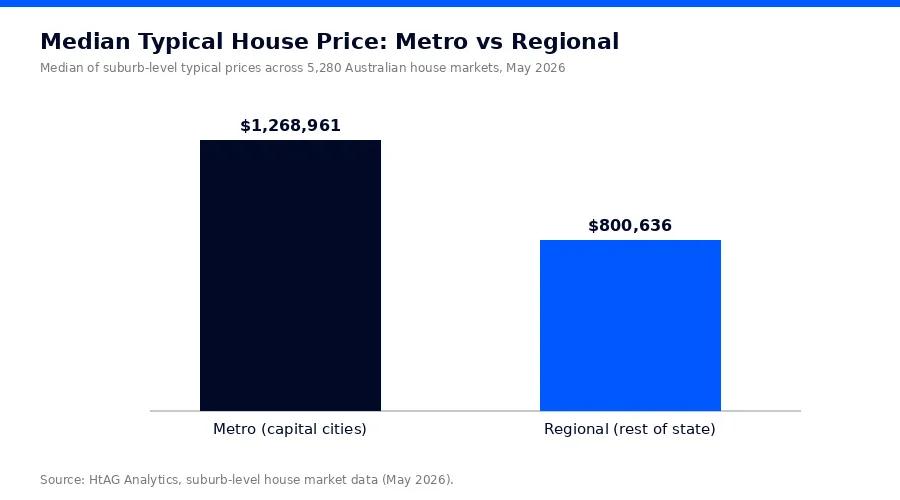
As of May 2026, the median metro house suburb in Australia has a typical price of $1,268,961 against $800,636 in regional areas — a 37% discount for buying outside the capitals. HtAG Analytics classifies each of the 5,280 suburb-level house markets it tracks against the ABS Greater Capital City boundary: 2,589 suburbs fall inside a capital city footprint and 2,691 sit in the “rest of state” regions.
The headline comparison across every core metric is below. Each figure is the median of suburb-level values for houses (all bedroom counts), so it represents the middle market an investor would actually encounter in each zone — not a population-weighted city average.
| Metric (median suburb, houses) | Metro | Regional |
|---|---|---|
| Typical price | $1,268,961 | $800,636 |
| Gross rental yield | 2.79% | 3.15% |
| 12-month price growth | 9.8% | 10.7% |
| 5-year cumulative growth | 47.1% | 53.6% |
| 10-year cumulative growth | 93.2% | 119.6% |
| Vacancy rate | 1.27% | 1.46% |
| Days on market | 32 | 53 |
| Inventory (months of supply) | 2.3 | 3.0 |
| Years to Own (affordability) | 57.3 | 45.7 |
Source: HtAG Analytics, suburb-level house market data across 5,280 markets (May 2026).
What This Means in Plain English
“Years to Own” measures how many years of the local median household income it takes to pay off the typical house. At 45.7 years, the median regional suburb is still expensive by historical standards — but a metro buyer needs nearly 12 more years of income for the same outcome, which is why investor capital keeps migrating outwards.
Where Regional Markets Win
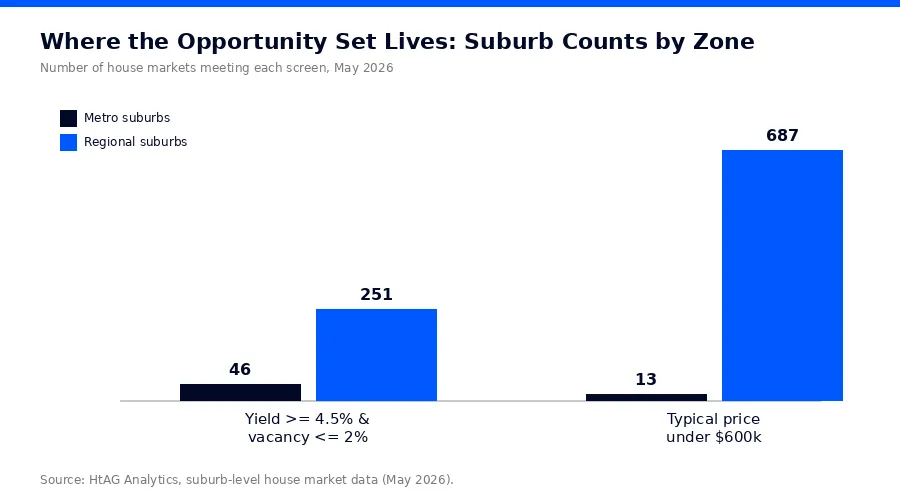
Regional markets win on three measurable dimensions in 2026: entry price, gross yield and the size of the investable opportunity set. According to HtAG Analytics data, 687 regional house markets still have a typical price under $600,000 — against just 13 metro suburbs nationwide. For investors constrained by borrowing capacity, the practical universe of buyable markets is now overwhelmingly regional.
The cashflow story is similar. Screening for suburbs that combine a gross yield of at least 4.5% with a vacancy rate at or below 2% — a basic positive-cashflow filter — returns 251 regional suburbs but only 46 metro suburbs. That is a 5.5-to-1 advantage, and it is the reason every entry in our Top 10 high-yield suburbs for Q1 2026 sits outside a capital city.
According to HtAG Analytics data, 251 regional Australian suburbs combine a gross yield of 4.5% or higher with a vacancy rate of 2% or lower in May 2026 — compared with just 46 suburbs across all eight capital cities.
HtAG Analytics, suburb-level house market data (May 2026)
Long-Run Growth Has Favoured Regional Markets
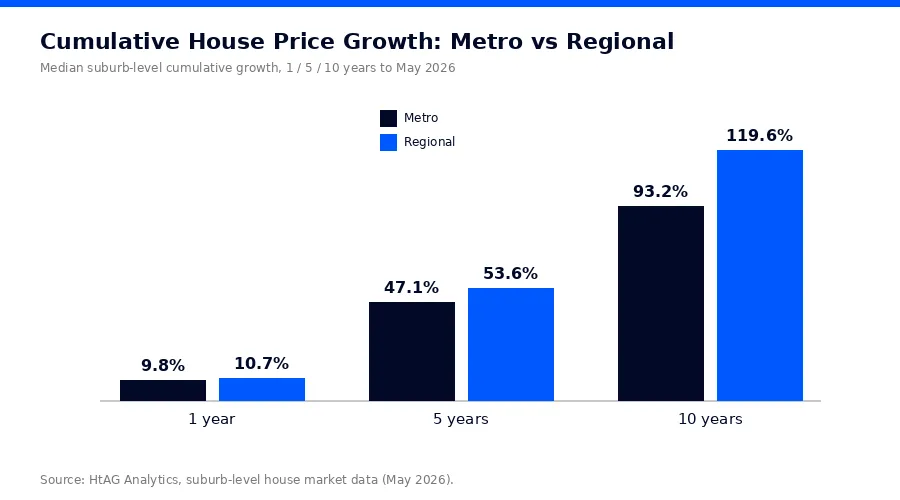
Over the decade to May 2026, the median regional house suburb grew 119.6% cumulatively against 93.2% for the median metro suburb — a 26 percentage point gap. The 5-year window tells the same story (53.6% vs 47.1%), driven by the post-2020 migration shift, the work-from-home re-pricing of lifestyle regions and a structural undersupply of new regional dwellings.
Importantly, this is not just a COVID artefact that is now unwinding. The median regional suburb also grew faster over the 12 months to May 2026 (10.7% vs 9.8%), meaning the relative momentum persists into the current cycle. Our Australian Property Forecast 2026 projects the affordability-driven rotation out of the most expensive capitals to continue while the cash rate environment keeps borrowing capacities compressed.
Where Metro Markets Win
Metro markets win on liquidity, market depth and economic diversification — the factors that determine how safely you can exit. The median metro house suburb sells in 32 days against 53 days regionally, and carries 2.3 months of inventory against 3.0 months. When you need to sell into a soft market, that 21-day liquidity gap widens sharply, because thin regional markets lose buyers faster than deep metro ones.
Depth also matters for valuation confidence. Metro suburbs transact more frequently, which means more comparable sales, tighter valuation bands and less risk of a lender’s valuer cutting your refinance. Regional markets — particularly those with fewer than 30 sales a year — can swing on a handful of transactions, and a single dominant employer can reshape demand overnight. HtAG Analytics flags this through economic diversification and market-size metrics tracked for every suburb, and the validated outcomes published on the HtAG Evidence Portal show why both screens matter before purchase.
Vacancy is the third metro advantage, if a modest one: 1.27% against 1.46% at the median. Both zones sit well inside the tight band (under 3.5% is balanced-to-tight on HtAG’s scale), so tenant demand is not currently a differentiator — but metro vacancy has historically been more stable through downturns.
What This Means in Plain English
Buying regional usually means better rent for your dollar and more growth in the recent past — but when it is time to sell, expect the sale to take three weeks longer, and to have fewer recent sales supporting your asking price. If a quick, predictable exit matters to your plan, that is what the metro premium buys you.
The State-by-State Split
The regional advantage is not uniform: regional suburbs out-grew their capitals over five years in NSW, Victoria, South Australia and Tasmania, but metro suburbs won in Queensland and Western Australia. Any blanket claim that “regional always outperforms” fails in exactly the two states that led national growth — Greater Perth’s median suburb grew 102.8% in five years and Greater Brisbane’s 88.0%, both ahead of their regional counterparts.
| State | Metro 5Y growth | Regional 5Y growth | Metro yield | Regional yield |
|---|---|---|---|---|
| NSW | 31.3% | 41.7% | 2.46% | 3.19% |
| VIC | 13.4% | 34.4% | 2.94% | 2.94% |
| QLD | 88.0% | 85.2% | 2.68% | 3.19% |
| SA | 77.7% | 80.5% | 2.90% | 3.01% |
| WA | 102.8% | 96.5% | 3.25% | 3.06% |
| TAS | 24.2% | 44.7% | 3.38% | 3.18% |
Source: HtAG Analytics, median suburb-level house values per state and zone (May 2026). Metro = ABS Greater Capital City area; Regional = rest of state.
Two patterns stand out. First, the regional premium is largest where the capital is most expensive or weakest — regional Victoria’s median suburb grew 34.4% in five years against Greater Melbourne’s 13.4%, a 21 percentage point gap that reflects Melbourne’s extended flat cycle. Second, in resource-led states the capitals themselves behaved like growth markets, so the metro/regional distinction mattered far less than the state you picked.
HtAG Analytics’ state-level analysis shows regional Victoria’s median house suburb grew 34.4% in the five years to May 2026 — more than two and a half times Greater Melbourne’s 13.4% over the same period.
HtAG Analytics, suburb-level house market data (May 2026)
How to Choose Between Regional and Metro
To choose between regional and metro, match the zone to your strategy first, then screen individual suburbs — never the other way around. The decision sequence professional buyers agents use looks like this:
- Define the brief — cashflow, capital growth or balanced. A 4.5%+ yield brief under $600,000 is, statistically, a regional brief in 2026 (251 regional candidates vs 46 metro). A long-hold, low-volatility brief tolerates metro pricing.
- Set a liquidity floor — exclude suburbs with thin sales volumes regardless of zone. This single screen removes most of the genuine regional risk (one-industry towns, micro-markets that swing on five sales).
- Check the cycle position — use the Growth Rate Cycle (GRC) to confirm the suburb is in recovery or expansion rather than at a peak. Regional markets that have already doubled are exactly where late money gets trapped.
- Compare visually — the GeoDex heatmap renders growth, yield and risk scores across every LGA and suburb, which makes the metro/regional gradient within each state immediately visible.
- Validate demand and supply — vacancy under 2%, falling stock on market and a rising search index confirm the tenant and buyer depth that suburb-level medians alone cannot. Our suburb growth forecasts for 2026 show how these inputs combine into forward projections.
The common failure mode in both zones is the same: buying the average. Within regional Australia, the gap between the best and worst suburb is far wider than the gap between the regional and metro medians — which is why suburb-level (and increasingly sub-suburb) selection drives more of the outcome than the zone decision itself.
Surface This Data Inside Your AI Agent
The HtAG Developer Portal now exposes the data described in this article — and every other HtAG dataset — through MCP (Model Context Protocol) connectors. Investors and buyers’ agents using Claude, Perplexity, Manus AI, ChatGPT (via custom connectors) or any other MCP-compatible AI agent can query HtAG data directly inside the AI tool they already use.
A typical workflow: ask your AI agent to compare any shortlist of regional and metro suburbs, the agent calls the HtAG market endpoints through MCP, returns yields, growth rates, vacancy and cycle position, and drafts the comparison. The whole sequence takes under 30 seconds and runs on live HtAG warehouse data.
HtAG’s MCP-enabled Developer Portal puts every metric in this article inside your AI agent. Apply for access and run the full regional vs metro analysis on any Australian suburb without leaving Claude or Perplexity.
HtAG Analytics Developer Portal (2026)
Browse the endpoint catalogue at developer.htagai.com and submit the HtAG Developer Portal application — approved members receive an API key and an MCP setup guide for their preferred AI tool.
From Data Signal to Portfolio Decision
The typical prices, yields, growth rates, vacancy and Years to Own figures in this article are live inside the HtAG Analytics platform — updated as new valuation and supply data flows in. Professional buyers agents use these signals to decide when a regional yield premium is genuine value and when it is compensation for risk they should not take.
If you’re building a portfolio and want to see the exact data powering articles like this one, the HtAG Starter Plan gives you access to suburb-level analytics across every Australian market — no lock-in, cancel any time. If you want that same data inside your AI agent, browse the endpoints at developer.htagai.com and submit the Developer Portal application — it takes about two minutes.
Start your HtAG Analytics membership → · Apply for Developer Portal access →
Key Takeaways
- Regional is 37% cheaper at the median. The median regional house suburb costs $800,636 against $1,268,961 in the capitals, with a gross yield of 3.15% vs 2.79% (HtAG Analytics, May 2026).
- Long-run growth has favoured regional. Median 10-year cumulative growth is 119.6% regionally against 93.2% in metro — and the 12-month figures (10.7% vs 9.8%) show the momentum persisting.
- Metro buys liquidity. Median days on market is 32 in the capitals vs 53 regionally, with 2.3 vs 3.0 months of inventory — the premium is effectively an exit-insurance policy.
- The split is state-dependent. Regional out-grew metro over five years in NSW, VIC, SA and TAS, but Greater Brisbane (88.0%) and Greater Perth (102.8%) beat their regions — zone rules of thumb fail without state context.
- The affordable, high-yield universe is regional. 687 regional house markets sit under $600,000 and 251 combine 4.5%+ yields with sub-2% vacancy, versus 13 and 46 metro suburbs respectively.
- Developer Portal access. All of this data is now available through MCP connectors — apply for HtAG Developer Portal access to query it inside Claude, Perplexity, Manus AI or any MCP-compatible AI agent.
Frequently Asked Questions
Is regional property a better investment than metro in Australia?
Neither zone is universally better — they trade different strengths. According to HtAG Analytics data (May 2026), the median regional house suburb offers a 37% lower entry price, a 3.15% yield vs 2.79%, and 119.6% ten-year growth vs 93.2%; the median metro suburb sells 21 days faster with deeper buyer markets. Match the zone to your brief: cashflow and affordability point regional, exit liquidity and stability point metro.
What are the main risks of regional property investment?
The three measurable risks are liquidity (median 53 days on market vs 32 in metro), thin transaction volumes that widen valuation uncertainty, and economic concentration in single-industry towns. All three are screenable: HtAG Analytics tracks sales volume, hold periods, vacancy and economic diversification for every Australian suburb, so the riskiest regional markets can be excluded before shortlisting.
Which states show the strongest regional outperformance in 2026?
Victoria and NSW. Regional Victoria’s median suburb grew 34.4% over the five years to May 2026 against Greater Melbourne’s 13.4%, and regional NSW grew 41.7% against Greater Sydney’s 31.3%. The pattern reverses in Queensland and WA, where Greater Brisbane (88.0%) and Greater Perth (102.8%) out-grew their regional counterparts (HtAG Analytics, May 2026).
How do I access HtAG regional vs metro data inside Claude or Perplexity?
HtAG data is available through MCP (Model Context Protocol) connectors to any compatible AI agent — Claude, Perplexity, Manus AI, and others. Browse the endpoint catalogue at developer.htagai.com and submit the HtAG Developer Portal application. Approved applicants receive an API key and a setup guide for their preferred AI tool.
Disclaimer
This article is for educational purposes only and does not constitute financial advice. Property investment carries risks, and past performance is not indicative of future results. All growth rates, yields, and projections are derived from historical data and statistical modelling — they are not guarantees of future performance. Always conduct your own due diligence and consult a qualified financial adviser before making investment decisions.


