
Are Property Booms Contagious? A 6,229-Market Test
Do booms trigger booms? HtAG tested 6,229 house markets. The ’10x contagion’ signal is momentum – distinct booms arrive at random, ~4.4 years apart. Selection beats timing.
Do booms trigger booms? HtAG tested 6,229 house markets. The ’10x contagion’ signal is momentum – distinct booms arrive at random, ~4.4 years apart. Selection beats timing.
Does property growth ripple suburb to suburb? HtAG tested ~562,000 pairs. Neighbours co-boom (2.91x) but it’s synchronisation, not a tradeable wave. Selection wins.
Perth’s boom is maturing and every suburb we checked is decelerating. See how six Perth investment suburbs compare on live HtAG house data — RCS, yield and cycle — as at June 2026.
Six affordable Australian house markets under $500,000 that still score well on live HtAG data (RCS, yield and cycle, June 2026) — and why the cheapest, highest-yielding suburbs are usually the weakest buys.
ChatGPT and Claude can’t see live Australian property prices on their own. Here’s how to connect them to HtAG data via MCP — no code — with a worked example.
How much deposit do you need for an investment property? Usually 10-20% – but the same deposit unlocks very different markets. See what HtAG data shows.
Gross rental yield is annual rent divided by price, times 100. The formula, worked Australian examples, gross vs net, and what counts as a good yield in 2026.
June 2026 — the first post-Budget month. Victoria surged to 51.6% of national property research, NSW fell to a record-low 12.6%, Tasmania hit a record 9.4%, and Emerald (QLD) and Mildura (VIC) tied as the most-researched suburbs. A demand/attention index, free to cite.
Rentvesting lets you rent where you live and invest where the data points. Real HtAG numbers: a $469,612 house at 4.67% yield vs a $2.39M home at 2.41%.
A buyer’s market favours buyers; a seller’s favours vendors. Learn the five suburb-level signals that reveal which one you’re standing in — with live 2026 HtAG data.
HTAG Research maps the Australian suburbs most exposed to the 2027 negative gearing and CGT changes. 26 high-confidence suburbs, 58% in NSW. Free data + PDF.
HtAG Research scores 2,386 Australian house markets for structural risk. See the riskiest suburbs in Australia 2026, the method behind the ranking, and what’s driving the risk.
Where Australia’s investors and buyers’ agents researched in May 2026: Victoria 45.4%, Queensland overtakes NSW at 21.1%, Craigieburn #1. Free to cite.
Four suburbs, near-identical 3.4-3.6% yields – yet HtAG scored them 81 to 26 out of 100. An opinion on why raw property data isn’t enough to pick a winner in 2026.
Area or the perfect property? HtAG data on 1,157 markets shows the area explains 85.7% of 5-year capital growth — and a $648,568 gap between regions.
AI gets Australian suburb picks wrong over half the time. Here’s how to use AI for property research the right way — on live HtAG data via MCP.
A fast, data-led workflow to shortlist investment suburbs and vet real listings in minutes – with a full video demo and the metrics behind it.
A data-driven guide to equity recycling in Australia: how much equity you can release, and how to screen the redeploy suburb with live HtAG signals.
About 70% of Australian investors never buy a second property. Here’s the data-led framework for building a balanced property portfolio in 2026.
Property analytics turns raw property data into metrics and trends. See a worked HtAG example and how it differs from property intelligence.
The five-layer property data stack buyers agents use in 2026 — from Typical Price and RCS to a defensible buy recommendation, with a live HtAG example.
How HtAG validates property forecasts against realised growth — and how to judge any prediction you read.
The Relative Composite Score (RCS) is HtAG Analytics’ 1-100 suburb score across Capital Growth, Cashflow and Lower Risk – with a worked example and how to read the bands.
AI-native property intelligence is property intelligence delivered through APIs and MCP so an AI agent can query Australian property signals live — without re-keying numbers.
How real estate agents use Typical Price, days on market and the Growth Rate Cycle to appraise accurately and win listings on evidence in 2026.
Growth Spillover Effect (GSP) compares a suburb’s growth to its LGA average. Negative GSP flags early-cycle suburbs — with a real 3-suburb worked example.
The four suburb-risk signals every mortgage broker should read before settlement — vacancy, supply, affordability and cycle — powered by HtAG Analytics.
Growth Pattern Deviation (GPD) compares a suburb’s growth to its own historical average. Negative means room to grow; positive means running hot. Here’s how HtAG calculates and uses it.
Property Intelligence turns raw property data into scored, decision-grade signals. The canonical HtAG definition, the four-layer stack, and how AI uses it.
How HTAG became AI agent infrastructure: a complete guide to MCP, MCP servers, the MCP Registry, and building property intelligence agents on Australian data.
A data analyst couple went from a contact-form inquiry to under contract in 48 days. 7,409 markets screened, 7 suburbs passed.
HtAG data screens 33 Tasmanian suburbs and ranks the top 10 for 2026 — prices, yields and growth signals inside.
HtAG data maps 6 Adelaide investment sub-markets — from $747k outer north to $1.6M inner east — and the suburbs that screen strongest for 2026.
We back-tested HtAG’s Dex strategy against every Australian house suburb for 14 years. It beat the market every year — by up to $71,000. See the data.
HtAG data ranks South Australia’s standout 2026 investment suburbs — Port Pirie South leads on a 5.7% yield and 16.4% growth. See the full data-backed list.
HtAG Analytics compares 5,280 Australian house markets: regional suburbs offer 37% lower entry prices and higher yields, but metro wins on liquidity.
Brisbane is six sub-markets, not one. HtAG Analytics data across 500+ suburbs reveals which 2026 corridors are still mid-cycle — and which inner suburbs have already peaked.
Sydney is six sub-markets, not one. HtAG Analytics data across 600+ suburbs reveals where the 2026 investment signals sit — and which premium postcodes are quietly underperforming.
Western Australia’s 1,247 suburbs in 2026, narrowed by HtAG Analytics’ seven-filter framework to ~62 truly investable markets. Here’s how.
The HTAG Developer Portal exposes 15,000+ Australian suburbs of property data to any MCP-aware AI agent — Claude, Perplexity, ChatGPT, Manus, Copilot — and to any REST integration. Self-register at developer.htagai.com.
Use HtAG Analytics’ 7-filter framework, GRC cycle reads, and Dex methodology to identify the best NSW suburbs to invest in for 2026 — across Greater Sydney, the Hunter, Central Coast, Northern Rivers and regional inland NSW.
Use HtAG Analytics’ 7-filter framework, GRC cycle reads, and Dex methodology to identify the best Queensland suburbs to invest in for 2026 — across SEQ, regional north QLD, and the Darling Downs.
HtAG’s hex cascade method reveals risks suburb data hides — including 1 property that breached the brief at hex level but passed at suburb level.
The 4-stage framework HtAG Analytics uses to separate genuine high-yield Australian suburbs from yield traps. Methodology + May 2026 landscape.
A suburb report contains dozens of numbers — but only 9 actually predict where prices are heading. Here’s how to read each one, with HtAG Analytics data.
Most suburb research stops at median price. The HtAG 7-step framework — brief, demand depth, supply, demand, momentum, risk, timing — separates investable suburbs from noise.
In May 2024, CoreLogic, Hotspotting and Money Magazine all said buy Perth. A simple HtAG filter said the opposite. 24 months later, the filter delivered +25.7%.
Where Australia’s investors researched in April 2026: NSW hits a record 20.6%, Dubbo #1, Tasmania record 8.4%. Free-to-cite HtAG Research index.
HtAG Analytics data across 15,000 suburbs reveals 7 signals that identify genuinely undervalued Australian suburbs in 2026 — and how to validate them before you buy.
HtAG data reveals the 5 supply and demand signals — stock on market, days on market, vacancy, search index, demand profile — that predict Australian suburb growth in 2026.
HtAG Analytics data reveals ~47 suburbs transitioning to fast-growth phase in Q1 2026. Discover which leading indicators identify momentum before the headlines do.

HtAG Analytics identifies 43 Australian suburbs entering recovery phase in Q1 2026 using Growth Rate Cycle data — with a 6.8-month lead time advantage over standard median price indicators.
HtAG Analytics reveals which Australian suburbs still deliver positive cashflow in 2026 — the yield thresholds, vacancy signals, and data framework to find them.
Vacancy rates above 3% signal an 84% probability of yield decline within two quarters. Learn how to read suburb-level vacancy data — and the traps investors miss — using HtAG Analytics data.

A complete property investment strategy for Australia in 2026 — covering brief construction, suburb selection methodology, the four strategy archetypes, and how to use data to validate every decision.
Rental yield and capital growth are not opposing strategies — they are complementary metrics. HtAG Analytics data shows the 2026 suburbs delivering both, and how to filter for them.
Where Australia researched property in March 2026: a record 830 suburbs, WA & SA both hit record 6.3%, Alfredton #1. Free-to-cite HtAG Research index.

How do professional buyers agents research suburbs? HtAG Analytics breaks down the 6-step data framework used across 135+ validated recommendations — from macro filtering to street-level due diligence.

HtAG Analytics reveals why raw suburb median price growth misleads investors — and the forward-looking metrics that detect market turns 6-12 months earlier.

HtAG Analytics data reveals which Melbourne suburb types show recovery-phase signals in 2026, and the 4 metrics that separate genuine opportunity from overpriced hope.
Mornington VIC property investment analysis for 2026. Market phase: Accelerating Growth. Price range: $1.2M–$1.4M. 36-day selling speed. Powered by HtAG Analytics.
![What Is the Property Market Cycle in Australia? The 4 Phases Explained [2026]](https://www.htag.com.au/wp-content/uploads/2026/03/cycle.png)
The property market cycle in Australia moves through 4 phases. HtAG Analytics tracks cycle position across 15,000+ suburbs — 18% are in Phase 1 recovery as of Q1 2026.
HtAG Analytics processed 2,327,175 property transactions across 4,881 suburbs to identify Australia’s real property hotspots for 2026 — including 85 momentum-recovery suburbs, 141 overheated markets, and 282 no-go zones.

HtAG Analytics data across 3,704 suburbs reveals Victoria leads with 196 suburbs entering recovery phase. State-by-state 2026 growth forecasts inside.

The best Victorian suburb to invest in depends entirely on your hold period, equity extraction timing, and risk profile. Here is why a generic suburb list will mislead you — and what brief-driven suburb selection actually looks like.

HtAG Analytics data identifies 392 suburbs in early GRC momentum for 2026. Regional Victoria leads with Camperdown (5.0% yield, 0.23% vacancy) and Hamilton (4.7% yield, RCS 88) flagged as early-cycle opportunities.

HtAG Analytics data across 196 LGAs shows the average growth spread between best and worst suburbs within a single council area is 47–60 percentage points. Here’s why suburb-level analysis is essential.

HtAG Analytics data across 3,603 suburbs shows IRSAD decile 1 suburbs averaged 88.5% five-year growth vs 36.3% for decile 10 — a 52-point gap. The crossover zone (IRSAD 2–5) offers the best risk-adjusted returns.

ChatGPT recommended Salisbury North as a top SA investment suburb using 3 metrics. HtAG Analytics ran 106 data points and found elevated risk, fading momentum, and an RCS of just 21/100.

HtAG Analytics data across 3,603 suburbs shows suburbs with 0–2% public housing delivered 73.5% five-year growth vs 42.5% for those above 20%. Here’s how to screen before you buy.

HtAG Analytics data across 4,254 suburbs reveals why cheap suburbs underperform and how to find genuinely undervalued suburbs in Australia using IRSAD and affordability metrics.

Short Summary A property market forecast is only as good as the data and methodology behind it. HtAG Analytics has built a 3-method composite statistical model — drawing on momentum-decay, weighted CAGR blending, and mean-reversion analysis — to project 12-month typical price growth across all eight Australian states and territories. Powered by 2,327,175 monthly observations … Read more
Where Australia researched property in February 2026: Victoria surges back to 48%, claims 18 of the Top 20; Tasmania record 6.6%; Alfredton #1. Free to cite.
Where Australia researched property in January 2026: Victoria eases to 41.2%, Queensland surges to 24.1%, SA the biggest gainer, and a four-way tie at #1. Free to cite.

Short Summary Stop waiting decades for gentrification. Learn how to use HtAG’s Street Lens and granular property heatmaps to identify “lagging assets” and immediate value gaps within established Australian suburbs. This guide explores how predictive analytics and hexagonal data mapping reveal hidden investment opportunities that standard suburb-level statistics often conceal, providing a data-driven workflow to … Read more

Short Summary The Q1 update confirms that opportunity exists for those who look beyond the headlines. Whether it is the cash flow of Broken Hill or the inventory shortage in Durack, HTAG Analytics provides the property data required to make confident decisions. Data Source: HTAG Analytics Dex™ GeoDex™ Modules. All metrics current as of Q1 … Read more
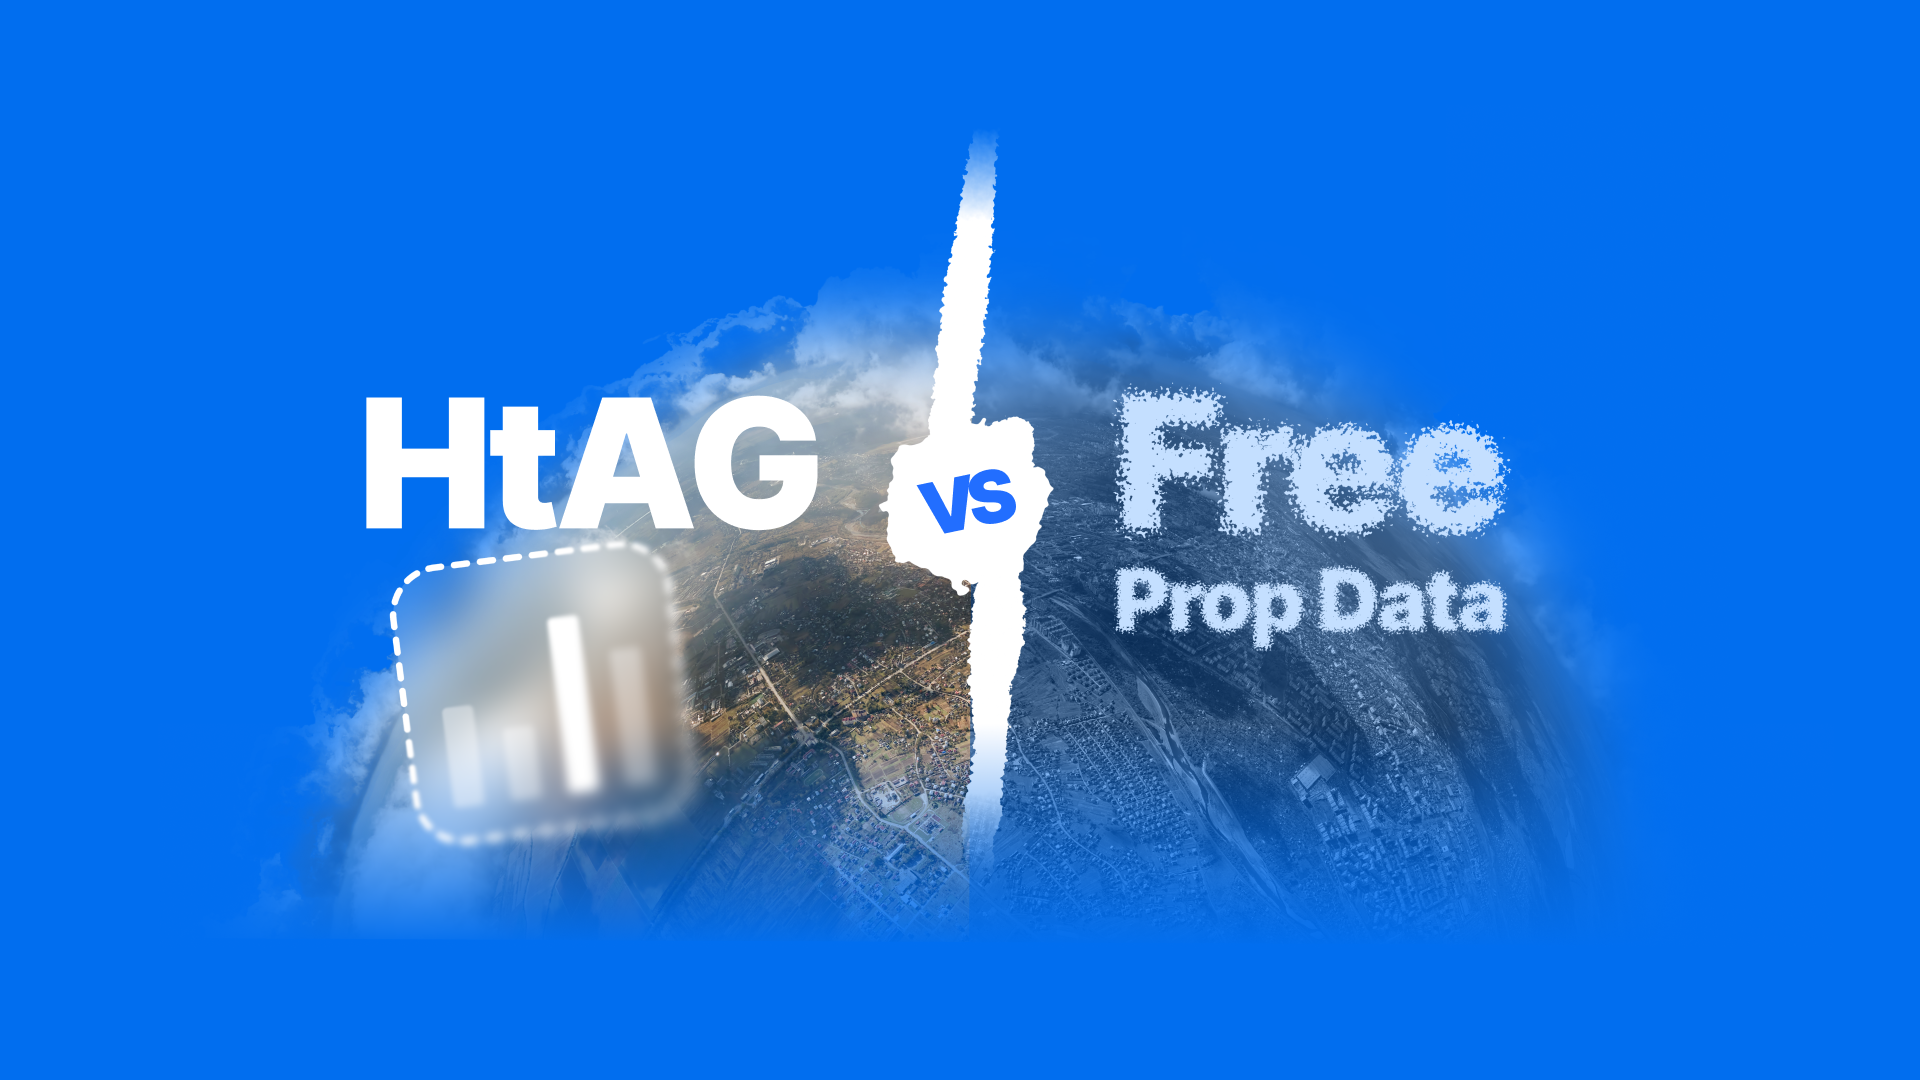
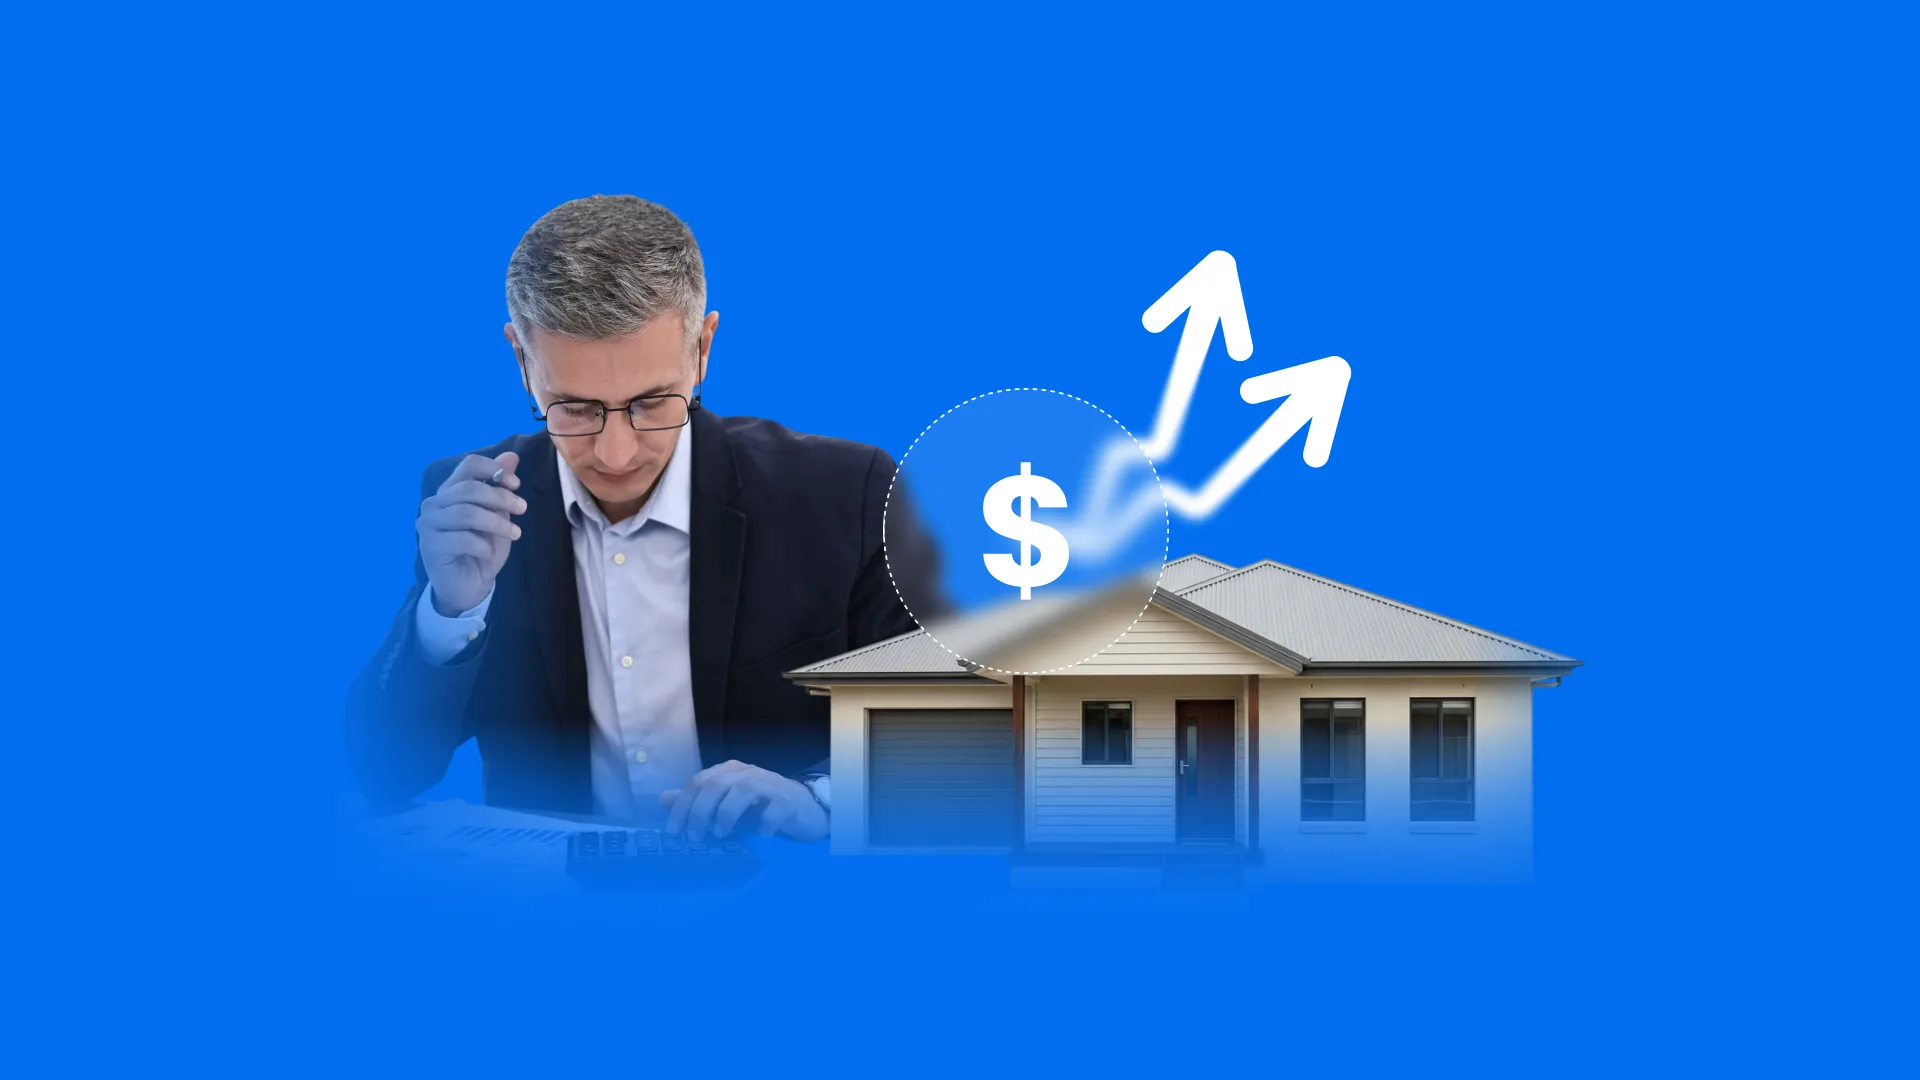
Short Summary While free property data is useful for casual browsing, it provides only a “descriptive” view of the market—telling you what has already happened, rather than what is likely to happen next. For serious property investors and professionals, relying solely on historical snapshots can lead to costly mistakes, such as entering a market after … Read more

Short Summary The five signs a suburb is about to boom aren’t mysterious. They’re quantifiable, observable, and predictable when you use the right property market data Australia tools. Stop relying on gut feel. Start stacking probabilities in your favour. How to Find High Capital Growth Suburbs Before the Market Catches On If you’re searching for … Read more
Short Summary Location accounts for approximately 80% of a property’s capital growth—not the asset itself. This well-established principle fundamentally changes how smart investors approach suburb selection. Yet comparing thousands of suburbs across the metrics that actually drive performance has traditionally been nearly impossible. HTAG’s Dex™ module solves this challenge, enabling investors to rank and compare … Read more
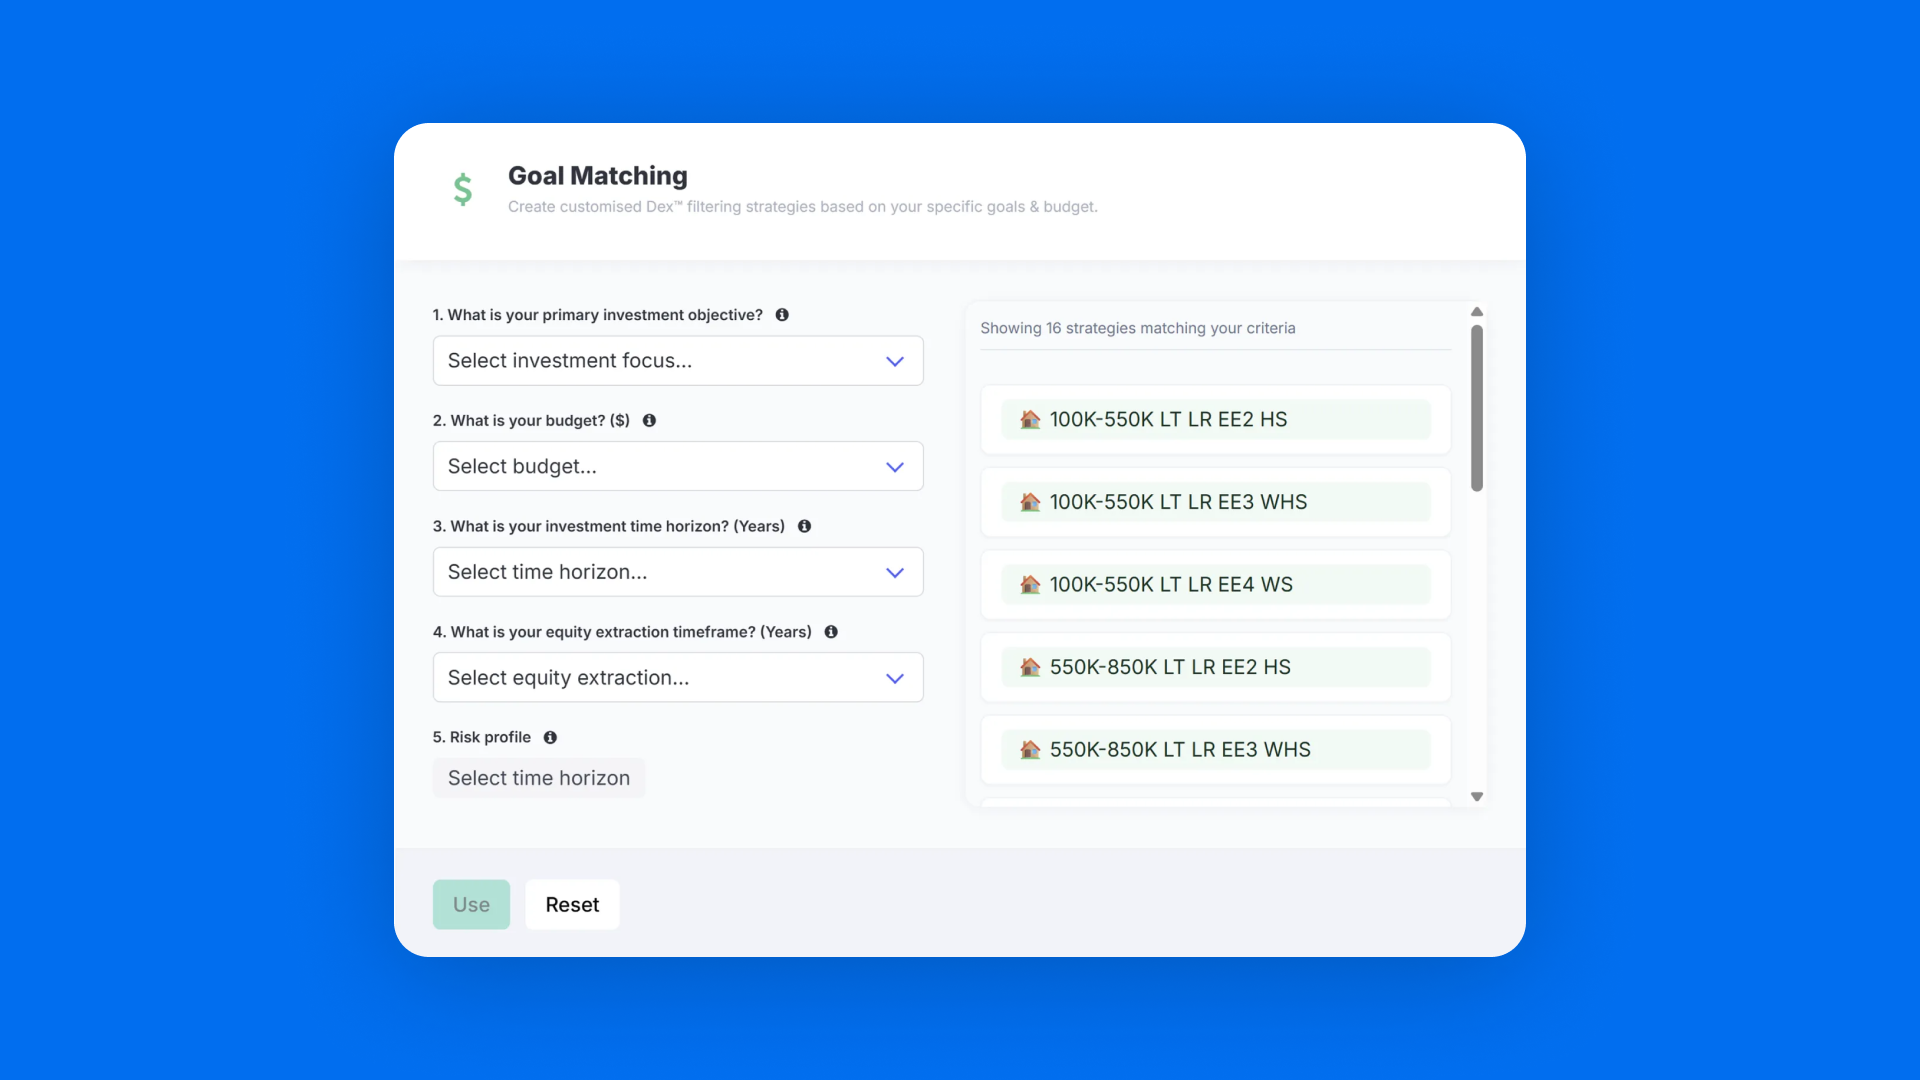
Short Summary Not every suburb is a hotspot for every investor. This fundamental truth underpins successful property investment, yet it’s frequently overlooked. Your financial circumstances, investment objectives, asset holding timeframe, and budget create a unique investment profile that demands a tailored approach to suburb selection. HTAG’s Goal Matching feature eliminates the guesswork by using predictive … Read more

In today’s competitive Australian property market, making informed investment decisions has never been more critical. HTAG Analytics has emerged as the leading PropTech platform, revolutionizing how property investors and professionals approach market research and investment analysis. With its sophisticated AI-powered tools and comprehensive data insights, HTAG Analytics is transforming the property investment landscape across Australia. … Read more

Introduction The Australian buyer agent industry has experienced significant regulatory changes in 2025, with new mutual recognition arrangements, mandatory professional development requirements, and enhanced consumer protection measures. Whether you’re an aspiring buyer’s agent or a seasoned professional looking to expand interstate, understanding the latest licensing pathways, training requirements, and compliance obligations is essential for operating … Read more

In recent years, the use of Self-Managed Super Funds (SMSF) to invest in property has grown increasingly popular as Australians explore diverse methods to generate long-term wealth. However, despite the potential advantages, SMSFs also come with their own unique complexities and investment constraints. To unravel these intricacies, we’ve spoken extensively with property strategist Josh Deckart, … Read more

How do you find the best deals on property? It can be a tough task, but with HtAG Analytics, it’s no longer a difficult process. In this post we’ll introduce you to features that help discover high ROI property markets and match them to your budget and strategy.

Video Summary: 00:00:00 – Introduction to the video.00:00:05 – Discussing the importance of Capital Growth for decision making.00:00:14 – Explaining how one metric can help in decision making.00:00:37 – Talking about the growth in the last ten years.00:01:01 – Comparing two areas with different growth rates.00:01:55 – Expanded expert view provides more information.00:02:42 – Sorting … Read more

Video Summary: 00:00 – Introduction01:00 – Importance of personal circumstances and strategy in property investment02:00 – Three aspects to consider in a buy and flip strategy: timeline, location, and price03:00 – How to use the platform to search for appropriate neighborhoods04:00 – Finding the locations that meet the criteria of the buy and flip strategy06:00 … Read more

Video summary: 0:00 – Matt introduces HtAG Analytics and the purpose of the video series.0:20 – Log into the platform and gives a quick overview of the dashboard.1:10 – Matt explains the different views available for the data table and what each view displays.2:35 – How to use the various filters and sorting options available … Read more

Video Summary: 00:00:00 – Introduction to the data dictionary00:00:20 – Purpose of the data dictionary in supporting the website’s features00:00:57 – Color-coded statistics representation in the data dictionary00:01:12 – How to access the data dictionary on the website00:01:30 – Definitions and favorable/neutral/unfavorable statistics for each metric00:01:39 – Continuous development and updates of the data dictionary00:01:54 … Read more

Video Summary: 0:00:00 – Introduction0:00:08 – Purpose of the video0:00:45 – Locating the PDF feature on the platform0:01:00 – Generating a PDF for a council area0:01:53 – PDF content overview0:02:49 – Generating a PDF for a specific suburb0:03:32 – PDF content for a specific suburb0:04:00 – Uses of the PDF reports0:04:07 – Closing remarks

Video Summary: 0:00 – Introduction to the topic and a popular opinion regarding research0:50 – Explaining the process of selecting two different areas with stark differences (Camden and East Pilbara)1:54 – Using the website and selecting a single metric (10-year growth) to analyze investment suitability3:22 – Analyzing snapshot data of Camden and identifying it as … Read more

Video Summary: 0:00 – Introduction to searching for a property investment area based on previous search0:20 – Explanation of standard view, advanced view, and expert view in tables1:05 – Focusing on capital growth and searching for areas with high growth in the past2:00 – Adding conditions for the search (e.g. 10-year growth greater than or … Read more

In part 3 of our blog series, we highlighted the benefits of GRC feature. In this post we will provide an overview of the last 2 tabs on the LGA pages. Heatmap tab is a different way of presenting the GRC information in that it permits clients to look for meaningful relationships between areas and find growth clusters in terms of their rate of change. It permits for a bird’s eye view of the council area that not only highlights the geography of growth, so to speak, but also enables customers to ascertain growth corridors within a particular locality that might possess better market fundamentals and thus be of higher investment grade. The red indicates negative YoY growth while green highlights positive YoY growth.

Determining market fundamentals from ‘behaviour of the curve’ i.e. forecasts from Part 2 in this blog series is not always sufficient. It becomes pertinent only when considered alongside the rate of growth for an area. This information can be obtained from Growth Rate Cycle tab, which we will focus on in this post.
The GRC (Growth Rate Cycle) represents the rate of growth change in median value and is a little different to the ‘property clock’ which has predominantly been used by investment professionals to determine the position of the area in a cycle. The best way to highlight this difference is to explain the philosophy behind the GRC and the property clock cycle notions…

Second post in the 4-part educational series that explains how to use the HtAG platform. The author is using an assumed persona of a DYI investor researching the Camden Council, NSW property market. In this post we deep dive into the use of LGA page ranking table and the forecast graphs.

This notion has always been the gold nugget of property investing. What it essentially means is that one realizes profit or capital gain upon purchasing the property because the value for which it was acquired was less than what the property is ‘actually’ worth.
However, the term is a little obscure because the real or ‘true’ market value of a property is realized upon the sale of that property; essentially we do not know how much a property is worth and what its ‘market value’ is before it is sold.
This means that buying ‘below market value’ is more a matter of opinion than it is a matter of fact—that fact that a property sold for less than it is worth cannot be objectively determined as one has no avenue of knowing and subsequently having a widespread consensus on the plausibility of the two figures (i.e. the actual worth of a property and the selling price).
In response to the above, at HtAG, we offer a little bit of a different take on the buying below market value notion. Firstly, by focusing on real time data used in highlighting investment quality of suburbs, one deals with what has been one of the major issues with the property advisory sector, namely the gaps in the subjective opinion of advisers and the advice given on the back of conflicting interests…

Our mission is to provide pertinent and accurate property investment data easily accessible to everyone irrespective of their property investment experience, professional background, and/or financial backing.
For this reason, we strive to think of innovative ways to present and arrange property data so that it provides more insight to our clients and assists them in making informed investment decisions. We endeavour to highlight a ‘new fond’ meaningfulness in different property data sets that were previously considered as either irrelevant or insignificant (or not significant enough).
To this end, our business modus vivendi is to arrange, organise and present data in different ways not only to highlight the potential of suburbs and LGAs but, more importantly, to provide a more attuned ‘lens’ for perceiving and understanding current and future market dynamics…

The need for HtAG arose in response to the complexity of the property investment space as well as barriers to entry for obtaining accurate and valuable information about the property market’s movements. Australian property market is comprised of a plethora of submarkets, each with its own patterns and trajectories sometimes moving to different ‘beats’ and in different directions. Organising information to compare the investment potential of these numerous submarkets is more often than not a lengthy and costly process requiring a team of professionals.


