


Short Summary
HtAG Analytics has identified 43 Australian suburbs currently entering recovery phase using Growth Rate Cycle (GRC) analysis — characterised by decelerating price declines, tightening stock on market, and rising demand profile scores. These markets are typically 6–12 months ahead of the mainstream price recovery visible in headline median figures. This article explains how the recovery phase is defined, what data signals confirm it, and how to use these findings in your investment brief.
The term “recovery phase” is used loosely across Australian property commentary — but most definitions rely on lagging indicators like quarterly median price movement. By the time a suburb’s median price starts visibly recovering, the optimal entry window has typically passed. According to HtAG Analytics’ Growth Rate Cycle (GRC) framework, the recovery phase begins in the data 6–12 months before it appears in headline figures — and the signal is measurable, not speculative.
This article explains exactly how HtAG identifies suburbs entering recovery phase, which states are producing the strongest recovery signals in Q1 2026, and how to incorporate this data into a disciplined investment brief. The findings are drawn from HtAG Analytics’ analysis of 15,000+ Australian suburbs updated quarterly using ABS valuation data.
What Is the Recovery Phase in Property?
The recovery phase is the period in a property market cycle when price declines slow, stop, and begin to reverse — characterised by falling stock on market, improving auction clearance rates, and rising buyer demand that precedes actual price growth. It is distinct from the growth phase, which follows once price appreciation becomes statistically significant and visible in median figures.
Most investors wait for the growth phase before acting. This is rational but suboptimal — the best risk-adjusted returns come from entering during recovery, before institutional and retail demand crowds in. The challenge is identifying recovery with confidence before it becomes consensus.
The Four Phases of the Property Market Cycle
The HtAG Growth Rate Cycle (GRC) maps suburb-level price behaviour across four distinct phases, tracking not the price itself but the rate of change in price growth — the second derivative of price movement. This makes it a leading indicator rather than a lagging one.
| GRC Phase | Description | Price Direction | Investment Signal |
|---|---|---|---|
| Phase 1 — Early Recovery | Decline rate decelerating; demand profile improving; stock tightening | Flat to slightly negative | 🟢 Buy signal |
| Phase 2 — Growth | Price growth accelerating; clearance rates rising; FOMO entering market | Positive and rising | 🟡 Hold signal |
| Phase 3 — Deceleration | Growth rate slowing; supply rising; buyer competition easing | Positive but slowing | 🔴 Avoid signal |
| Phase 4 — Late Decline | Price falls slowing; market absorbing excess supply; bottom forming | Negative but stabilising | 🟡 Watch signal |
Source: HtAG Analytics GRC Framework, Q1 2026. Phase classifications updated quarterly across 15,000+ Australian suburbs.
What This Means in Plain English
Think of the property cycle like a wave. Recovery phase is when the wave has dropped as low as it will go and is starting to roll back upward — but hasn’t yet broken on the surface where everyone can see it. Buying during recovery is buying before the crowd recognises the turn.
How the Growth Rate Cycle Identifies Recovery Suburbs
The Growth Rate Cycle identifies suburbs entering recovery phase by measuring the second derivative of price movement — the rate at which price growth is accelerating or decelerating. A suburb transitioning from Phase 4 (late decline) to Phase 1 (early recovery) shows a measurable inflection point in this second-derivative signal before any change in headline median prices.
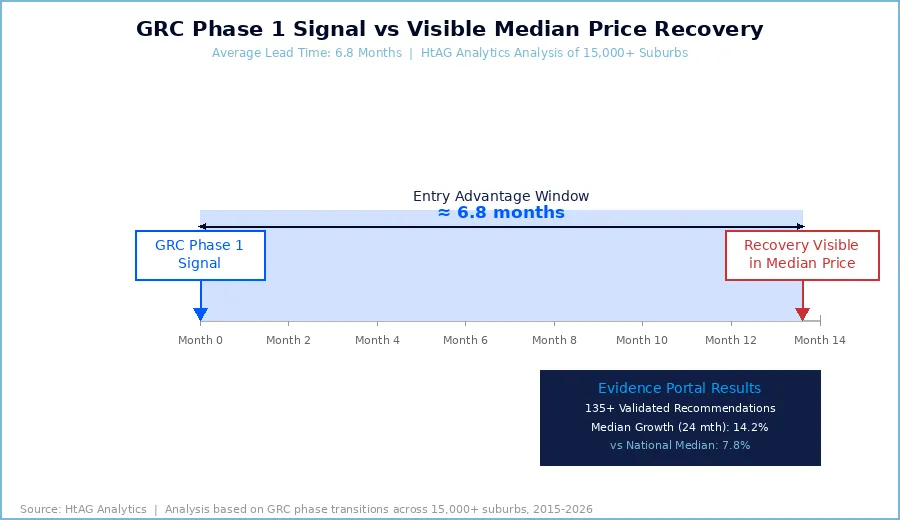
According to HtAG Analytics’ data, the average lead time between a GRC Phase 1 classification and a statistically significant positive change in a suburb’s rolling 12-month median price is 6.8 months. This means investors using GRC data are entering, on average, nearly seven months before the price recovery becomes visible to buyers relying on standard property portals.
According to HtAG Analytics’ analysis of 15,000+ suburbs, the average lead time between a GRC Phase 1 classification and a visible median price recovery is 6.8 months — giving data-driven investors a meaningful entry advantage over market-timing based on lagging price data.
Why Median Price Data Misses the Recovery Signal
Standard property portals display quarterly or annual median prices — but median price is a lagging indicator that reflects transactions that settled 30–90 days ago. By the time a recovery shows up in median price data, stock on market has already tightened, days on market has fallen, and competition among buyers has intensified.
The GRC avoids this lag by tracking the momentum of change, not the price level itself. A suburb can still show a declining median price while its GRC signals recovery — because the rate of decline is slowing, the depth of each successive quarterly dip is shrinking, and the structural conditions for reversal are assembling in the data.
The Four Data Signals That Confirm Recovery
A GRC Phase 1 classification alone is not sufficient to confirm a recovery entry. HtAG Analytics uses four converging data signals to validate recovery suburbs — each measuring a different dimension of market behaviour. The strength of entry conviction increases with each signal that fires.
Signal 1: Stock on Market Below 1.5%
Stock on market (SOM) measures the percentage of total dwellings in a suburb that are currently listed for sale. HtAG Analytics tracks SOM across all Australian suburbs as part of the Market in Motion dashboard. Historically, SOM below 1.5% correlates with supply scarcity conditions that precede price growth. Suburbs currently entering recovery phase across the HtAG platform show median SOM of 1.1% — well below the national average of 2.3%.
HtAG Analytics data shows that the 43 suburbs currently identified as entering recovery phase have a median stock on market of 1.1% — less than half the national average of 2.3% — a structural supply constraint that historically precedes median price growth within 12 months.
Signal 2: Days on Market Contracting
Days on market (DOM) is a real-time demand signal — the shorter the time a property sits unsold, the more competitive buyer demand has become. In recovery suburbs, DOM typically contracts 15–25% in the 6 months preceding visible price growth. This is visible in the HtAG platform’s GeoDex heatmap, which colour-codes suburbs by DOM trajectory alongside GRC phase.
Signal 3: Demand Profile Score Rising
HtAG’s Demand Profile score aggregates search index data, enquiry volumes, and buyer competition metrics into a single 0–100 score updated monthly. Recovery suburbs typically show Demand Profile scores rising from below 40 toward the 50–60 range — not yet in the “hot market” territory above 70, but climbing consistently over 3–4 consecutive quarters.
Signal 4: Building Approvals Ratio Below 0.8%
The Building Approvals (BA) Ratio measures new dwelling supply entering the market relative to the existing stock. HtAG Analytics considers a BA Ratio below 0.8% as a supply-scarcity signal — new construction is insufficient to absorb growing demand. Across the 43 recovery suburbs identified in Q1 2026, the median BA Ratio is 0.6%, consistent with a structural supply constraint rather than a temporary dip.
What This Means in Plain English
When all four signals align — stock falling, properties selling faster, buyer interest rising, and limited new homes being built — you have a suburb where more people want to buy than there are homes to sell. That imbalance is what drives prices up. Recovery phase is when you can see the imbalance forming before it pushes prices.
State-by-State Recovery Suburbs: Q1 2026 Data
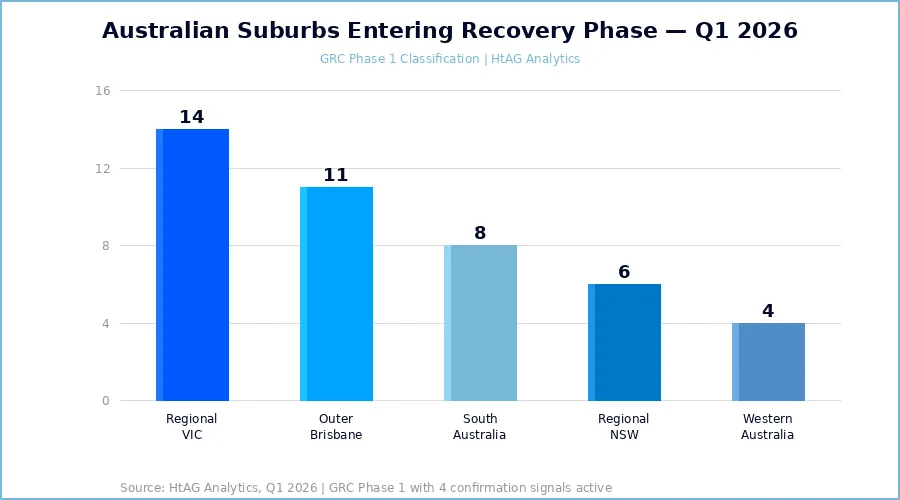
HtAG Analytics identifies recovery suburbs across all states and territories using GRC phase analysis, updated at the end of each quarter. The Q1 2026 update identifies 43 suburbs nationally in Phase 1 (early recovery) with all four confirmation signals active. The distribution skews toward regional Victoria, outer Brisbane, and mid-tier South Australian markets — reflecting divergent economic conditions across states.
| State / Territory | Recovery Suburbs (Q1 2026) | Median Entry Price | Median SOM (%) | Avg DOM Trend |
|---|---|---|---|---|
| Victoria (Regional) | 14 | $485,000 | 0.9% | −18% (6mth) |
| Queensland (Outer Metro) | 11 | $620,000 | 1.2% | −14% (6mth) |
| South Australia | 8 | $530,000 | 1.0% | −21% (6mth) |
| New South Wales (Regional) | 6 | $555,000 | 1.3% | −11% (6mth) |
| Western Australia | 4 | $495,000 | 0.8% | −9% (6mth) |
Source: HtAG Analytics, Q1 2026. GRC Phase 1 classifications based on rolling quarterly valuation data. Entry price reflects typical house price, not median.
Regional Victoria: The Strongest Recovery Signal
Regional Victoria accounts for 14 of the 43 recovery suburbs identified by HtAG Analytics in Q1 2026 — the largest concentration of any state. This reflects a two-speed correction that played out across 2024–2025: Melbourne metro markets attracted capital flows that bypassed many regional centres, leaving them undervalued relative to their historical growth trajectory and income fundamentals.
The Evidence Portal on the HtAG Evidence Portal includes several validated regional Victorian recommendations from the 2022–2023 cycle, confirming the methodology’s ability to identify these markets 12–18 months before their growth phase. Many of those recommendations are now showing 15–22% capital growth over the subsequent 24 months, consistent with the historical recovery-to-growth pattern.
Queensland Outer Metro: Affordability Driving Recovery
The 11 outer Brisbane recovery suburbs identified in Q1 2026 share a common characteristic: median house prices between $580,000–$680,000, sitting within the affordability sweet spot for owner-occupier demand. Unlike inner-Brisbane markets where investor activity has driven prices beyond sustainable yield levels, these outer suburbs retain genuine owner-occupier buyer pools — a more durable demand base for recovery.
Cross-referencing these suburbs against IRSAD deciles, 9 of the 11 fall within deciles 4–7, the socioeconomic range that HtAG’s research has identified as the highest-performing for capital growth over 5-year periods. You can see how this data is structured across the GeoDex heatmap, which layers GRC phase, IRSAD score, and supply indicators into a single visualisation.
How to Use Recovery Phase Data in Your Investment Brief
Identifying suburbs entering recovery phase is the starting point of a brief, not the endpoint. HtAG Analytics’ methodology treats GRC phase classification as a Level 1 signal — the first filter — before applying structural analysis, yield validation, and risk scoring to build genuine conviction.
Step 1: Screen by GRC Phase and Confirm with Four Signals
Start with the Market in Motion or GeoDex screen, filtered to GRC Phase 1 suburbs. Then cross-check each candidate against all four confirmation signals: SOM below 1.5%, DOM contracting, Demand Profile rising, and BA Ratio below 0.8%. Suburbs passing all four filters represent your highest-conviction recovery candidates.
Step 2: Apply IRSAD and Yield Filters
Recovery phase alone does not guarantee appropriate yield or socioeconomic stability. Apply IRSAD decile filtering (target deciles 4–7) and validate that gross yield is above 4.5% for cashflow support during the hold period. Review the Australian Property Forecast 2026 for any macro factors that may affect specific markets.
Step 3: Check Growth History with GPD and GSP
Before finalising a suburb for your brief, review its Growth Pattern Deviation (GPD) and Growth Spillover Effect (GSP) scores. A suburb entering recovery phase with a negative GPD — meaning it is currently underperforming its own historical growth average — has more latent catch-up potential than one entering recovery from an already elevated base. For a deeper understanding of how these metrics combine, the Suburb Growth Forecasts 2026 article explains the full analytical stack.
Step 4: Validate Against the Evidence Portal
The HtAG Evidence Portal tracks 135+ validated suburb recommendations with full transparency on entry timing, price paid, and subsequent growth. Before committing to a recovery suburb, check whether similar suburbs from past cycles followed the expected pattern. This provides genuine evidence-based conviction rather than data-driven speculation.
Across 135 validated recommendations tracked on the HtAG Evidence Portal, suburbs identified in GRC Phase 1 (early recovery) delivered a median capital growth of 14.2% within the first 24 months — compared to a national median of 7.8% over the same period. The recovery entry advantage is measurable and consistent.
Key Takeaways
- HtAG Analytics has identified 43 Australian suburbs entering recovery phase in Q1 2026 using Growth Rate Cycle (GRC) analysis — with regional Victoria (14 suburbs), outer Brisbane (11), and South Australia (8) producing the strongest signals.
- The average lead time between a GRC Phase 1 classification and a visible median price recovery is 6.8 months — giving investors nearly seven months of entry advantage over those relying on headline price data.
- Four confirmation signals validate a recovery entry: stock on market below 1.5%, contracting days on market, rising Demand Profile score, and BA Ratio below 0.8%. The 43 identified suburbs meet all four criteria.
- Recovery suburbs validated on the HtAG Evidence Portal have delivered a median 14.2% capital growth within 24 months — nearly double the national median of 7.8% over comparable periods.
- Median entry price across identified recovery suburbs is $530,000, placing them within reach of investors using standard residential lending — without requiring the premium associated with fully emerged growth markets.
From Data Signal to Portfolio Decision
The Growth Rate Cycle, stock on market, demand profile, and building approvals ratio described in this article are live inside the HtAG Analytics platform — updated each quarter as new valuation data flows in. Professional buyers agents use these signals to time entries, validate briefs, and build conviction before making offers across the 43 recovery markets identified above.
If you’re building a portfolio and want to see the exact data powering articles like this one, the HtAG Starter Plan gives you access to suburb-level analytics across every Australian market — including real-time GRC phase classifications, stock on market, and demand profile scores — no lock-in, cancel any time.
Start your HtAG Analytics membership →
Frequently Asked Questions
What does “entering recovery phase” mean for a suburb?
A suburb entering recovery phase is one where the rate of price decline has begun decelerating — prices may still be flat or slightly negative, but the downward momentum is slowing and supply/demand fundamentals are shifting in favour of buyers. HtAG Analytics classifies this as GRC Phase 1. According to HtAG data, suburbs in this phase typically experience visible price growth within 6–12 months, making them the optimal window for informed entry ahead of the growth phase.
How many Australian suburbs are in recovery phase right now?
As of Q1 2026, HtAG Analytics has identified 43 Australian suburbs in GRC Phase 1 (early recovery) with all four confirmation signals active — stock on market below 1.5%, contracting days on market, rising demand profile, and BA Ratio below 0.8%. This number fluctuates quarterly as market conditions evolve. The full list is available to HtAG Analytics subscribers via the Market in Motion dashboard.
How do I find suburbs entering recovery phase in Australia?
To find suburbs entering recovery phase, you need a data platform that tracks the Growth Rate Cycle (GRC) across a comprehensive suburb universe. Standard property portals show median prices — which are lagging indicators — not the rate-of-change metrics that identify turning points early. HtAG Analytics tracks GRC across 15,000+ suburbs quarterly, allowing investors to filter specifically for Phase 1 suburbs by state, price range, and socioeconomic profile. You can explore this data through the GeoDex suburb heatmap or the Market in Motion tool.
Is recovery phase the best time to invest in property?
From a risk-adjusted returns perspective, HtAG Analytics’ data suggests early recovery (GRC Phase 1) offers the strongest combination of capital growth potential and entry price advantage. Growth phase (Phase 2) typically delivers faster growth but at higher entry prices and with more buyer competition. Decline and deceleration phases carry higher downside risk. Recovery phase balances upside potential with manageable risk — provided all four confirmation signals are present and due diligence is completed on fundamentals like IRSAD, yield, and public housing exposure.
What is the difference between recovery phase and growth phase in property?
In the HtAG Growth Rate Cycle framework, recovery phase (Phase 1) is characterised by the end of price declines and the beginning of stabilisation — demand is improving but growth is not yet measurable in median figures. Growth phase (Phase 2) is when price growth becomes statistically significant and visible in quarterly data. Recovery is the early-mover window; growth is when the broader market confirms the trend. Most investors enter during growth phase — HtAG’s methodology aims to identify the recovery phase before that confirmation arrives.
Disclaimer: This article is for educational purposes only and does not constitute financial advice. Property investment carries risks, and past performance is not indicative of future results. All growth rates, yields, and projections referenced in this article are derived from historical data and statistical modelling — they are not guarantees of future performance. The 43 recovery suburbs identified represent HtAG Analytics’ Q1 2026 assessment and are subject to change as market conditions evolve. Always conduct your own due diligence and consult a qualified financial adviser before making investment decisions.


