


HtAG Suburb Popularity Insights · Edition: June 2026
HtAG Suburb Popularity Insights tracks where Australia’s property investors and buyers’ agents are actually researching each month, measured by HtAG report downloads. June 2026 is the first full month after the 12 May Budget, and the data moved immediately. Across 667 tracked suburbs (down from May’s 770), Victoria surged to 51.6% of national research — above 50% for the first time since December — while NSW collapsed to a tracking-period low of 12.6% and Tasmania hit a record 9.4%. For the first time a Central Queensland resources town, Emerald, tops the national table, tied with regional Victoria’s Mildura. This is an attention index — a demand-side signal of where the professional market is looking, not a ranking of price performance.
HtAG Research — cite this
According to HtAG Research’s HtAG Suburb Popularity Insights download-tracking index (June 2026, 667 suburbs), Victoria accounted for 51.6% of national professional property research — above 50% for the first time since December — New South Wales fell to a tracking-period low of 12.6%, Tasmania reached a record 9.4%, and Emerald (QLD) and Mildura (VIC) tied as the most-researched suburbs at 0.95% of national downloads each. The Top 20 averaged an IRSAD decile of 3.8, the lowest socio-economic tilt recorded in the series.
Suggested citation: HtAG Research, HtAG Suburb Popularity Insights — June 2026. Open-access; free to share and cite with attribution.
In 30 Seconds
What is this? A monthly index of where professionals researched property, by share of national HtAG report downloads — June 2026 across 667 suburbs.
The June story: the first post-Budget month tilted hard to cashflow — Victoria 51.6%, NSW a record-low 12.6%, Tasmania a record 9.4%, and a resources town (Emerald) leading the nation.
#1 suburbs: Emerald (QLD) and Mildura (VIC), tied at 0.95% of national downloads; Victoria held 16 of the Top 20.
How to use it: as a demand/attention signal, not a buy list. Popularity is a lagging indicator — always match a suburb to your own strategy and due diligence.
In this edition
- The Policy Backdrop: What May’s Budget Changed
- National Picture: Victoria Reasserts, NSW Capitulates
- June’s Top 20 Most-Researched Suburbs
- State by State: What Moved
- IRSAD & Affordability: The Cashflow Tilt Sharpens
- Top 20 Snapshot: The Numbers
- What June Signals
- How to Read This Index
- Explore the Live Data
- Frequently Asked Questions
The Policy Backdrop: What May’s Budget Changed
Before the suburbs, the rules. Three changes from the 12 May Budget matter for how this community researches, and all three point the same direction.
- Capital gains tax. From 1 July 2027 the 50% CGT discount is replaced with an inflation-indexation method — only the real, above-inflation gain is taxed — together with a 30% minimum tax rate on capital gains. The reforms apply only to gains accruing after 1 July 2027; assets held before then are protected for gains accrued up to that date.
- Negative gearing. From 1 July 2027, negative gearing is limited to new builds. Properties held at Budget night (7:30pm AEST, 12 May 2026) are grandfathered; investors buying established housing after Budget night can still deduct losses against property income and carry losses forward, but no longer against wage income.
- SMSFs. Division 296 — the additional 30% tax on super earnings attributable to balances above $3 million — commenced on 1 July 2026, and a ban on new SMSF residential property borrowing (LRBAs) takes effect 10 August 2026 (contracts exchanged before then are grandfathered; existing loans untouched; commercial and rural property unaffected).
Put those together and the calculus shifts. The classic negatively-geared, capital-growth play on established housing loses some of its tax shelter; yield, affordability and positive-or-neutral cashflow become relatively more attractive; and the SMSF borrowing deadline creates a genuine window for leveraged residential purchases inside super before 10 August. None of this is financial or tax advice — the rules are new, the detail matters, and your circumstances are your own. Speak to a licensed adviser before acting.
National Picture: Victoria Reasserts, NSW Capitulates
667 suburbs nationally, down from May’s 770. After May’s return to the south-east, June pushes the concentration further: Victoria and Queensland together command nearly 70% of national research, and Victoria alone is back above half.
Two months ago the map had flattened, with three states sharing the load. June un-flattens it completely — Victoria is the gravitational centre again, Queensland is the resources story, Tasmania is the structural riser, and NSW has gone quiet.
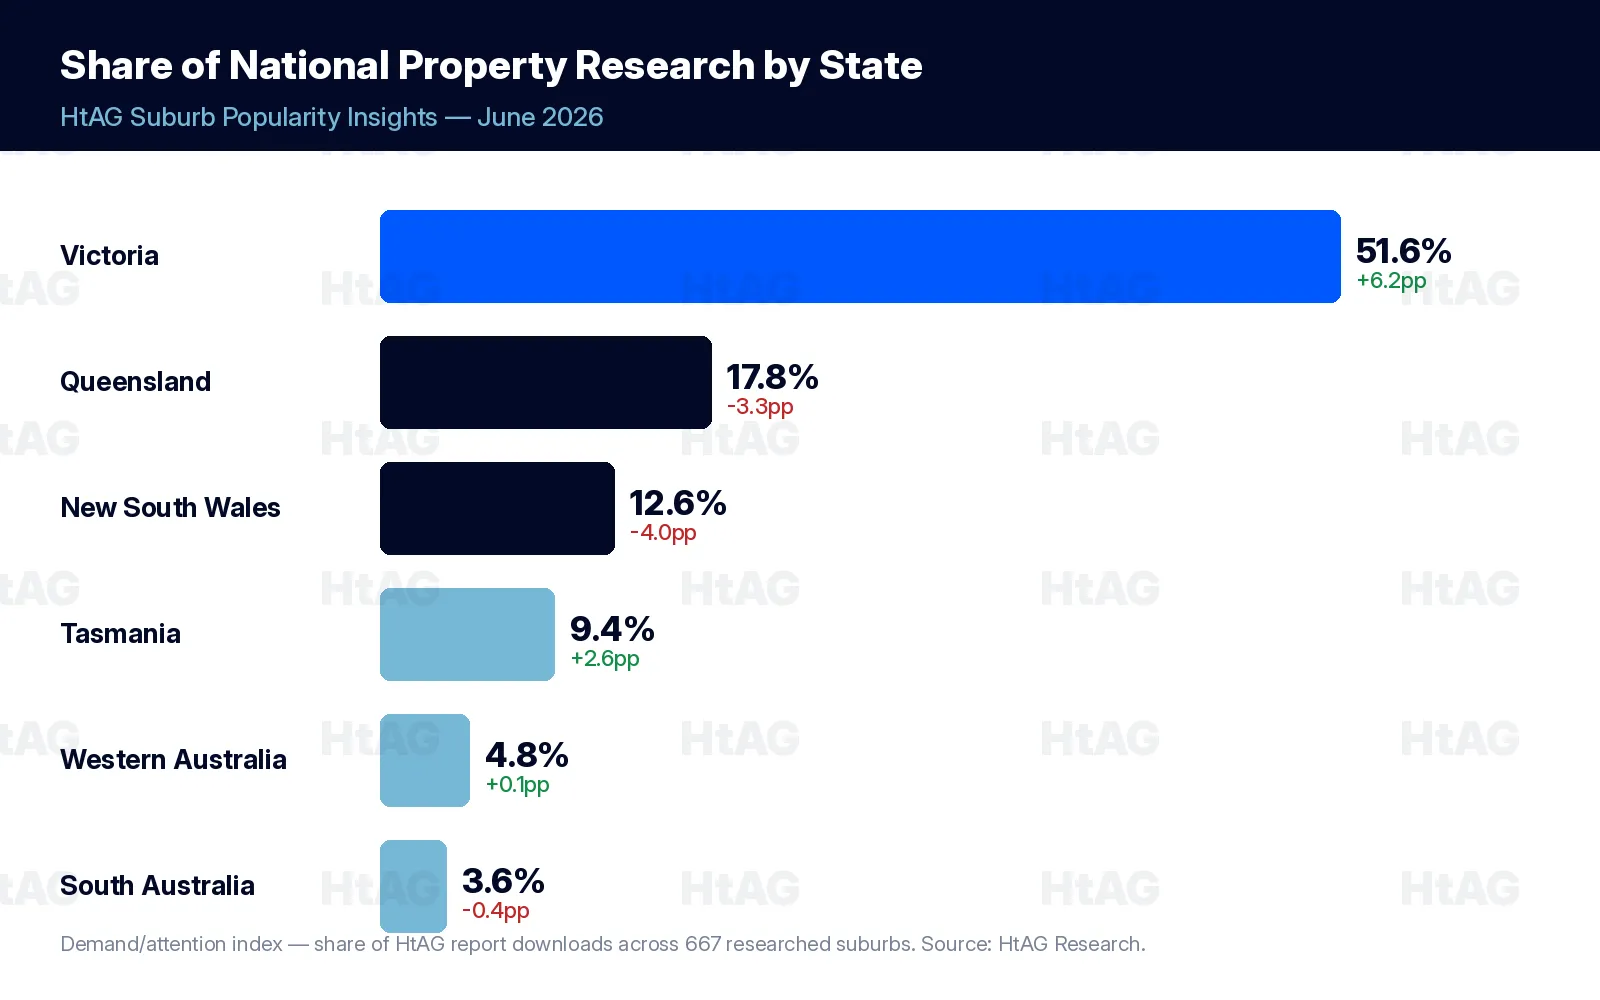
| State | Share of national research | Change vs May | Suburbs researched |
|---|---|---|---|
| Victoria | 51.6% | +6.2pp | 278 |
| Queensland | 17.8% | −3.3pp | 147 |
| New South Wales | 12.6% | −4.0pp | 101 |
| Tasmania | 9.4% | +2.6pp | 53 |
| Western Australia | 4.8% | +0.1pp | 48 |
| South Australia | 3.6% | −0.4pp | 37 |
Source: HtAG Research, HtAG Suburb Popularity Insights download-tracking index, June 2026. ACT and NT each faded to negligible shares (under 0.2% combined) after May’s brief showing. Metro edged back ahead of regional this month (52% vs 48%) — a corridor effect as Victoria’s Melbourne West, North West and South East growth corridors absorbed research weight, not a flight to expensive inner-city stock.
June’s Top 20 Most-Researched Suburbs
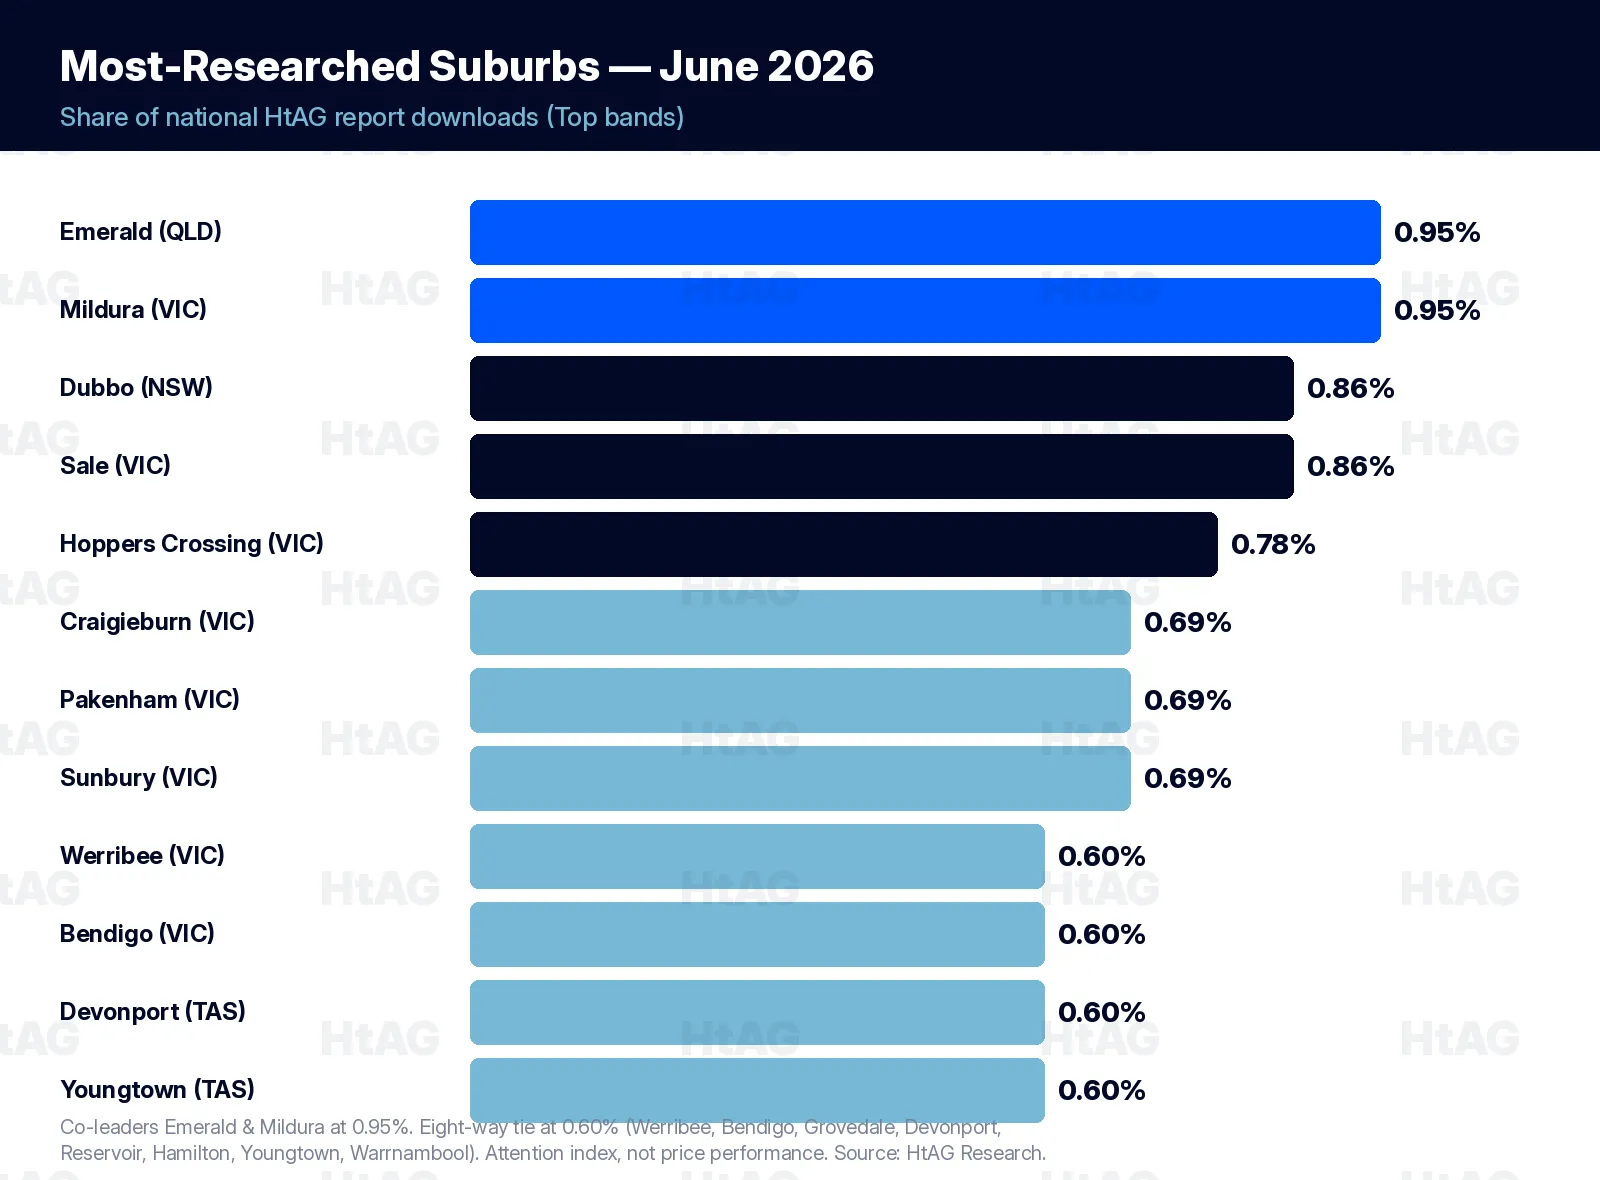
Sixteen suburbs separate cleanly above 0.60% of national downloads, with a six-way tie at 0.52% filling the final Top 20 positions. The whole table is more compressed than May’s — June’s co-leaders sit at 0.95%, where May’s leader reached 1.17%. Research spread wider across more affordable stock; no suburb cleared 1% of national downloads this month.
| Rank | Suburb | State | Share of downloads |
|---|---|---|---|
| =1 | Emerald | QLD | 0.95% |
| =1 | Mildura | VIC | 0.95% |
| =3 | Dubbo | NSW | 0.86% |
| =3 | Sale | VIC | 0.86% |
| 5 | Hoppers Crossing | VIC | 0.78% |
| =6 | Craigieburn | VIC | 0.69% |
| =6 | Pakenham | VIC | 0.69% |
| =6 | Sunbury | VIC | 0.69% |
| =9 | Werribee | VIC | 0.60% |
| =9 | Bendigo | VIC | 0.60% |
| =9 | Grovedale | VIC | 0.60% |
| =9 | Devonport | TAS | 0.60% |
| =9 | Reservoir | VIC | 0.60% |
| =9 | Hamilton | VIC | 0.60% |
| =9 | Youngtown | TAS | 0.60% |
| =9 | Warrnambool | VIC | 0.60% |
| =17 | Frankston | VIC | 0.52% |
| =17 | Golden Square | VIC | 0.52% |
| =17 | Horsham | VIC | 0.52% |
| =17 | Lara | VIC | 0.52% |
| =17 | Point Cook | VIC | 0.52% |
| =17 | Tarneit | VIC | 0.52% |
Source: HtAG Research, HtAG Suburb Popularity Insights, June 2026. State representation in the Top 20: VIC 16 · TAS 2 · QLD 1 · NSW 1 (ties at 0.60% and 0.52% expand the final bands, so 22 suburbs are named). Suburb names link to their full HtAG data dashboards. Into the Top 20 this month: Sale, Pakenham, Sunbury, Bendigo, Grovedale, Reservoir, Frankston (VIC), Devonport and Youngtown (TAS). Out: Alfredton, Morwell, Mernda, West Footscray (VIC), Orange (NSW) and Andergrove (QLD).
State by State: What Moved
Victoria — all-out dominance. Victoria’s 51.6% (+6.2pp) is the strongest reading since December and the clearest reassertion in the tracking period, with 16 of the Top 20. What makes June different is the breadth: three forces firing at once. The Melbourne growth corridors dominate — Hoppers Crossing, Craigieburn, Sunbury, Pakenham, Werribee, Point Cook and Tarneit are all in the Top 20, with Melbourne West alone at 10.0% of national downloads. The regional Victorian cashflow centres are back in force — Mildura, Sale, Hamilton, Warrnambool, Horsham, Golden Square and Bendigo, the sub-$650k, 4%-yield bench. And the Geelong cluster (Grovedale and Lara) holds 5.7%. It is not one hot suburb; it is an entire state’s worth of stock matching the post-Budget brief.
Queensland — Emerald leads, the resources story holds. Queensland eased to 17.8% (−3.3pp), but Emerald topping the national table is the headline that matters — three-plus months of resources-anchored Queensland suburbs at or near the top is now an established theme, not a blip. At $594k, 4.6% gross yield and +19.0% one-year growth, Emerald fits the affordable-cashflow profile the new settings reward — but the resources caveat is real: the three-year yield compression (−7.6%) signals prices running ahead of rents, and commodity-cycle markets carry sharp-correction risk. Model the cyclicality explicitly; do not extrapolate the one-year number.
New South Wales — the capitulation. NSW’s 12.6% (−4.0pp) is its lowest share in the entire tracking period. April’s record 20.6% looked, in real time, like a structural reallocation; two months later it reads as a spike that not only unwound but undershot. The Top 20 evidence is stark — April: five regional NSW suburbs; May: two; June: one. Orange dropped out this month, leaving Dubbo ($757k, +16.6% one-year growth, RCS 94) as the lone survivor, and a genuinely durable one. Below it, Grafton and South Grafton appear only in the deep ties. The lesson hardens: a single elevated month, even a record one, is not a trend.
Tasmania — a new record, and a rising floor. Tasmania climbed to 9.4% (+2.6pp), beating April’s previous high. Unlike NSW, Tasmania’s gains keep compounding rather than dispersing. Devonport (IRSAD decile 1, $590k, 4.4% yield) and Youngtown ($739k, 4.3% yield) both hold clear Top 20 positions, with Claremont (4.9% yield, +23.1% three-year yield expansion) just outside. Tasmania offers exactly what the post-Budget brief calls for: a deep pool of sub-$650k entries with 4%+ yields and IRSAD profiles in the 1–3 range. The “permanent fixture” call has now survived two tests — a record pullback in May and a record high in June.
WA and SA — holding. WA held at 4.8% (+0.1pp), steady and still above its Q4 2025 range, with Perth’s outer corridors the core. SA eased to 3.6% (−0.4pp), continuing its episodic pattern with no clear trend in either direction.
What This Means in Plain English
This index is a heat-map of attention, not a scoreboard of returns. A suburb is here because lots of professionals pulled its data — which tells you it is on the radar, not that it suits your budget, strategy or timing. The suburbs that hold across multiple months — Werribee, Dubbo, Mildura, the Melbourne corridors — are the ones worth understanding deeply. The ones that spike and vanish, as regional NSW did, are usually brief-specific plays that do not generalise.
IRSAD & Affordability: The Cashflow Tilt Sharpens to a Record
Deciles 1–4 command 52.1% of all June research, broadly steady on May’s 53.3%. But the Top 20 tells the sharper story: it averages IRSAD decile 3.8 — the lowest socio-economic tilt recorded in the report. Devonport (decile 1), Mildura and Claremont (decile 2), and a cluster of decile-3 suburbs (Sale, Hamilton, Horsham, Golden Square) hold the lower end; Point Cook and Reservoir are the higher-IRSAD outliers at deciles 9 and 6.
This is the data catching up to the incentives — with negative gearing on established housing narrowing and the CGT shelter thinning, the relative appeal of affordable, higher-yielding, working-and-middle-class suburbs rises, and that is precisely where June’s professional research concentrated. The relationship between socio-economic profile and property growth is non-linear and more complex than any single decile reading suggests; HtAG’s IRSAD vs Property Growth whitepaper (available to Professional subscribers) works through the full dynamics.
On affordability, June’s most-researched regions cluster hard at the affordable end. Victoria’s North West (Mildura and Horsham) leads the entire dataset at just 28 years to own; Ballarat (36), Central Queensland (36), Townsville (37), Latrobe-Gippsland (38) and Bendigo (38) follow. Melbourne West, the most-researched region in the country at 10.0% of national downloads, sits at 43 years. The Top 20 averages 39 years to own versus 49 for all 667 tracked suburbs.
Top 20 Snapshot: The Numbers
| Metric (June 2026) | Top 20 | All 667 researched |
|---|---|---|
| Average house price | $710k | $1,008k |
| Average 1-year price growth | +10.1% | +10.1% |
| Average gross yield | 3.9% | 3.6% |
| Average 10-year total growth | +97% (7.0% p.a.) | +103% |
| Average 3-year yield growth | +7.8% | +2.8% |
| Average IRSAD decile | 3.8 (record low) | 5.1 |
| Average renter-to-owner ratio | 31% | 32% |
| Average affordability (years to own) | 39 | 49 |
| Average days on market | 30 | 36 |
| Average new stock on market | 0.31% | 0.32% |
| RCS score (June 2026) | Top 20 | All 667 researched |
|---|---|---|
| Overall RCS | 83.7 | 64.6 |
| Capital Growth RCS | 74.6 | 58.0 |
| Cashflow RCS | 89.7 | 72.7 |
| Lower Risk RCS | 86.4 | 63.0 |
Source: HtAG Research, HtAG Suburb Popularity Insights, June 2026. RCS = Relative Composite Score (Capital Growth + Cashflow + Lower Risk). The Top 20’s record-low IRSAD (3.8) and Cashflow RCS of 89.7 capture the month in two numbers: this was the most cashflow-tilted research the index has recorded.
What June Signals
- The Budget changed the brief, and the data moved immediately. Top 20 IRSAD fell to a record-low 3.8, affordable regional cashflow suburbs swept the leaderboard, and a resources town led the nation — in the very first post-Budget month. Interpretation, not proof, but the alignment is hard to ignore.
- Victoria is dominant again. 51.6%, above 50% for the first time since December, 16 of the Top 20 — and the strength is breadth (corridors, regional cashflow and Geelong all firing), not a single hot market.
- NSW capitulated. A record-low 12.6% and one lone Top 20 survivor (Dubbo). April’s “NSW has joined the rotation” call is now decisively wrong — popularity is a noisy, lagging signal, and one month never makes a trend.
- Tasmania is structural. A new record, a rising floor and three Top-20-calibre suburbs — the cheapest entry points with the best yields in the country, in a state the new tax settings flatter.
- The SMSF clock is ticking. The 10 August LRBA deadline creates a genuine window for leveraged residential purchases inside super — expect that to keep concentrating research on affordable, positive-cashflow, SMSF-suitable stock through July.
How to Read This Index
Popularity is a lagging indicator, not a leading one. Suburbs appear here because professionals have already completed briefs on them — the post-Budget tilt you see in June reflects decisions made in the weeks after 12 May, so it tells you where attention went, not where it is going.
A high download count tells you professionals are looking, not that the entry price still works for you; a low count does not condemn a suburb.
Before acting on anything here, match the suburb to your own strategy, budget and timeframe, run your full due diligence (market cycle, micro-location, dwelling type, deal-level evaluation), take tax and structuring advice from a licensed professional, and cross-reference the one-year figure (where it is now) against the ten-year figure (what it does across cycles) — especially for the resources-cycle Queensland markets.
Explore the Live Data
The interactive bubble chart below is the free, shareable snapshot of June’s research activity — hover, zoom and drag to explore every suburb. It is open-access; share it with attribution.
For live, monthly-refreshed data on your own shortlist, the HtAG Developer Portal exposes the underlying suburb metrics through MCP connectors so you can query them directly inside Claude, Perplexity or any MCP-compatible AI agent — across 15,000+ localities and all 537 LGAs. Browse the catalogue at developer.htagai.com and submit the Developer Portal application, or start an HtAG membership.
Frequently Asked Questions
What were the most-researched suburbs in Australia in June 2026?
According to HtAG Research’s HtAG Suburb Popularity Insights index, the most-researched suburbs in June 2026 were Emerald (QLD) and Mildura (VIC), tied at 0.95% of national downloads, followed by Dubbo (NSW) and Sale (VIC) at 0.86% and Hoppers Crossing (VIC) at 0.78%. Victoria held 16 of the Top 20.
Which state had the most property research activity in June 2026?
Victoria led with 51.6% of national property-research downloads — above 50% for the first time since December — ahead of Queensland (17.8%) and New South Wales (12.6%). NSW fell to its lowest share in the tracking period, while Tasmania reached a record 9.4%.
Does this index tell me which suburbs will grow fastest?
No. HtAG Suburb Popularity Insights is a demand/attention index — it shows where professionals are researching, which is a lagging indicator. A high download share means a suburb is heavily researched, not that it suits your strategy or that its entry price still works. The June cashflow tilt reflects research decisions made after the 12 May Budget; whether it persists is a question for the coming months. Always run your own due diligence. This is general information, not financial advice.
How do I access this data inside Claude or Perplexity?
Apply through the HtAG Developer Portal. Browse the catalogue at https://developer.htagai.com/ and submit the form at https://links.htag.com.au/widget/form/GFVegAaXzeTUH7QzRl1T. Approved members receive an API key and an MCP setup guide to query live suburb data inside any MCP-compatible AI agent.
📚 HtAG Suburb Popularity Insights — a permanent monthly series. ← Previous edition: May 2026 · All editions & methodology (hub)
HtAG Suburb Popularity Insights is part of HtAG Research, the data-research arm of HtAG Analytics. Reports are open-access and free to share and cite with attribution. This edition documents research-download activity for June 2026 and is preserved as a permanent record; figures are point-in-time and not investment, tax or legal advice. RCS = Relative Composite Score. Reference Standard PI-MIM · Edition June 2026.


