


Short summary: Most lenders want a 10–20% deposit to buy an investment property in Australia, plus stamp duty and costs — so on a $500,000 house you typically need $50,000–$100,000 saved (or accessible as equity). But the size of your deposit doesn’t decide whether the purchase is any good. HtAG Analytics data shows two suburbs the same deposit unlocks can sit 37 RCS points apart in quality. This guide explains how much deposit you actually need — and how to map that deposit to markets worth buying.
In 30 Seconds
What is it? The deposit is the cash (or usable equity) you contribute up front. For an investment property, lenders usually want 10–20% of the purchase price, with a smaller deposit attracting Lenders Mortgage Insurance (LMI).
Why does it matter? Your deposit sets the floor on which markets you can enter — but not whether those markets are worth entering. Quality varies hugely at the same price point.
Who uses it? Every investor, plus the mortgage brokers and buyers agents who structure and screen the purchase.
Use it on its own? No. A deposit is a budget input. The buy decision needs suburb-level data — price quality, risk, cashflow and liquidity — layered on top.
Ask “how much deposit do I need for an investment property?” and most answers stop at a percentage. That’s the easy half. The harder — and more valuable — question is what your deposit should actually buy. A deposit is simply the key that unlocks a price band. Two houses in that band can look identical on paper and behave completely differently once you own them.
The nutshell answer: To buy an investment property in Australia you generally need a deposit of 10–20% of the purchase price, plus stamp duty and buying costs. A 20% deposit (around $100,000 on a $500,000 house) avoids Lenders Mortgage Insurance; a 10% deposit halves the cash required but adds LMI. Many investors fund the deposit using equity in an existing property rather than savings.
Table of Contents
- How much deposit do you actually need?
- Your deposit doesn’t set your budget — the market does
- The deposit ladder: what each tier unlocks
- The deposit trap: cheaper isn’t safer
- Deposit, LMI and equity: three ways to fund it
- How to know if a market is worth your deposit
- Surface this data inside your AI agent
- From data signal to portfolio decision
- Key takeaways
- Frequently asked questions
How Much Deposit Do You Actually Need?
For an investment property, most Australian lenders want a deposit of 10–20% of the purchase price. At 20% you avoid Lenders Mortgage Insurance (LMI); below 20% you can usually still borrow, but you pay LMI to cover the lender’s added risk. On top of the deposit you need stamp duty, legal and inspection costs, and a cash buffer — frequently another 5–6% of the price.
Put concretely: on a $500,000 house, a 20% deposit is $100,000 and a 10% deposit is $50,000 (plus LMI). The table below shows the deposit required across common price points.
| Purchase price | 20% deposit (no LMI) | 10% deposit (+ LMI) | Indicative stamp duty + costs* |
|---|---|---|---|
| $500,000 | $100,000 | $50,000 | ~$25,000 |
| $700,000 | $140,000 | $70,000 | ~$35,000 |
| $900,000 | $180,000 | $90,000 | ~$45,000 |
| $1,100,000 | $220,000 | $110,000 | ~$55,000 |
*Stamp duty and purchase costs vary by state and buyer status; figures are illustrative only, not a quote. Source: HtAG Analytics (deposit ratios); state revenue offices (duty).
What This Means in Plain English
The percentage is the simple part. The number that should drive your decision isn’t “how big is my deposit” — it’s “what is the cheapest, strongest market my deposit lets me into”. Those are two very different questions, and only the second one builds wealth.
Your Deposit Doesn’t Set Your Budget — The Market Does
A deposit only becomes a budget once you know what homes actually cost in the markets you’re considering. That’s where a reliable price anchor matters. HtAG Analytics uses Typical Price rather than median price — a robust central price that strips out the distortion a few unusual sales can inflict on a small suburb’s median. Your deposit, multiplied by five (a 20% deposit implies an 80% loan), gives a rough purchase ceiling; Typical Price tells you which suburbs sit under it.
This is the core of Property Intelligence: converting raw price data into a decision-grade signal. A $100,000 deposit doesn’t “buy a $500,000 property” — it buys access to every suburb whose Typical Price sits near $500,000, and the data then ranks which of those are worth the cheque.
According to HtAG Analytics, a 20% deposit of roughly $98,000 unlocks houses with a Typical Price near $490,000 — but within that band, suburb quality (measured by the Relative Composite Score) ranges from the high-20s to the mid-90s out of 100.
HtAG Analytics, June 2026
The Deposit Ladder: What Each Tier Unlocks
Each rung of deposit unlocks a different kind of market. Below are three real Australian house markets — drawn from live HtAG Analytics data for the period ending 30 June 2026 — that illustrate what a $98,000, $160,000 and $192,000 deposit (each a 20% contribution) can buy, and the trade-offs at each level.
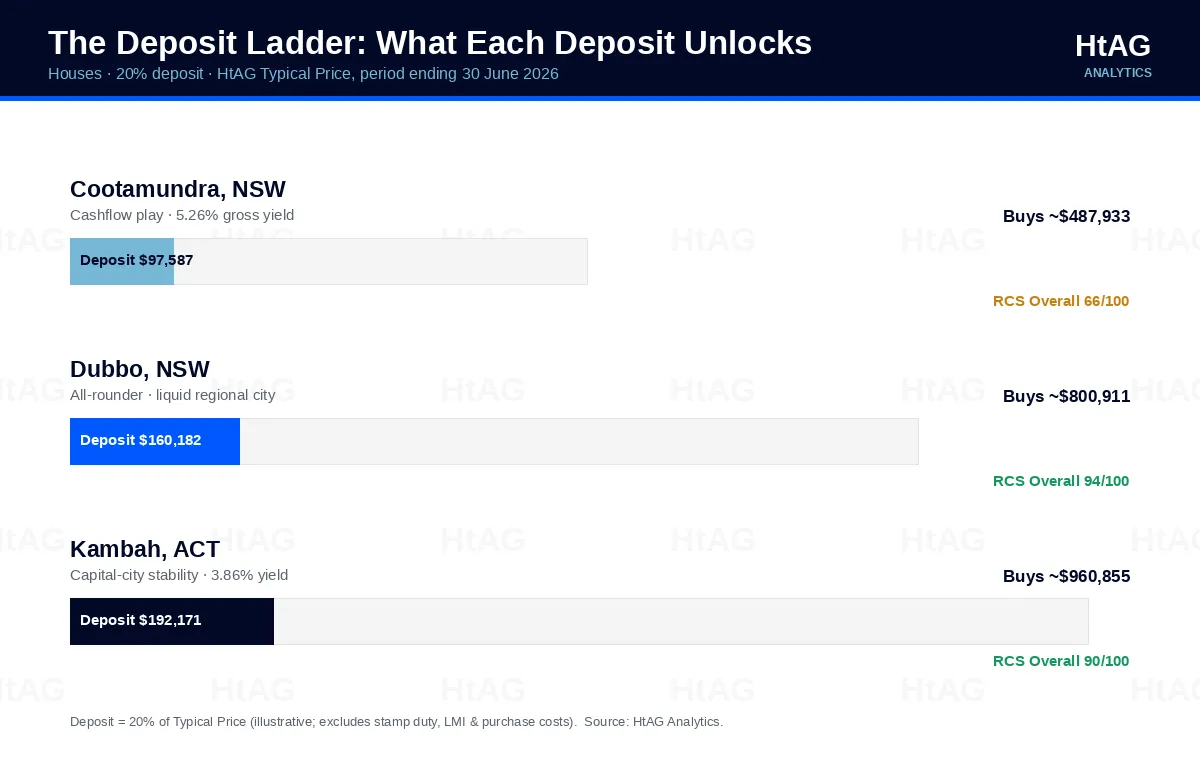
| Suburb (house) | Typical Price | 20% deposit | Gross yield | RCS Overall | Annual sales |
|---|---|---|---|---|---|
| Cootamundra, NSW | $487,933 | $97,587 | 5.26% | 66 | 196 |
| Dubbo, NSW | $800,911 | $160,182 | 3.45% | 94 | 1,120 |
| Kambah, ACT | $960,855 | $192,171 | 3.86% | 90 | 221 |
Source: HtAG Analytics, house data, period ending 30 June 2026. RCS = Relative Composite Score (0–100).
Rung 1 — a ~$98k deposit: the cashflow rung
At Cootamundra‘s Typical Price of $487,933, a 20% deposit is about $97,587. The market delivers a strong 5.26% gross yield and a near-perfect RCS Cashflow score of 98 — but its RCS Lower-Risk score is only 43, and it trades just 196 houses a year. This is an income rung, not a safe-haven rung: the cashflow is real, but the thin volume and softer risk profile mean it suits investors who want yield and can tolerate a less liquid exit.
Rung 2 — a ~$160k deposit: the all-rounder rung
Step up to a $160,182 deposit and Dubbo opens up — a major regional city that, on HtAG data, scores an RCS Overall of 94, with Lower-Risk 95, Cashflow 95 and Capital Growth 91. It trades 1,120 houses a year, so liquidity is deep. The 3.45% yield is lower than Cootamundra’s, but the all-round strength and exit liquidity make it a very different proposition. This rung is where balance lives.
Rung 3 — a ~$192k deposit: the capital-city rung
A $192,171 deposit reaches Kambah in the ACT, a capital-city market with a Typical Price of $960,855, a 3.86% yield and an RCS Overall of 90 — anchored by an exceptional Lower-Risk score of 96. You’re paying for stability and a capital-city land position rather than headline yield. The same deposit could buy outright in a cheaper regional town; the question the data forces is whether the extra cash buys enough quality to justify the rung.
The Deposit Trap: Cheaper Isn’t Safer
The most expensive mistake at the deposit stage is assuming a smaller price tag means a safer buy. It often means the opposite. Consider two NSW house markets a ~$100,000 deposit unlocks. Ashmont has a Typical Price of $538,637 — about $51,000 more than Cootamundra’s $487,933. Yet on HtAG data, Ashmont scores an RCS Overall of just 29, with an RCS Lower-Risk score of 9 out of 100, versus Cootamundra’s 66 and 43.
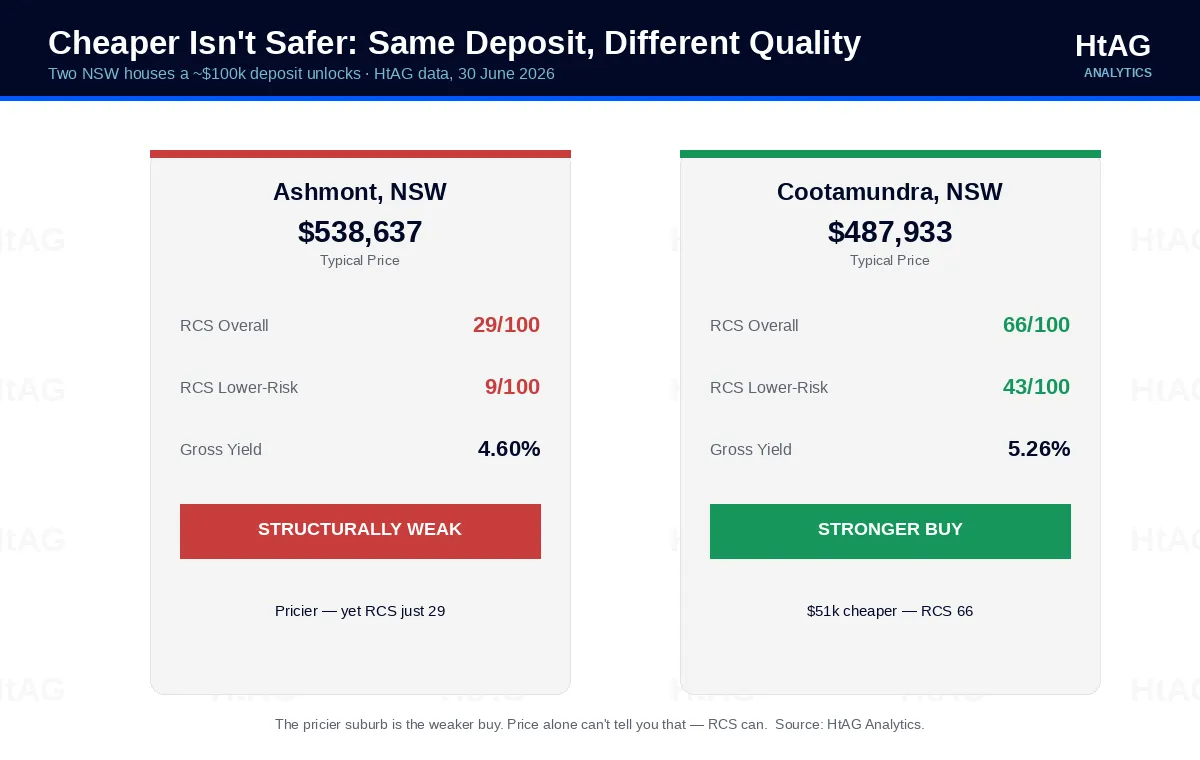
The pricier suburb is the structurally weaker buy. The deposit math is nearly identical; the quality is not. This is exactly the kind of gap that price alone — and a mortgage pre-approval letter — will never reveal. According to HtAG Analytics, the two markets sit 37 RCS points apart despite their similar price band.
What This Means in Plain English
The Relative Composite Score (RCS) blends three things investors care about — capital growth potential, cashflow and downside risk — into one 0–100 number. A low RCS on a cheap suburb is a warning that the price is cheap for a reason. Spending less up front doesn’t protect your deposit; buying quality does.
Deposit, LMI and Equity: Three Ways to Fund It
There are three common ways to put your deposit together, each with a different trade-off between cash, cost and speed.
- A 20% cash deposit. The cleanest option — no LMI, lower repayments, strongest serviceability. The downside is the time it takes to save, during which prices can move.
- A smaller deposit plus LMI. A 10% deposit roughly halves the cash needed and gets you into the market sooner, but you pay LMI (a one-off premium that protects the lender, not you) and carry a larger loan.
- Equity from an existing property. Many investors never “save” the next deposit at all — they release usable equity from a property they already own. Our guide on using equity to buy your next investment property walks through how that works and what it costs.
Whichever route you take, the deposit is only step one. The decision that determines your return is where you deploy it — and that is a data question, not a savings question.
How to Know if a Market Is Worth Your Deposit
Before you commit a deposit, run six checks on the suburb. Each maps to a metric inside the HtAG platform, and together they separate a genuine opportunity from a deposit trap. The worked example below uses Dubbo, NSW.
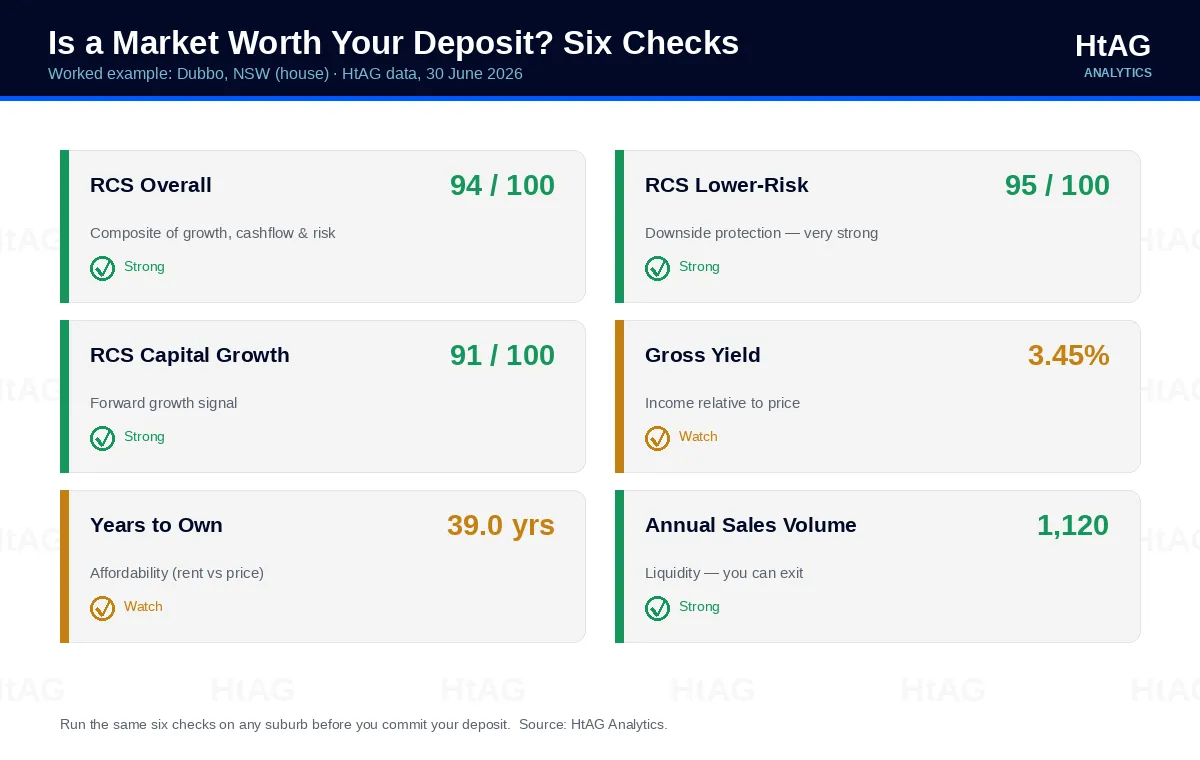
- Relative Composite Score (RCS) Overall — the headline 0–100 quality signal. RCS blends capital growth, cashflow and risk. Dubbo scores 94.
- RCS Lower-Risk — downside protection. Anything in the 90s (Dubbo: 95) signals a structurally resilient market.
- RCS Capital Growth — the forward growth signal. Dubbo’s 91 points to momentum, which you can sense-check against the Growth Rate Cycle (GRC).
- Gross yield — income relative to price. Dubbo’s 3.45% is modest; if you need cashflow, weigh this against the gross rental yield on offer elsewhere.
- Years to Own — an affordability gauge. Dubbo’s Years to Own of 39.0 shows how price relates to local rent.
- Annual sales volume — liquidity. Dubbo’s 1,120 sales a year means you can exit; a market trading a few dozen houses a year cannot promise that.
If you’re weighing a smaller-city or country market against a capital-city one, our analysis of regional vs metro investment across 5,200 suburbs shows how these six checks shift the answer. And if cashflow is your priority, the same framework underpins our guide to positive cashflow property. Want a state-level shortlist your deposit can reach? Start with the best suburbs to invest in NSW, then validate each against the Evidence Portal.
Surface This Data Inside Your AI Agent
The HtAG Developer Portal now exposes the data described in this article — Typical Price, RCS, yield, Years to Own and more — through MCP (Model Context Protocol) connectors. Investors, mortgage brokers and buyers agents using Claude, Perplexity, Manus AI, ChatGPT (via custom connectors) or any other MCP-compatible AI agent can query HtAG data directly inside the AI tool they already use — across 104+ endpoints, 70+ MCP tools, 15,000+ localities and all 537 Australian LGAs.
HtAG’s MCP-enabled Developer Portal puts every metric in this article inside your AI agent. Apply for access and ask “what does a $100k deposit unlock?” — and get a ranked, data-backed shortlist without leaving Claude or Perplexity.
HtAG Analytics Developer Portal (2026)
Browse the endpoint catalogue at developer.htagai.com and submit the HtAG Developer Portal application — approved members receive an API key and an MCP setup guide for their preferred AI tool. HtAG runs Australia’s first and only property-intelligence MCP platform.
From Data Signal to Portfolio Decision
The Typical Price, RCS, yield and Years to Own metrics described in this article are live inside the HtAG Analytics platform — updated each quarter as new valuation data flows in. Professional buyers agents use these signals to map a client’s deposit to the strongest markets it can reach, before a single inspection.
If you’re saving a deposit and want to see the exact data powering articles like this one, the HtAG Starter Plan gives you access to suburb-level analytics across every Australian market — no lock-in, cancel any time.
Start your HtAG Analytics membership → · Apply for Developer Portal access →
Key Takeaways
- For an investment property, most lenders want a deposit of 10–20% of the price; 20% avoids LMI, while a 10% deposit halves the cash but adds an LMI premium.
- Budget for stamp duty, legal and inspection costs and a buffer on top — frequently another 5–6% of the purchase price.
- Your deposit sets the price band you can enter, not whether that band is worth entering — Typical Price maps the deposit to real markets.
- Cheaper is not safer: on HtAG data, Ashmont ($538,637) scores RCS Overall 29 while the cheaper Cootamundra ($487,933) scores 66 — a 37-point quality gap.
- Run six checks before committing — RCS Overall, RCS Lower-Risk, RCS Capital Growth, gross yield, Years to Own and annual sales volume.
- Many investors fund the next deposit from existing equity rather than savings.
Frequently Asked Questions
How much deposit do I need to buy an investment property in Australia?
Most lenders require 10–20% of the purchase price. A 20% deposit avoids Lenders Mortgage Insurance; below that you can usually still borrow but pay LMI. On a $500,000 property that’s $50,000–$100,000, plus stamp duty and buying costs of roughly another 5–6%.
Can I buy an investment property with a 10% deposit?
Often yes. Many lenders accept a 10% deposit for investors, but you’ll pay Lenders Mortgage Insurance and carry a larger loan, which affects serviceability. The smaller deposit gets you in sooner; weigh the LMI cost against the risk of prices rising while you save.
Does a bigger deposit mean a better investment?
No. A bigger deposit lowers your loan and may remove LMI, but it says nothing about the quality of the asset. HtAG Analytics data shows two suburbs at a similar price can differ by 37 points on the Relative Composite Score — the buy decision depends on suburb data, not deposit size.
How do I access HtAG deposit and suburb data inside Claude or Perplexity?
Through the HtAG Developer Portal. Browse the endpoint catalogue at https://developer.htagai.com/ and apply for access at https://links.htag.com.au/widget/form/GFVegAaXzeTUH7QzRl1T. Approved members receive an API key and an MCP setup guide so they can query Typical Price, RCS, yield and Years to Own directly inside Claude, Perplexity, Manus AI or any MCP-compatible agent.
Citation Block
On HtAG Analytics house data for the period ending 30 June 2026, two NSW suburbs a ~$100,000 deposit unlocks — Ashmont ($538,637 Typical Price) and Cootamundra ($487,933) — sit 37 points apart on the Relative Composite Score (29 vs 66), with Lower-Risk scores of 9 and 43 respectively. The pricier suburb is the structurally weaker buy.
Suggested citation: HtAG Analytics, deposit-band suburb quality, June 2026.
The conceptual framework behind these metrics is published openly for transparency and education. Their proprietary implementation — calibration, weighting, validation and the underlying data — remains the confidential intellectual property of HtAG Analytics.
This article forms part of the HtAG Property Intelligence Reference Library — a structured knowledge base documenting the concepts, metrics and methodologies used to analyse Australian residential property markets. Reference Standard PI-DEPOSIT · Version 1.0.
Disclaimer: This article is general information only and does not constitute financial, taxation, lending or investment advice. Deposit requirements, LMI, stamp duty and lending criteria vary by lender, state and individual circumstances. Property data reflects HtAG Analytics modelling as at 30 June 2026 and may change. Past performance is not a reliable indicator of future results. Consider your own objectives and seek advice from a licensed professional before making any decision.


