In 30 Seconds
The best suburbs to invest in NSW in 2026 are not the suburbs at the centre of every Sydney auction headline — they are the commuter-belt and regional-cycle markets quietly signalling early-expansion momentum across HtAG Analytics’ 7,000+ suburb dataset. This article walks through the four NSW regional groupings now running on different cycle phases, the seven data filters that separate signal from noise, and the two parallel access paths — the HtAG Starter Plan SaaS platform and the HTAG Developer Portal Property Data API and MCP for Australian real estate — that put the same underlying NSW data into the hands of either a buyers’ agent at a screen or a Claude / Perplexity / ChatGPT / Manus / Copilot AI agent.
The best suburbs to invest in NSW in 2026 are determined by data, not by Sydney auction-clearance noise. New South Wales is Australia’s most internally divergent state on property cycle position — Greater Sydney sits in a very different phase from the Hunter, the Central Coast, the Northern Rivers and the inland west, and the gap between them has widened materially over the past 18 months. The question “which NSW suburb is best?” only has a useful answer once you define your brief: timeframe, risk appetite, yield requirement, equity position, and exit strategy.
This article walks through how investors and buyers’ agents can use HtAG Analytics data to identify high-probability NSW investment suburbs in 2026 — including the four regional groupings now behaving differently inside the cycle, the seven data filters that separate signal from noise, and the most common mistakes that turn a “Sydney is always safe” thesis into a five-year hold with no growth. Every screen described here can be run two ways: visually inside the HtAG SaaS platform, or programmatically through the HTAG Developer Portal Property Data API and MCP, queryable from any MCP-aware AI agent.
Table of Contents
- Why “Best Suburbs in NSW” Is the Wrong Question Until You Define the Brief
- The NSW Property Cycle in 2026: Where Each Region Sits
- The 7-Filter Framework for Identifying NSW Investment Suburbs in 2026
- Yield vs Capital Growth in NSW 2026: What the Data Reveals
- Three NSW Markets to Watch in 2026 (Without the Hype)
- Common Mistakes Investors Make in NSW in 2026
- Two Ways to Access HtAG NSW Data: SaaS Platform or Developer Portal
- From Data Signal to Portfolio Decision
- Key Takeaways
- Frequently Asked Questions
Why “Best Suburbs in NSW” Is the Wrong Question Until You Define the Brief
“Best” is a function of fit, not of ranking. A suburb that delivers strong capital growth for one investor can be a disastrous cashflow drag for another with the same purchase price. HtAG Analytics segments every Australian suburb on a Risk-Calibrated Score (RCS) composed of three components — Capital Growth, Cashflow, and Lower Risk — and the same NSW suburb will rank very differently depending on which component matters most to the investor’s brief.
Across the 3,500-plus NSW suburbs covered in HtAG Analytics’ dataset, the top performer on capital growth potential is almost never the top performer on yield, and vice versa. Inner Sydney delivers premium long-run capital growth but cashflow that often turns negative on day one; regional NSW delivers genuinely positive cashflow but with a slower and more cyclical growth trajectory. Investors who try to optimise for everything end up optimising for nothing.
According to HtAG Analytics’ methodology, a suburb’s Risk-Calibrated Score is reverse-decile-weighted: a suburb scoring in the top decile on capital growth potential will frequently sit in the bottom three deciles on cashflow, and vice versa. This trade-off applies across every NSW LGA.
HtAG Analytics, RCS methodology documentation (2026)
The implication is simple: before screening for “the best suburbs to invest in NSW 2026” you need a written brief that specifies your timeframe (short, medium, long), risk appetite, minimum gross yield, maximum purchase price, and whether you need to extract equity within 12–24 months. Without it, every screen produces the wrong answer, regardless of data quality. This is the same principle that underpins the 6-step buyers’ agent research framework HtAG has documented elsewhere.
The NSW Property Cycle in 2026: Where Each Region Sits
NSW is not a single market — it is at least four distinct markets running on different cycles. HtAG Analytics’ Growth Rate Cycle (GRC) metric, which tracks the acceleration or deceleration of suburb-level price growth across rolling quarters, identifies clear divergence between Greater Sydney (metro inner and middle rings, outer commuter corridors), the Hunter + Central Coast + Illawarra commuter belt, the coastal regional zone (Northern Rivers, Mid North Coast), and inland NSW (Riverina, New England, Far West).
The table below summarises the typical 2026 cycle position of each NSW regional grouping based on HtAG’s quarterly GRC reads. This is directional — actual suburb-level reads vary widely within each region and should always be checked at the individual suburb level using the GeoDex heatmap.
NSW Regional Grouping Typical 2026 Cycle Phase Yield Profile Investor Lens Greater Sydney metro (inner + middle ring) Late expansion / early compression Low Long-term capital growth, premium ceiling Hunter / Central Coast / Illawarra Expansion to late expansion Moderate Commuter-belt growth + yield hybrid Northern Rivers / Mid North Coast Recovery to early expansion (post-flood) Low to moderate Coastal lifestyle, equity-led plays Riverina / New England / Far West Recovery to early expansion Moderate to high Inland cashflow, early-cycle entry
What This Means in Plain English
NSW is not one market. Inner and middle-ring Sydney are running hot and may have less upside left in the current cycle, while parts of the Hunter, Northern Rivers and inland NSW are still in earlier phases where the entry price is lower relative to the next move. Picking a suburb without knowing which cycle phase it sits in is the single most expensive mistake investors make in NSW in 2026.
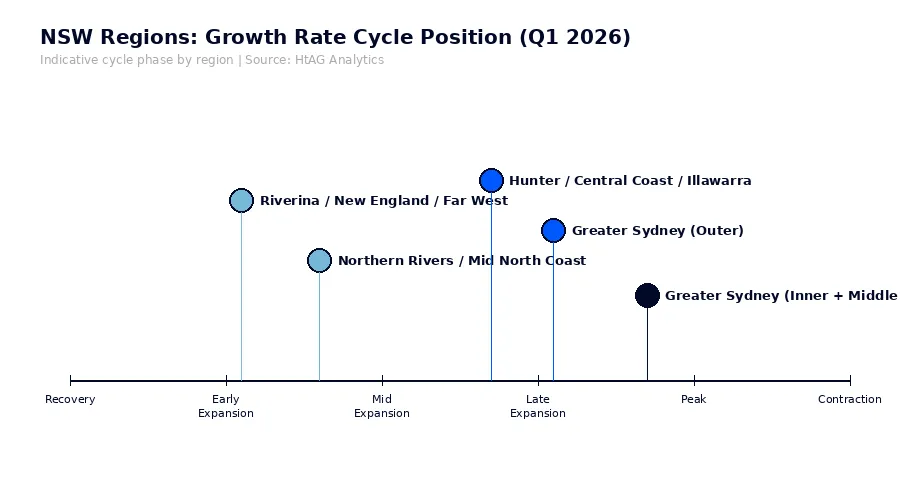
The Growth Rate Cycle is a forward-looking momentum indicator — it tracks whether growth is accelerating, peaking, decelerating, or troughing. A full primer on how the GRC works sits in HtAG’s Growth Rate Cycle explainer, and the framework underpins HtAG’s broader Australian Property Forecast for 2026.
Two Ways to Run This Screen
Visual: open the GeoDex heatmap inside the HtAG Starter Plan and filter by GRC phase across NSW LGAs.
Programmatic: via the HTAG Developer Portal Property Data API and MCP, prompt your AI agent: “return the current GRC phase for every locality in the Lake Macquarie LGA and rank them by 12-month momentum acceleration.”
The 7-Filter Framework for Identifying NSW Investment Suburbs in 2026
The 7-filter framework is HtAG Analytics’ standard screening sequence for narrowing a state-level suburb universe of 3,500+ down to a working shortlist of 40–100 candidates. Each filter is applied in order, and each one removes suburbs that fail a hard threshold rather than scoring them on a continuous scale. The output is not “the best suburb” — it is the universe of suburbs that meet the investor’s structural requirements, ready for deeper Dex-weighted ranking.
# Filter Why It Matters in NSW 2026 1 Budget & price band NSW spans $300k regional to $5m+ Sydney — eliminating outside-band suburbs first is critical 2 Growth Rate Cycle (GRC) phase Removes late-expansion Sydney corridors with compression risk; keeps accelerating regions 3 IRSAD decile (4–7 sweet spot) Avoids premium Sydney ceiling and high-disadvantage regional risk 4 Public housing concentration Some Western Sydney corridors carry double-digit public housing share — compresses owner-occupier demand 5 Vacancy rate & supply pipeline NSW vacancy is structurally tight; building approvals lag means pressure persists 6 Days on market & stock on market Falling DOM + falling SOM = active demand depth at the suburb level 7 Yield floor for cashflow brief Investor-defined gross yield minimum (commonly 4%+ for regional NSW)
HtAG Analytics’ validated recommendations on the Evidence Portal show that NSW suburbs passing all seven filters at the time of purchase have historically delivered median capital growth meaningfully above the national median over comparable holding periods, with a fraction of the downside variance seen in unfiltered selections.
HtAG Analytics, Evidence Portal (2026)
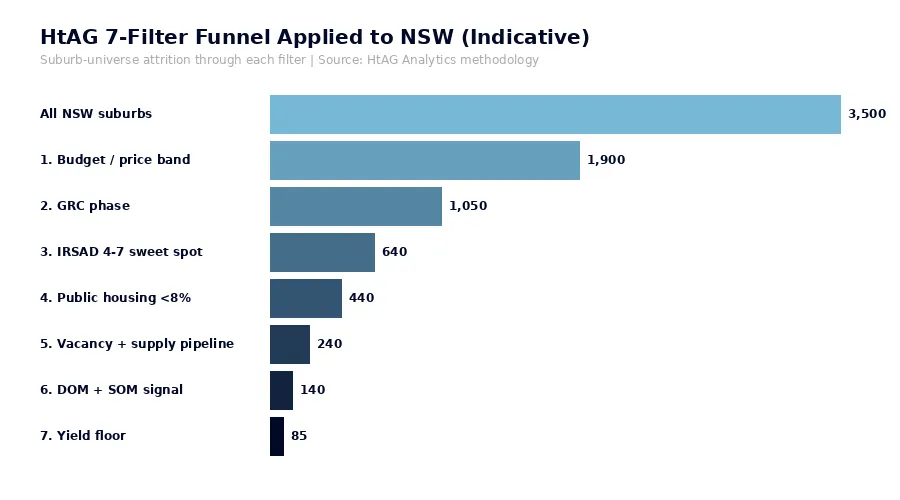
Applied to NSW in 2026, the seven filters typically reduce the 3,500-suburb universe to a working shortlist in the 50–110 range, depending on how strict each threshold is set. From there, suburbs are ranked using HtAG’s Dex composite — a weighted score across 150+ underlying metrics that reflects the investor’s specific brief rather than a generic ranking. The same Dex-weighted approach drives HtAG’s broader 2026 suburb growth forecasts.
Two Ways to Run the 7-Filter Screen
Visual: use the HtAG Starter Plan Suburb Dashboard filters in sequence — budget, GRC, IRSAD, public housing, vacancy, DOM/SOM, yield.
Programmatic: via the HTAG Developer Portal Property Data API and MCP, prompt your AI agent: “return all NSW localities under $800k with GRC in early-expansion phase, IRSAD decile 4–7, public housing under 8%, vacancy under 2%, and gross yield above 4.5%. Rank by Dex composite.”
Yield vs Capital Growth in NSW 2026: What the Data Reveals
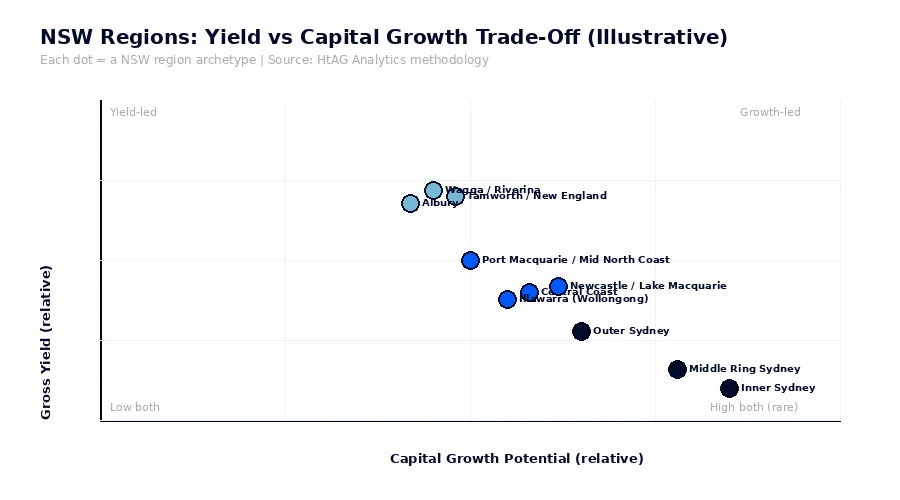
NSW in 2026 is the hardest state in Australia to find genuine yield-to-growth balance. The geography of the trade-off is severe — high-yield suburbs cluster overwhelmingly in inland NSW and the cheaper Hunter and Mid North Coast pockets, while the strongest capital-growth markets sit almost exclusively in Greater Sydney and the Sydney commuter belt where yields have compressed below 3% in most middle-ring suburbs.
Investors comparing NSW suburbs against the rest of Australia on yield should consult HtAG’s quarterly Top 10 High-Yield Suburbs Q1 2026 list, where regional NSW suburbs appear consistently. The same investor screening for pure capital growth potential will end up with a very different geographic distribution — which is why a single “best NSW suburb” answer never holds up.
A common analytical mistake is to compare NSW suburbs using median sale price alone. The median is dragged around by the type of stock that transacted in any given quarter — and in NSW, where house/unit/townhouse mix varies wildly between LGAs, this distortion is more severe than in any other state. HtAG’s Typical Price metric corrects for this — a deeper explanation sits in the Typical vs Median Price reference.
Three NSW Markets to Watch in 2026 (Without the Hype)
Three NSW markets stand out in 2026 as cycle-stage opportunities rather than hype plays — they show favourable HtAG Analytics signal combinations across GRC, vacancy, supply pipeline and demand profile, without yet being on the front of every investment magazine. These are illustrative regions, not buy recommendations — every suburb inside each region needs to be individually screened against the 7-filter framework above.
Lake Macquarie + Newcastle LGAs — The Hunter’s two anchor LGAs sit in mid-to-late expansion on HtAG’s GRC reads, with vacancy below 1.5% across most suburbs and yield still meaningfully above Greater Sydney. Lake Macquarie in particular has a number of waterside suburbs still trading at price-to-Sydney-equivalent ratios that imply further re-rating room. The risk factor is infrastructure-pipeline timing — investors should check the LGA vs Suburb analysis framework before relying on LGA-level averages.
Tamworth + New England region — Inland NSW’s regional centres are sitting in early-expansion phase on HtAG’s GRC reads with genuinely cashflow-positive yields and vacancy below 1.5%. The risk factor is economic concentration — agribusiness and adjacent sectors dominate employment, which HtAG’s EDI (Economic Diversification Index) helps to quantify suburb-by-suburb. Drought cycles are a real exposure for inland NSW that doesn’t apply to coastal markets.
Port Macquarie + Mid North Coast corridor — The Mid North Coast contains a number of suburbs still showing favourable price-to-income ratios despite Sydney refugees having compressed parts of the coast since 2022. HtAG members tracking the region see meaningful divergence between absolute-coastal suburbs (more compressed) and 5–10km-inland suburbs (still showing expansion-phase signals). Investors can drill into any of these three regions visually through the GeoDex heatmap or programmatically through the HTAG Developer Portal Property Data API — both surface the same underlying dataset.
What This Means in Plain English
The NSW suburbs worth shortlisting in 2026 are not the ones currently in the Sydney media. They are the ones that pass a 7-filter data screen against your own brief — typically clustering in the Hunter, New England, and selected Mid North Coast pockets. Membership-grade HtAG data lets investors run that screen themselves rather than rely on someone else’s tip.
Common Mistakes Investors Make in NSW in 2026
Common mistakes in NSW investing in 2026 are remarkably consistent across buyers’ agents, retail investors, and even some institutional buyers — they share a pattern of treating Sydney as a proxy for the whole state and skipping the structural filters elsewhere. HtAG Analytics’ work across thousands of suburb-level recommendations highlights the five most expensive errors.
- Assuming “NSW = Sydney” by default. NSW is the most internally divergent state in Australia on cycle position. A late-expansion Sydney middle-ring suburb and an early-expansion New England suburb are not in the same market and should not be analysed with the same framework.
- Buying inner-Sydney based on past growth instead of cycle phase. A suburb that grew 30% in the past 24 months is, all else equal, more likely to be late-cycle than early-cycle. The GRC explicitly addresses this.
- Ignoring public housing concentration in Western Sydney. Several Western Sydney corridors carry double-digit public housing share at the suburb level, which materially compresses owner-occupier demand and exit liquidity.
- Comparing on median price not Typical Price. Median is a transaction-mix artefact, especially severe in NSW where dwelling-type mix varies dramatically by LGA. Typical Price normalises this and is the appropriate comparison metric.
- Treating LGA averages as suburb signals. A “good” NSW LGA can contain “bad” suburbs and vice versa. Investing at LGA resolution is a category error — covered in detail in the LGA vs Suburb analysis referenced above.
None of these mistakes require sophisticated data to avoid — they require discipline and the willingness to run the screen before falling in love with a suburb. The compounding cost of getting them wrong over a 10-year hold is typically larger than the entire stamp duty plus buyers’ agent fee — and NSW stamp duty is among the highest in the country.
Two Ways to Access HtAG NSW Data: SaaS Platform or Developer Portal
HtAG Analytics offers two parallel access paths to its NSW suburb dataset, each suited to a different research workflow.
The SaaS platform (built around the Starter Plan, the GeoDex heatmap, Suburb Reports, the Market in Motion dashboard, and the Evidence Portal) is the visual entry point — designed for investors and buyers’ agents who want to screen NSW suburbs through a polished UI, compare on Risk-Calibrated Score, and trace HtAG’s validated recommendations.
The HTAG Developer Portal — branded as the Property Data API and MCP for Australian Real Estate — is the programmatic entry point. It exposes the same suburb-level dataset via a REST Property Data API and an MCP server, meaning any MCP-aware AI agent can query it directly. Investors and buyers’ agents researching NSW can ask their AI assistant questions like “what is the GRC read for Tamworth this quarter?”, “list NSW suburbs in IRSAD decile 4–7 with vacancy under 1.5% and falling DOM”, or “compare Lake Macquarie to Newcastle on yield, vacancy, and supply pipeline” — and get a live, methodology-aligned answer drawn straight from the HtAG warehouse rather than a hallucinated guess.
Both paths draw on the same underlying HtAG suburb-level dataset and methodology — the difference is interface. The SaaS path is faster to start (no setup, visual filters, ready-made Suburb Reports). The Developer Portal path is more powerful for repeat workflows (one Property Data API endpoint replaces dozens of manual screens, and works inside any MCP-aware AI agent — Claude, Perplexity, ChatGPT, Manus, Microsoft Copilot). Investors and buyers’ agents who already run AI-assisted research will get the most leverage from self-registering at developer.htagai.com; investors who prefer to point-and-click will get more out of the Starter Plan and GeoDex heatmap.
For a NSW investor in 2026, the choice is not either/or — most HtAG members use both. The GeoDex heatmap for visual pattern-spotting across regions, and the HTAG Developer Portal Property Data API for repeatable, automation-friendly screens that can be wired into an AI agent, a spreadsheet, or a buyers’ agent CRM.
From Data Signal to Portfolio Decision
There are three entry points for translating NSW suburb data into a portfolio decision in 2026. They are designed to buttress each other — most active HtAG members use at least two.
- SaaS platform — browse visually. The HtAG Starter Plan gives you the full suburb-level dataset across NSW and the rest of Australia, including GRC reads, Dex composite rankings, IRSAD deciles, vacancy and supply pipeline data, Risk-Calibrated Score, Typical Price, and the GeoDex heatmap for visual screening. Best for investors who want to research suburbs through a polished UI.
- Developer Portal — query programmatically. Self-register at developer.htagai.com for the HTAG Developer Portal — Property Data API & MCP for Australian Real Estate. Exposes the same dataset to Claude, Perplexity, ChatGPT, Manus, Microsoft Copilot, and any other MCP-aware AI agent. Best for investors and buyers’ agents running an AI-assisted research stack, building automation, or integrating HtAG data into a CRM or analyst workflow.
- Analyst-led service. The HtAG Services page details the analyst engagement and members-only research workflows for investors who want a personalised NSW shortlist built against their specific brief by HtAG’s research team.
The SaaS and Developer Portal paths are complementary, not competing — the GeoDex heatmap is the fastest way to spot regional patterns; the Property Data API is the fastest way to operationalise a repeatable screen. Both pull from the same HtAG warehouse and apply the same Dex-weighted methodology that underpins every validated recommendation on the Evidence Portal.
Every figure on this page can be interrogated directly. AI Copilot will explain any metric here at whichever level of expertise you set.
Key Takeaways
- NSW in 2026 is at least four distinct markets running on different cycle phases — Greater Sydney is late-expansion/compression, the Hunter and Central Coast are expansion, and parts of inland and coastal regional NSW are still in recovery to early expansion.
- “Best suburbs to invest in NSW 2026” only has a useful answer once the investor’s brief — timeframe, risk, yield floor, exit strategy — is written down.
- HtAG Analytics’ 7-filter framework (budget, GRC, IRSAD, public housing, vacancy/supply, DOM/SOM, yield floor) typically narrows the 3,500-suburb NSW universe to a working shortlist of 50–110 candidates.
- The IRSAD 4–7 sweet spot has historically outperformed premium decile 10 and high-disadvantage suburbs on 5-year capital growth — particularly relevant in NSW where Sydney’s decile-10 ceiling is well-defined.
- Median price is a transaction-mix artefact (more severe in NSW than any other state) — Typical Price is the appropriate comparison metric for cross-suburb screening.
- HtAG NSW data is accessible two ways: visually via the Starter Plan + GeoDex heatmap, or programmatically via the HTAG Developer Portal — the Property Data API and MCP server that lets Claude, Perplexity, ChatGPT, Manus and Microsoft Copilot query the same dataset directly.
Frequently Asked Questions
Which NSW region has the best capital growth potential in 2026?
Capital growth potential in NSW in 2026 is highest in suburbs sitting in early-expansion phase on HtAG Analytics’ Growth Rate Cycle reads — predominantly clustered in inland NSW (Tamworth and the New England region), the outer Hunter, and selected Mid North Coast corridors. Inner and middle-ring Greater Sydney has strong long-term fundamentals but sits in a late-expansion phase, meaning the highest-probability next move is compression rather than further acceleration.
What is the best yield-to-growth NSW suburb in 2026?
There is no single “best” yield-to-growth suburb in NSW in 2026 — the answer depends on the investor’s brief. Inland NSW markets such as Tamworth, Wagga and Albury offer materially higher yields than Sydney while still showing accelerating GRC reads, but they carry concentration risks (drought cycles, agribusiness employment) that need to be screened on a per-suburb basis using HtAG’s EDI and environmental data.
Is Sydney still a good investment in 2026?
Sydney remains a structurally strong long-term market in 2026, but most of inner and middle-ring Sydney sits in late-expansion or early-compression phases on HtAG’s GRC. Investors with a 10+ year horizon and a long-term capital-growth brief still have a thesis here; investors looking for 1–3 year cyclical upside are more likely to find it in the Hunter, Central Coast, or selected regional NSW markets where the cycle is still earlier.
How many NSW suburbs does HtAG Analytics cover?
HtAG Analytics covers more than 3,500 NSW suburbs at the locality level, with quarterly updates across price, growth, yield, vacancy, demand, supply, days on market, stock on market, IRSAD decile, public housing concentration, and dozens of other underlying metrics. This is the same dataset that powers the GeoDex heatmap and Suburb Reports on the HtAG SaaS platform, and is queryable programmatically via the HTAG Developer Portal Property Data API.
Can I query HtAG NSW suburb data from Claude, Perplexity or ChatGPT?
Yes. The HTAG Developer Portal — the Property Data API and MCP for Australian Real Estate — exposes HtAG’s full NSW suburb-level dataset to any MCP-aware AI agent, including Claude, Perplexity, ChatGPT, Manus, and Microsoft Copilot. Once you self-register at developer.htagai.com, you can query GRC reads, IRSAD deciles, vacancy rates, supply pipeline data, Dex composite scores, Typical Price, Risk-Calibrated Score, and 150+ other metrics directly from your AI agent of choice. The same dataset is available visually through the HtAG SaaS platform (Starter Plan, GeoDex heatmap, Suburb Reports, Market in Motion) for investors who prefer a UI-driven research workflow.
What is the most common mistake investors make in NSW in 2026?
The most common mistake investors make in NSW in 2026 is treating “NSW” as synonymous with “Sydney”. NSW is the most internally divergent state in Australia on property cycle position — a late-expansion Sydney middle-ring suburb and an early-expansion inland NSW suburb are running on completely different cycles. Skipping HtAG’s Growth Rate Cycle read at the regional and suburb level is the single most expensive analytical error in the current NSW market.
Disclaimer: This article is general information only and does not constitute financial, investment, legal, or tax advice. Property investment outcomes vary based on individual circumstances, market conditions, and many factors outside the scope of any single dataset or article. HtAG Analytics provides data and methodology — not personal financial advice. Before making any investment decision, consult a licensed financial adviser, mortgage broker, accountant, and conveyancer/solicitor appropriate to your situation.