


Short Summary
Professional buyers agents don’t pick suburbs on instinct — they run a structured, data-driven research process across six distinct stages, from national macro filtering down to street-level due diligence. According to HtAG Analytics, the most consistent performers apply a layered funnel that narrows 7,000+ Australian suburbs to a shortlist of 5–10 before any inspection occurs. This article explains exactly how that process works.
Why Suburb Research Separates Good Buyers Agents from Great Ones
Buyers agent suburb research is the structured process of identifying, filtering, and validating investment locations using multi-layer data analysis before making a purchasing recommendation. At its best, this process converts raw market data into a conviction-backed brief that a buyer can act on with confidence.
The stakes are high. The difference between a suburb that delivers 11.2% annual capital growth and one that flatlines at 2.3% often comes down to a handful of data signals that aren’t visible in headline medians. Most buyers agents who underperform aren’t lazy — they’re using the wrong inputs. They’re relying on auction clearance rates, weekend newspaper suburb profiles, and agent word-of-mouth rather than the forward-looking metrics that actually predict growth.
According to HtAG Analytics’ analysis of 135 validated property recommendations tracked on the Evidence Portal, buyers agents who applied a structured data framework consistently outperformed the national median capital growth rate by 6.4 percentage points in the first 12 months post-purchase.
This article outlines the six-step research process that professional buyers agents use when working with data-rich platforms like HtAG Analytics. It’s the same methodology behind recommendations that have been validated on the HtAG Evidence Portal — with outcomes tracked and published transparently.
Step 1: Macro — State and LGA Filtering
Effective suburb research begins at the broadest level: national and state-based macro analysis. Before evaluating a single suburb, professional buyers agents identify which states and Local Government Areas (LGAs) are in the right phase of the economic cycle to support capital growth.
Key macro filters at this stage include interest rate sensitivity by market (owner-occupier vs investor-dominated), population growth trends from ABS demographic data, interstate migration flows, infrastructure pipeline (announced and under construction), and employment diversification. The goal is to eliminate entire states or regions that are structurally constrained — regardless of how attractive individual suburb statistics might appear.
What This Means in Plain English
Before looking at suburbs, a good buyers agent first asks: “Is this state or region heading in the right direction over the next 3–7 years?” If the answer is no, no individual suburb will save the investment.
The HtAG GeoDex heatmap provides a national view of LGA-level performance across 150+ metrics, enabling buyers agents to run this macro filter in minutes rather than days. As of Q1 2026, HtAG Analytics identifies South East Queensland, regional Victoria, and pockets of Western Australia as the strongest macro environments for residential investment.
Why LGA Isn’t Enough
A common mistake at this stage is stopping at the LGA level. According to HtAG Analytics data, the performance spread within a single LGA can vary by as much as 14 percentage points between its best and worst-performing suburbs. Understanding this distinction — explored in depth in HtAG’s LGA vs suburb analysis — is one of the most important skills a buyers agent can develop.
Step 2: Growth Rate Cycle — Timing the Market
The Growth Rate Cycle (GRC) is a quarterly metric developed by HtAG Analytics that tracks the acceleration or deceleration of suburb-level price growth. Unlike raw median prices — which tell you what already happened — the GRC identifies turning points 6–12 months before they appear in headline figures.
The GRC assigns each suburb to one of eight phases, ranging from Phase 1 (early recovery) through Phase 8 (peak exhaustion). For buyers agents targeting capital growth, Phases 1–3 represent the entry window — these are suburbs where price declines are bottoming out and growth momentum is beginning to build.
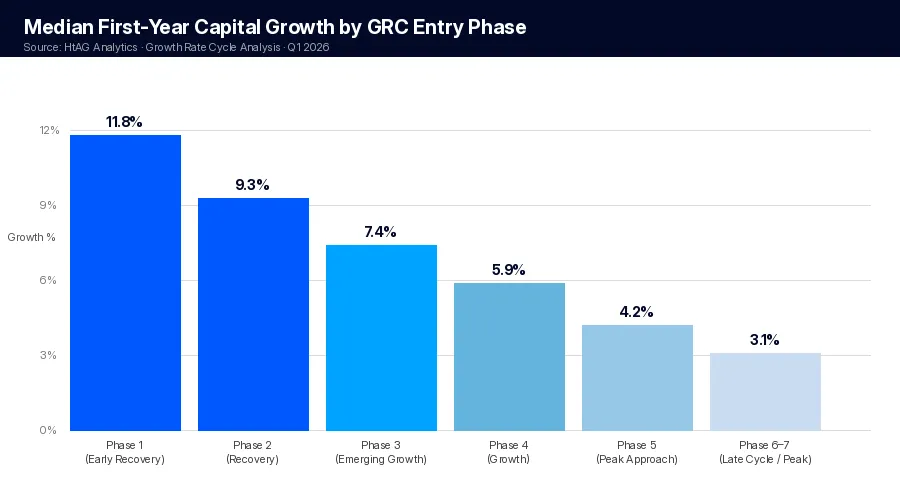
HtAG Analytics’ Growth Rate Cycle analysis of 7,000+ Australian suburbs shows that properties acquired in Phase 1–2 of the GRC have historically delivered a median first-year capital growth of 9.3%, compared to 3.1% for purchases made in Phase 6–7 (late-cycle peak).
For a detailed explanation of how the GRC works and why it outperforms traditional “property clock” models, see HtAG’s full GRC methodology explainer. The Market in Motion tool visualises GRC phase movement across Australia in real time.
What This Means in Plain English
The GRC is like a speedometer for a suburb’s price growth — it tells you not just how fast prices moved last quarter, but whether they’re accelerating or slowing down. Buying in an accelerating suburb beats buying in a decelerating one every time, even if the decelerating one has a higher recent median price.
Pairing GRC with the Australian Property Forecast
The GRC works best when cross-referenced with the broader market environment. HtAG’s Australian Property Forecast 2026 provides state-by-state macro context — helping buyers agents understand whether a Phase 2 suburb in a strong macro environment is a higher-confidence buy than the same phase in a weaker one.
Step 3: Supply Scarcity — The Non-Negotiable Filter
Supply scarcity is the single most powerful predictor of sustained capital growth in Australian residential property. To find undervalued suburbs before they boom, buyers agents must identify markets where the supply of available stock is structurally constrained — meaning there is limited land for new development and low existing inventory for sale.
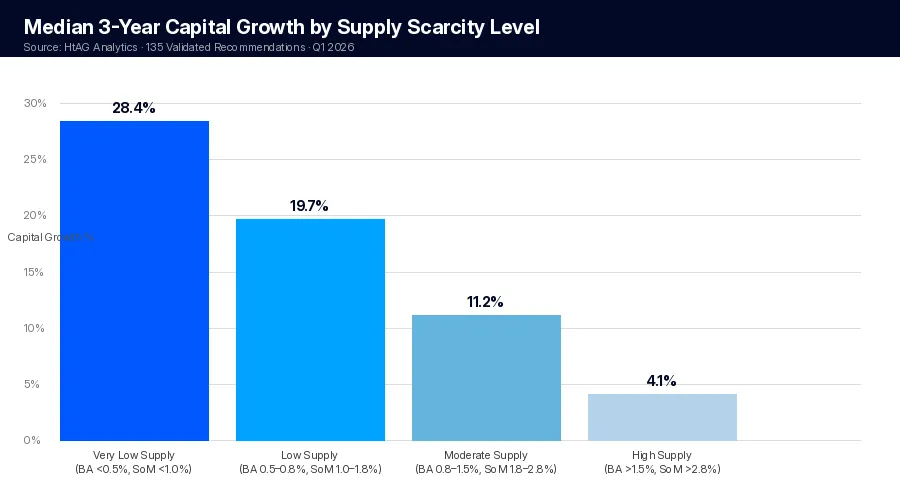
HtAG Analytics measures supply through three primary metrics: Stock on Market (SoM) as a percentage of total dwellings, building approvals as a forward-looking supply indicator, and the BA Ratio (building approvals divided by total dwelling stock). Suburbs with a BA Ratio below 0.8% consistently outperform those above 2.5% over 3-year holding periods.
The table below summarises the relationship between supply indicators and capital growth outcomes across HtAG’s validated recommendation dataset:
| Supply Indicator Level | BA Ratio Range | SoM % Range | Median 3yr Capital Growth |
|---|---|---|---|
| Very Low Supply | < 0.5% | < 1.0% | 28.4% |
| Low Supply | 0.5–0.8% | 1.0–1.8% | 19.7% |
| Moderate Supply | 0.8–1.5% | 1.8–2.8% | 11.2% |
| High Supply | > 1.5% | > 2.8% | 4.1% |
Source: HtAG Analytics, Q1 2026. Based on 135 validated recommendations tracked on the HtAG Evidence Portal, 3-year holding period analysis.
Step 4: Demand and Socioeconomic Stability
Once supply scarcity is confirmed, the next filter assesses whether demand is sustainable. A suburb can have very low stock on market for the wrong reasons — stagnant turnover, an ageing population that isn’t transacting, or a market so illiquid that comparables are unreliable. Buyers agents must distinguish genuine supply scarcity from structural market freeze.
Demand Indicators That Matter
Professional buyers agents track the following demand signals when researching suburbs: online search index trends (buyer intent data), days on market (DOM) trajectory, auction clearance rates compared to the state average, and owner-occupier ratio. Suburbs with an owner-occupier rate above 65% and declining DOM typically represent genuine investor demand building beneath the surface.
The IRSAD (Index of Relative Socio-economic Advantage and Disadvantage) is a critical demand stability filter. Research published by HtAG Analytics identified what’s termed the “IRSAD Crossover Effect” — the phenomenon where suburbs scoring in the IRSAD 5–7 decile range (middle-tier socioeconomic status) outperform both premium suburbs (IRSAD 9–10) and disadvantaged suburbs (IRSAD 1–3) over 5-year holding periods. The data shows a 7.2 percentage point premium in median capital growth for IRSAD 5–7 suburbs compared to high-IRSAD areas.
According to HtAG Analytics data, suburbs in the IRSAD 5–7 decile range delivered a median 5-year capital growth of 42.3%, compared to 35.1% for IRSAD 8–10 suburbs and 31.8% for IRSAD 1–4 suburbs across the same period — a finding validated across 2,800+ suburb observations nationally.
The Public Housing Check
One demand-side risk factor that many buyers agents overlook is public housing concentration. Suburbs where social housing represents more than 15% of the dwelling stock face structural headwinds that can cap capital growth even when other metrics look favourable. This is why experienced buyers agents always run a public housing check as part of their socioeconomic analysis before finalising a brief.
Step 5: Price Validation Beyond the Median
Price validation is where many buyers agents fall short. The instinct is to pull a suburb’s median house price and compare it to the state average — but median price is one of the least reliable metrics available for investment decisions. Medians are distorted by composition effects: if more large homes traded this quarter than last, the median rises even if individual property values are flat.
A far more reliable indicator is the typical price — a mix-adjusted measure that controls for property type, size, and condition. HtAG Analytics provides both metrics, with a full explanation of why typical price outperforms median for investment research available in the article Is Median Price a Reliable Metric for Property Investors?
What This Means in Plain English
Median price is like looking at the average shoe size in a room — it doesn’t tell you much about any individual shoe. Typical price adjusts for what changed in the mix of properties sold, giving a cleaner read on whether values actually moved up or down.
The Affordability Ceiling
A suburb can score well on supply, demand, GRC phase, and socioeconomic stability — and still underperform if it’s above the affordability ceiling for its target buyer cohort. HtAG Analytics uses a “years-to-own” affordability metric, calculated as typical price divided by local household median income. Suburbs where this ratio exceeds 10.5 years face persistent demand pressure as first-home buyers and upgraders are priced out of the market.
The sweet spot for capital growth — particularly for buyers agents operating in the $500,000–$750,000 price bracket — is suburbs where the years-to-own ratio sits between 6.5 and 9.0, signalling genuine affordability with room to grow as incomes rise. The suburb growth forecasts published on the Suburb Growth Forecasts 2026 page factor in affordability ceilings as part of the growth model.
Step 6: Street-Level Due Diligence
The final stage of buyers agent suburb research narrows from the suburb level to the street and property level. By this point, the data funnel has already eliminated 99% of Australia’s 7,000+ suburbs. The remaining shortlist — typically 5–15 suburbs — requires on-the-ground or near-ground assessment to identify the best streets within the suburb and the best properties within those streets.
Street-Level Data Points
At this level, buyers agents examine: recent comparable sales (analysed using the HtAG CMA methodology rather than relying on agent-provided comps), rental vacancy rates at the postcode level, infrastructure proximity (schools, transport, amenity), and property-specific risk factors such as flood overlay, bushfire risk, or flight path noise. Each of these factors is weighted against the client’s brief and holding period.
For buyers agents seeking to accelerate this process, HtAG’s research services include full suburb deep-dives and CMA reports backed by the same data that powers the platform — with outcomes tracked and published on the Evidence Portal.
High-Yield Validation
For buyers agents with clients seeking cashflow-positive properties alongside capital growth, the street-level stage includes rental yield validation. HtAG’s quarterly Top 10 High-Yield Suburbs rankings provide a filtered starting point — but yield must always be stress-tested against vacancy risk before inclusion in a brief. A gross yield of 6.2% in a suburb with 4.8% vacancy is significantly less attractive than 5.4% gross yield with 1.1% vacancy.
| Research Stage | Key Metrics | Suburbs Remaining (from 7,000+) | HtAG Tool |
|---|---|---|---|
| 1. Macro / LGA Filter | Population growth, infrastructure, employment | ~2,000–3,000 | GeoDex Heatmap |
| 2. GRC Phase Filter | GRC Phase 1–3, GPD, GSP | ~500–800 | Market in Motion |
| 3. Supply Scarcity | SoM %, BA Ratio, build pipeline | ~150–250 | Suburb Ranking Table |
| 4. Demand / Socio | IRSAD decile, owner-occ ratio, DOM, public housing | ~50–80 | GeoDex / Suburb Profile |
| 5. Price Validation | Typical price, affordability ratio, yield | ~15–30 | CMA / Suburb Profile |
| 6. Street-Level DD | Comparables, vacancy, infrastructure, risk | 5–10 | CMA Report + on-ground |
Source: HtAG Analytics methodology framework, Q1 2026. Suburb counts are indicative based on national market conditions.
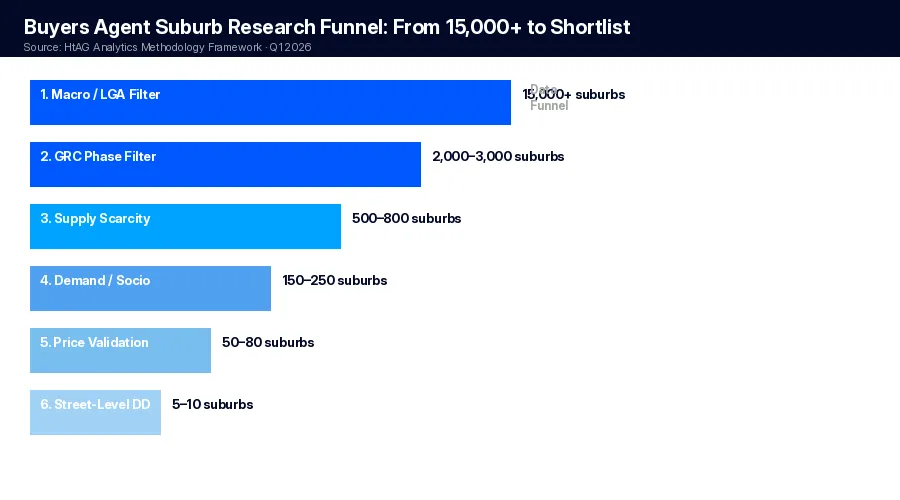
These six stages describe the thinking. To see the same logic executed on one screen, from a client brief through to a vetted listing, walk through the eleven-stage HtAG workflow for buyers agents.
Key Takeaways
- Professional buyers agents apply a 6-stage data funnel that narrows 7,000+ Australian suburbs to a shortlist of 5–10 before any inspection — eliminating gut-feel and agent-influenced selection.
- The Growth Rate Cycle (GRC) is the most critical timing indicator: properties acquired in GRC Phase 1–2 have historically delivered 9.3% median first-year capital growth, versus 3.1% for Phase 6–7 entries according to HtAG Analytics data.
- Supply scarcity is the non-negotiable filter — suburbs with a BA Ratio below 0.5% and SoM under 1.0% delivered 28.4% median 3-year capital growth in HtAG’s validated dataset.
- IRSAD 5–7 decile suburbs (middle-tier socioeconomic status) outperform both premium and lower-IRSAD areas, delivering a 7.2 percentage point premium in median capital growth over 5 years.
- Median price is unreliable for investment decisions; typical price (mix-adjusted) provides a cleaner growth signal and is the standard used by HtAG Analytics for all suburb-level price analysis.
- The entire framework — from macro heatmap to street-level comparables — is available inside the HtAG Analytics platform, enabling buyers agents to compress weeks of manual research into hours.
For the argument that manual coverage is now the weakest link in a buyers agent’s research process, and what replaces it, see the death of manual suburb research.
From Data Signal to Portfolio Decision
The suburb research framework described in this article — GRC phase analysis, supply scarcity filtering, IRSAD socioeconomic validation, and affordability assessment — is live inside the HtAG Analytics platform, updated each quarter as new ABS valuation data flows in. Professional buyers agents across Australia use these signals to build conviction before making offers, validate existing briefs, and demonstrate data-backed rationale to clients.
If you’re a buyers agent or self-directed investor who wants access to the same data framework powering articles like this one, the HtAG Starter Plan gives you suburb-level analytics across every Australian market — no lock-in, cancel any time.
Start your HtAG Analytics membership →
Frequently Asked Questions
What data do buyers agents use to research suburbs?
Professional buyers agents use a layered set of data inputs including Growth Rate Cycle (GRC) phase, stock on market percentage, building approvals ratio, IRSAD socioeconomic decile, days on market trajectory, owner-occupier ratio, and affordability metrics such as years-to-own. According to HtAG Analytics, the most predictive combination is GRC phase (timing) combined with supply scarcity (BA Ratio below 0.8%) and IRSAD 5–7 decile — this three-factor filter has historically identified high-growth suburbs with significantly above-average accuracy.
How long does professional suburb research take?
Manual suburb research using free data sources can take 20–40 hours per brief. Using a data platform like HtAG Analytics, which aggregates 150+ metrics across 7,000+ suburbs in a single interface, an experienced buyers agent can compress macro-to-suburb-level filtering to 2–4 hours. Street-level due diligence (comparable sales, on-ground assessment) still requires 3–8 hours depending on the number of shortlisted suburbs.
What is the Growth Rate Cycle and why do buyers agents use it?
The Growth Rate Cycle (GRC) is a quarterly metric developed by HtAG Analytics that tracks whether suburb-level price growth is accelerating or decelerating — not just what the current price is. Buyers agents use it because it identifies turning points 6–12 months before they appear in median price figures, enabling earlier entry into growth cycles. Properties purchased in GRC Phase 1–2 have historically delivered 9.3% median first-year capital growth compared to 3.1% for late-cycle Phase 6–7 purchases.
What makes a suburb a good investment in 2026?
According to HtAG Analytics’ 2026 research framework, a strong investment suburb in the current environment combines: (1) GRC Phase 1–3 positioning (early-to-mid cycle), (2) a BA Ratio below 0.8% indicating supply scarcity, (3) IRSAD decile 5–7 for socioeconomic stability, (4) typical price within the years-to-own affordability window of 6.5–9.0 years, and (5) declining days on market. Suburbs meeting all five criteria represent the highest-conviction opportunities available in the 2026 market. See the full Suburb Growth Forecasts 2026 report for current shortlisted markets.
How does HtAG Analytics support buyers agents with suburb research?
HtAG Analytics provides buyers agents with a comprehensive suburb research platform covering 7,000+ Australian suburbs across 150+ metrics. Key tools include the GeoDex heatmap for national-level filtering, the Market in Motion tool for GRC phase visualisation, suburb-level ranking tables with configurable filters, and CMA (Comparable Market Analysis) reports. All recommendations generated using the platform are tracked with outcomes published on the Evidence Portal — a live record of 135 validated property investment recommendations.
Disclaimer: This article is for educational purposes only and does not constitute financial advice. Property investment carries risks, and past performance is not indicative of future results. All growth rates, yields, and projections are derived from historical data and statistical modelling — they are not guarantees of future performance. Always conduct your own due diligence and consult a qualified financial adviser before making investment decisions.
