

Short summary: Townsville houses reached a Typical Price of $824,177 in June 2026, up 16.2% over the year — but on HtAG data every one of the city’s house markets is now in the positive-but-decelerating phase of the Growth Rate Cycle, and the Relative Composite Score spans 90 (Kirwan) to 30 (the Townsville City CBD). This is a data-led read of what the numbers actually show, not a price prediction.
Townsville property market forecast 2026, in 30 seconds
- What is it? A first-party, suburb-level read of the Townsville house market as at 30 June 2026 — price, growth, yield, vacancy, cycle position and composite quality (RCS).
- Why does it matter? The headline “double-digit growth” number hides a 60-point quality gap between suburbs and a cycle that is cooling from its peak.
- Who uses it? Investors, buyers agents and mortgage brokers weighing a North Queensland purchase.
- Use it on its own? No — read it alongside the live Townsville City dashboard and each suburb’s own page.
In a nutshell: Townsville has been one of Australia’s strongest regional house markets — up more than 100% over five years — but as at June 2026 the growth rate is decelerating city-wide, and where you buy inside the city now matters far more than the headline number suggests.
Search “Townsville property market forecast 2026” and you will find a familiar chorus: double-digit growth, a booming local economy, more of the same ahead. The direction of travel isn’t wrong. But a single city-wide prediction tells you almost nothing about the decision an investor or buyers agent actually has to make — which Townsville, and when. This page answers that with first-party Property Intelligence: live, suburb-level HtAG data as at 30 June 2026, read through the same cycle and composite-score lens we apply to every market.
The short version: the Townsville house market is still growing, but the rate of growth is fading, and the gap between its strongest and weakest suburbs is wide enough to swamp the headline number. Here is what the data shows.
What the Townsville house market looks like right now
Across all houses, Townsville City (LGA QLD142) reached a Typical Price of $824,177 in June 2026 — HtAG’s robust central price, a more stable read than a raw median. The representative three-bedroom house sits at about $682,277, renting for $549 a week on a gross yield near 4.2%. Over the year the market grew 16.2%; over ten years it compounded at 8.3% a year. Roughly 5,188 houses changed hands in the year, and vacancy is extremely tight at 1.35%.
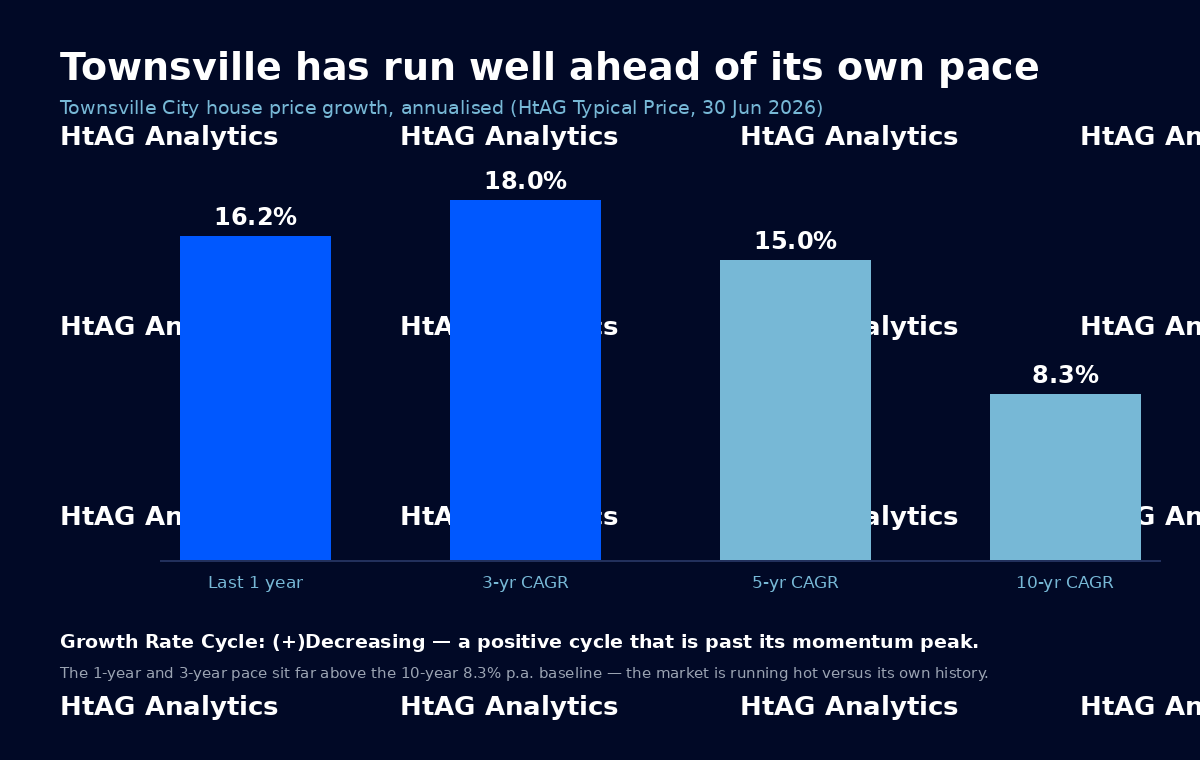
Two things stand out. First, the recent pace — 16.2% over the year, an 18.0% compound rate over three years — sits well above the market’s own decade-long 8.3% baseline. In HtAG’s language, the market is running hot relative to its own history. Second, the Growth Rate Cycle reads (+)Decreasing — a positive cycle that is past its momentum peak. Growth is still positive; the acceleration behind it is not.
Plain English: think of the Growth Rate Cycle like a car that’s still moving forward but has eased off the accelerator. Townsville is not reversing — but the surge that produced 16% years is losing pace, and HtAG’s own 12-month projection for the LGA spans a wide −1% to +13%. Momentum this late in a run is a reason to be selective, not a green light to buy anything.
One median, two markets: the RCS quality spread
Here is where a city-level forecast falls apart. We sampled 34 Townsville house markets on HtAG data. Every single one grew over the year, and every single one reads (+)Decreasing on the cycle. Yet their Relative Composite Score (RCS) — which blends capital-growth, cashflow and lower-risk quality into a single 0–100 number — ranges from 90 down to 30. That 60-point gap sits inside one median.
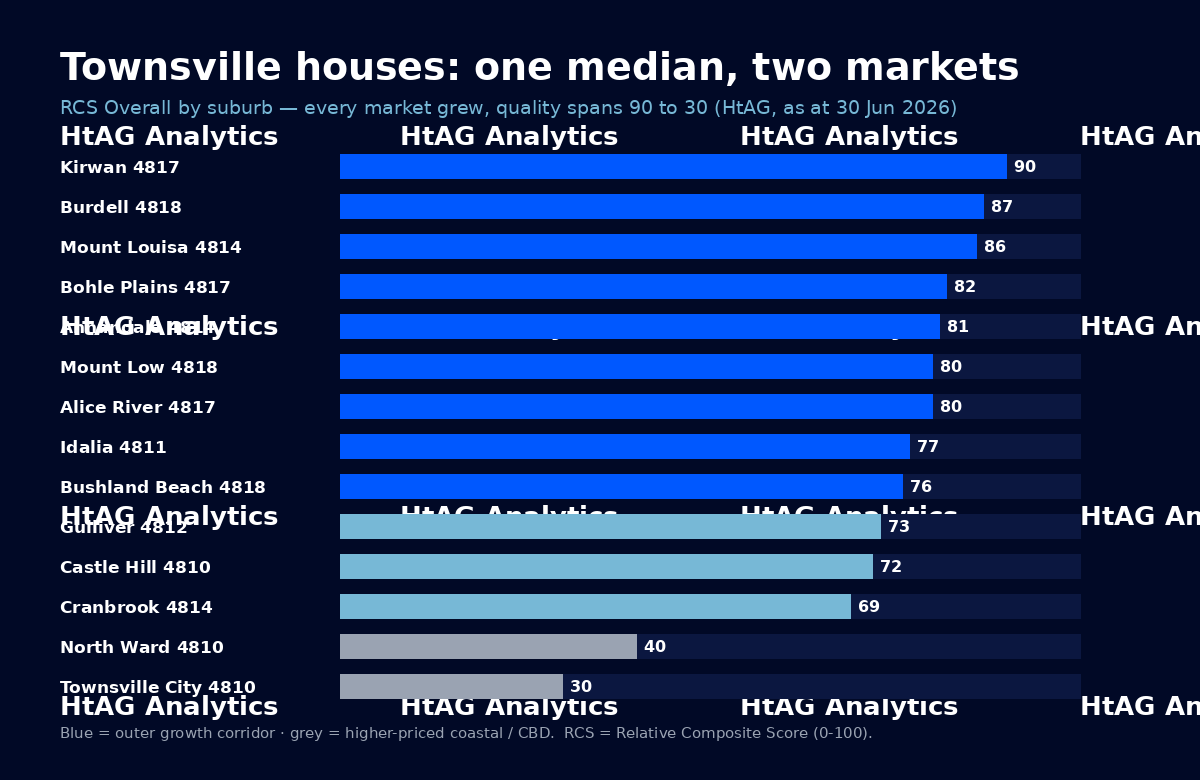
The table below shows a representative fourteen of those markets, spanning the full spread. Prices, one-year growth and yields are HtAG house data as at 30 June 2026; each suburb links to its live dashboard.
| Suburb (dashboard) | Typical Price | 1-yr growth | Gross yield | RCS Overall | Growth Rate Cycle |
|---|---|---|---|---|---|
| Kirwan, QLD 4817 | $768,900 | +15.1% | 3.81% | 90 | (+)Decreasing |
| Burdell, QLD 4818 | $811,857 | +20.1% | 3.90% | 87 | (+)Decreasing |
| Mount Louisa, QLD 4814 | $757,594 | +16.9% | 3.99% | 86 | (+)Decreasing |
| Bohle Plains, QLD 4817 | $885,915 | +20.9% | 3.58% | 82 | (+)Decreasing |
| Annandale, QLD 4814 | $829,856 | +14.3% | 3.81% | 81 | (+)Decreasing |
| Mount Low, QLD 4818 | $763,936 | +15.6% | 4.00% | 80 | (+)Decreasing |
| Alice River, QLD 4817 | $1,043,839 | +14.8% | 3.39% | 80 | (+)Decreasing |
| Idalia, QLD 4811 | $938,173 | +14.3% | 3.77% | 77 | (+)Decreasing |
| Bushland Beach, QLD 4818 | $932,318 | +14.7% | 3.40% | 76 | (+)Decreasing |
| Gulliver, QLD 4812 | $683,497 | +22.3% | 3.94% | 73 | (+)Decreasing |
| Castle Hill, QLD 4810 | $1,637,791 | +10.6% | 3.25% | 72 | (+)Decreasing |
| Cranbrook, QLD 4814 | $690,225 | +17.7% | 4.32% | 69 | (+)Decreasing |
| North Ward, QLD 4810 | $1,130,516 | +11.0% | 3.01% | 40 | (+)Decreasing |
| Townsville City, QLD 4810 | $1,054,915 | +8.8% | 3.14% | 30 | (+)Decreasing |
Plain English: two Townsville houses can both be “up double digits” and be completely different investments. Kirwan scores RCS 90 on a $768,900 typical price; the Townsville City CBD postcode scores 30 on a higher $1,054,915 — with a maximum volatility reading. The headline number treats them as one market. The data does not.
The corridor versus the coast
Sort the city by RCS and a clear geography emerges. The strongest composite scores cluster in the outer western and northern growth corridor — Kirwan (90), Burdell (87), Mount Louisa (86) and Bohle Plains (82) — where family houses sit in the $760k–$890k band on yields near 3.6–4.0% and vacancy under 2%.
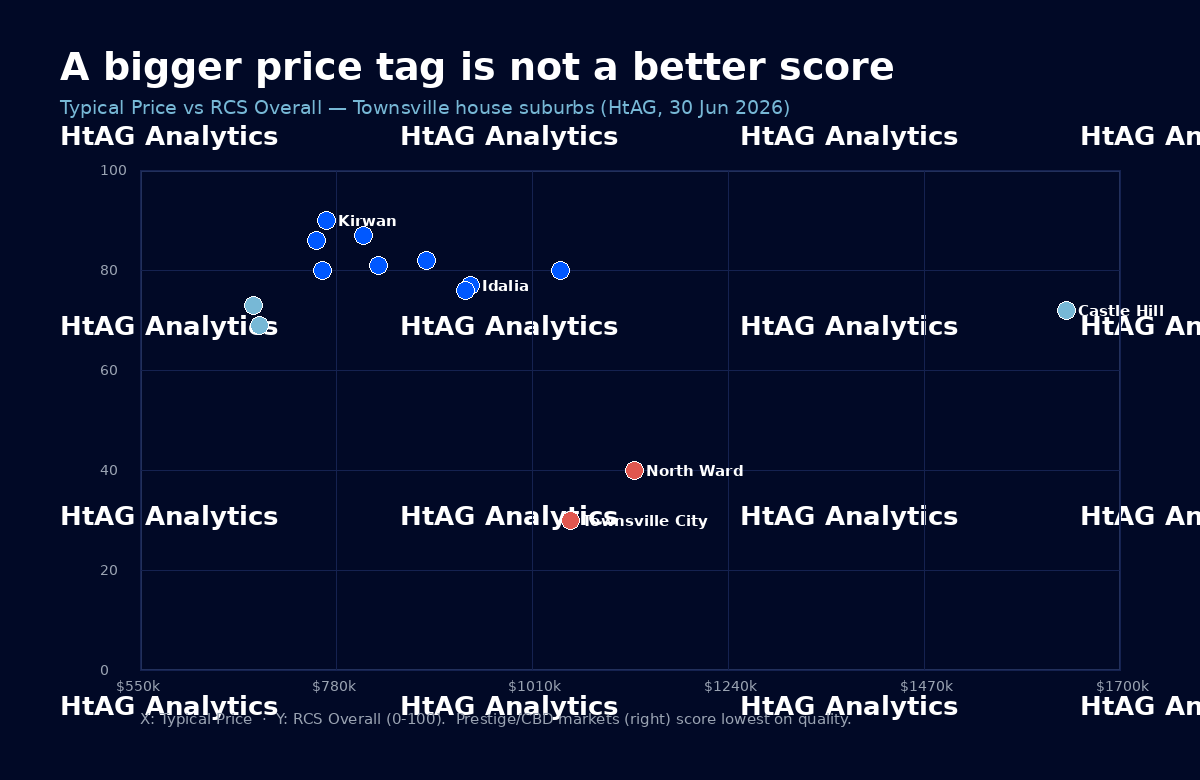
The lowest composite scores, by contrast, are the higher-priced coastal, inner and CBD markets: the Townsville City postcode (RCS 30, volatility 10/10, a projection range of −15% to +22%), North Ward (RCS 40) and the prestige Castle Hill (RCS 72 at a $1.64m typical price). A bigger price tag here has tended to buy more volatility and thinner turnover, not a better all-round score.
This is the same pattern HtAG mapped on the Gold Coast in the two-speed city read: the corridor of affordable, high-turnover family markets outscores the trophy postcodes on composite quality, even while both post similar headline growth.
What a “forecast” really means here
HtAG doesn’t publish a single number and call it a forecast. It publishes a position: where a market sits in its cycle, how its recent growth compares to its own long-run pace, and a projection range rather than a point. For Townsville, all three signals point the same way — the market is late in a strong run.
The Growth Rate Cycle is (+)Decreasing city-wide. Recent growth sits well above the ten-year 8.3% baseline. And history urges caution about chasing exactly this profile: HtAG’s study of what happens after a property boom found that across 3,886 house markets, the hottest tenth in a boom year went on to under-perform the coolest tenth over the following five years. Momentum is not destiny. That is exactly why the composite-quality read matters more than the growth headline this late in Townsville’s cycle.
Plain English: “Townsville grew 16% last year” is a rear-view-mirror fact, not a forecast. The forward-looking questions are: is the cycle still accelerating (no), is the price ahead of the market’s own history (yes), and does the specific suburb score well on all-round quality (some do, many don’t). Those are the questions the data can actually help with.
None of this is a buy or sell signal on any individual suburb. It is a lens. Vacancy near 1.35% and rent growth of 6.8% over the year tell you the rental market is genuinely tight; the cycle and composite reads tell you to be selective about which house you attach that tenancy demand to. For the wider context, see regional vs metro investing and whether property forecasts are accurate.
How to pressure-test a Townsville suburb
The method is the same one HtAG applies everywhere, and you can run it on any Townsville market without a spreadsheet full of thresholds:
- Start with the whole-of-market read — Typical Price, one-year growth versus the ten-year pace, and the Growth Rate Cycle phase. This tells you where in the run you are.
- Check composite quality, not just growth — the RCS blends capital-growth, cashflow and lower-risk into one score, so a hot-but-fragile market and a durable one stop looking alike.
- Read the momentum context — Growth Pattern Deviation shows whether a suburb is running ahead of, or behind, its own typical pace.
- Confirm the rental picture — vacancy and rent trend tell you whether the cashflow you’re underwriting is real. Townsville’s is tight today; that can change.
- Cross-check the specific street and property once the suburb passes — the market read is the filter, not the final answer.
You can pull every one of these numbers for any Townsville suburb on its HtAG dashboard — start from the Townsville City LGA page or browse the whole Queensland LGA directory. For the framework applied across the state, see best suburbs to invest in Queensland and the Brisbane sub-markets read.
Surface this data inside your AI agent
Every figure on this page comes from the same HtAG data warehouse that powers our Developer Portal. Through HtAG’s Model Context Protocol (MCP) servers, you can query Townsville — or any of 7,000+ Australian suburbs — directly inside Claude, Perplexity, Manus, Codex or any MCP-compatible AI agent, and have it reason over live prices, RCS, cycle position and projections without re-keying a single number.
HtAG runs Australia’s first property-intelligence MCP platform: 104+ REST endpoints and 70+ public MCP tools across all 537 LGAs, refreshed quarterly. Apply for Developer Portal access via the access form and start querying HtAG data inside your own AI workflow.
Key takeaways
- Townsville houses reached a Typical Price of $824,177 in June 2026, up 16.2% over the year and up more than 100% over five years.
- The Growth Rate Cycle reads (+)Decreasing across the entire city — a positive cycle past its momentum peak, with recent growth well above the 10-year 8.3% baseline.
- Composite quality (RCS) spans 90 (Kirwan) to 30 (the Townsville City CBD) — a 60-point gap hidden inside one median.
- The outer western and northern growth corridor outscores the higher-priced coastal, inner and CBD markets on all-round quality.
- Vacancy is very tight at 1.35% and rents rose 6.8% over the year, but late-cycle history rewards selectivity over chasing the headline.
From data signal to portfolio decision
A city-wide forecast can’t tell you which Townsville suburb fits your brief. HtAG can. Screen every North Queensland market on RCS, Growth Rate Cycle, yield and vacancy, compare thousands of suburbs on the metrics that matter, and turn a “booming region” headline into a shortlist you can act on. Explore HtAG membership or start on the live Townsville dashboard.
Frequently asked questions
What is the Townsville property market forecast for 2026?
On HtAG data as at 30 June 2026, Townsville houses have a Typical Price of $824,177, up 16.2% over the year, but the Growth Rate Cycle reads (+)Decreasing city-wide and HtAG’s 12-month projection for the LGA spans −1% to +13%. In plain terms: still positive, but decelerating from a strong run — a market to approach selectively rather than uniformly.
Is Townsville a good place to invest in 2026?
It depends heavily on the suburb. HtAG’s Relative Composite Score for Townsville house markets ranges from 90 (Kirwan) to 30 (the Townsville City CBD), so “Townsville” is really many markets. The outer growth corridor scores strongest on combined capital-growth, cashflow and lower-risk quality; several higher-priced coastal and CBD markets score lowest.
Which Townsville suburbs score highest on HtAG data?
As at 30 June 2026, the highest RCS Overall scores among sampled house markets are Kirwan (90), Burdell (87), Mount Louisa (86) and Bohle Plains (82) — all in the outer western and northern corridor. Scores and underlying data are on each suburb’s HtAG dashboard.
Why is Townsville’s growth rate slowing if prices are still rising?
Prices and the growth rate are different things. Townsville prices are still rising, but the Growth Rate Cycle — which tracks the direction and momentum of year-on-year growth — reads (+)Decreasing, meaning the pace of gains is easing from its peak while remaining positive.
Can I get Townsville property data inside ChatGPT or Claude?
Yes. Through HtAG’s Developer Portal and Model Context Protocol servers, you can query live Townsville data — prices, RCS, cycle position, yields and projections — inside Claude, Perplexity, Manus or any MCP-compatible agent. Apply for access via the HtAG Developer Portal form.
Suggested citation. HtAG Analytics, “Townsville property market: momentum vs trend and the RCS quality spread”, June 2026. Townsville City houses reached a Typical Price of $824,177 in June 2026, up 16.2% over the year against a 10-year compound pace of 8.3% p.a., with vacancy 1.35% and the Growth Rate Cycle at (+)Decreasing. Across 34 Townsville house markets sampled on HtAG data as at 30 June 2026, every suburb sat in the positive-but-decelerating phase of the Growth Rate Cycle, yet RCS Overall spanned 90 (Kirwan, $768,900) to 30 (Townsville City 4810, $1,054,915) — a 60-point composite-quality gap. Source: HtAG Analytics, houses, as at 30 June 2026.
The conceptual framework behind these metrics is published openly for transparency and education. Its proprietary implementation — calibration, weighting, validation and the underlying data — remains the confidential intellectual property of HtAG Analytics.
This article forms part of the HtAG Property Intelligence Reference Library — a structured knowledge base documenting the concepts, metrics and methodologies used to analyse Australian residential property markets. Reference Standard PI-TWOSPEEDCITY · Version 1.0.
Disclaimer: This article is general information only, prepared without regard to your objectives, financial situation or needs. It is not financial, investment or property advice and figures are point-in-time HtAG estimates as at 30 June 2026 that will change. Do your own research and seek licensed advice before making any property decision.
