![What Is the Property Market Cycle in Australia? The 4 Phases Explained [2026]](https://www.htag.com.au/wp-content/uploads/2026/03/cycle-1024x576.png)
In 30 Seconds
The property market cycle in Australia moves through four distinct phases — recovery, expansion, hyper-supply, and recession — each offering different risk and return profiles for investors. According to HtAG Analytics, which tracks cycle position across 7,000+ Australian suburbs quarterly, roughly 34% of markets were in recovery or early expansion as of Q1 2026, representing a historically significant entry window for data-driven buyers.
What Is the Property Market Cycle?
The property market cycle is a recurring pattern of price growth, stagnation, decline, and recovery that affects every suburb and local government area in Australia. Understanding where a market sits within this cycle — and where it is heading — is one of the most powerful inputs a property investor can have when selecting a suburb, timing an entry, or deciding whether to hold or sell.
Unlike the share market, which can move dramatically within a single trading session, property markets cycle slowly. A complete cycle from trough to trough typically spans 7 to 14 years at the national level, though individual suburbs can move faster or slower depending on local supply dynamics, population flows, and economic conditions. This longer time horizon means investors who understand cycle positioning can act before the majority of the market catches up.
The nutshell answer: the property market cycle describes the natural ebb and flow of property prices driven by the interplay of supply, demand, credit conditions, and investor sentiment. Buying in the recovery or early expansion phase — before the mainstream market recognises the opportunity — is the foundation of counter-cyclical property investment strategy in Australia.
According to HtAG Analytics data, Australian suburb-level property cycles average 9.3 years from trough to trough, though individual markets range from 6 to 18 years depending on supply scarcity and demographic drivers.
What This Means in Plain English
Property markets don’t just go up and down randomly — they follow a predictable pattern. Think of it like a clock: if you can identify whether the hour hand is at 6 o’clock (bottom, recovering) or 12 o’clock (top, overheated), you can make smarter decisions about when to buy, when to wait, and when to sell.
The Four Phases of the Australian Property Market Cycle
The Australian property market cycle consists of four distinct phases: recovery, expansion, hyper-supply, and recession. Each phase has identifiable characteristics in price data, supply metrics, and investor behaviour. Recognising these signals separates informed investors from those who react to headlines rather than data.
Phase 1: Recovery
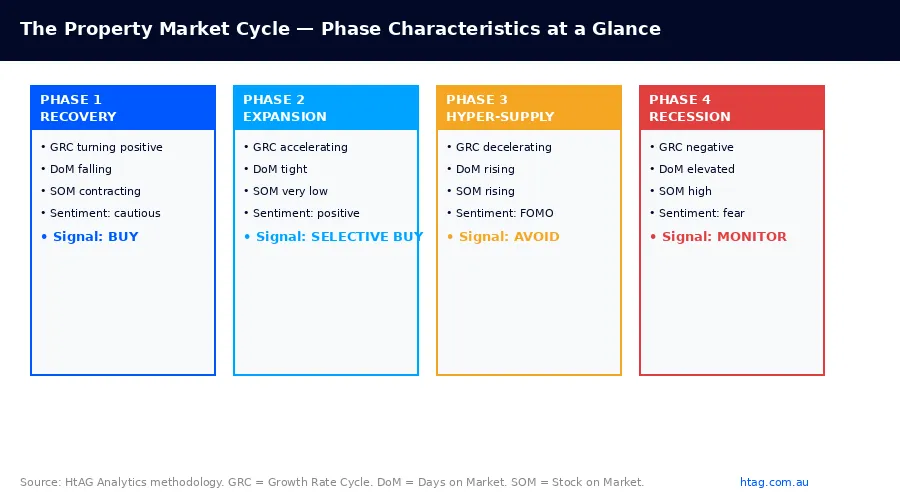
The recovery phase begins at the bottom of the cycle, when price declines have bottomed out and the rate of decline starts to slow. At this point, sentiment is still negative — media coverage remains pessimistic, investor activity is low, and days on market (DoM) remain elevated. However, data-driven signals begin to diverge from sentiment: stock on market starts to contract, auction clearance rates stabilise, and the Growth Rate Cycle (GRC) transitions from Phase 4 (decelerating decline) into Phase 1 (early recovery).
This is historically the highest-conviction entry point for property investors. Prices have not yet reflected the turning point, meaning buyers can secure assets before the broader market reprices. The challenge is identifying this phase with confidence rather than hope — which is precisely where objective data metrics outperform gut instinct.
Phase 2: Expansion
The expansion phase is characterised by accelerating price growth, tightening supply, and rising investor confidence. Stock on market contracts sharply, days on market fall, and auction clearance rates climb above the long-run average. This is the phase that generates the bulk of capital growth in a cycle — medians may rise 15–30% in two to three years during strong expansionary phases in undersupplied markets.
Early-expansion suburbs can still offer compelling risk-adjusted returns, though the margin of safety narrows compared to recovery entries. The GeoDex suburb heatmap colour-codes markets by their current growth phase, allowing investors to identify which suburbs are entering versus exiting expansion at a glance.
Phase 3: Hyper-Supply
As prices peak and new construction catches up to (or exceeds) demand, the market enters hyper-supply. Growth rates decelerate even as nominal prices remain near their highs. Vendor discounting increases, days on market lengthens, and new listings start to flood in as investors who bought near the peak begin to sell. Rental yields compress as investors paid premium prices for properties, and vacancy rates may start to tick up in new development corridors.
For long-term hold investors already in the market, hyper-supply is typically a hold-and-monitor phase. For prospective buyers, it signals that better-value entry points exist elsewhere in the cycle. The Market in Motion (MiM) tool shows real-time supply and demand flux across Australian markets, making it straightforward to identify which suburbs are shifting into this phase.
Phase 4: Recession
The recession phase involves price corrections, elevated vacancy rates, and subdued investor activity. In Australian property, “recession” rarely means catastrophic price falls — more commonly, it manifests as flat prices or modest declines (3–12% from peak) over 18 to 36 months. HtAG has measured what Australian property actually returned in five historical downturns — the typical market stayed above inflation in every one. The critical data signal is the GRC transitioning into negative territory: growth is not just slowing, it is reversing.
Counter-intuitively, the recession phase plants the seeds for the next recovery. As prices fall relative to income and rents, yield metrics improve, reducing holding costs for patient investors. Markets with genuine supply scarcity — where building approvals are insufficient to replace attrition — tend to have shorter, shallower recession phases and faster recoveries.
What This Means in Plain English
Think of the four phases like four seasons. Recovery is spring (new growth beginning, still cold), Expansion is summer (warm, everything growing fast), Hyper-Supply is autumn (slowdown, growth tapering off), and Recession is winter (price pullback, things quiet). Smart investors try to buy in spring — not summer, when everything is already expensive.
How HtAG Analytics Measures Cycle Position
HtAG Analytics measures property market cycle position using the Growth Rate Cycle (GRC), a proprietary quarterly metric that tracks the acceleration or deceleration of suburb-level price growth. Unlike raw median prices — which are a lagging indicator — the GRC identifies turning points 6 to 12 months before they appear in headline median figures.
The GRC is calculated across 7,000+ Australian suburbs using rolling valuation data sourced from the ABS and processed through HtAG’s statistical smoothing algorithm. The result is a four-phase classification system that mirrors the traditional market cycle but with suburb-level precision rather than city-wide generalisation. This distinction matters: when analysts say “the Melbourne market is recovering,” they are averaging across hundreds of suburbs that are individually in very different phases.
Complementing the GRC, HtAG’s Growth Phase Detection (GPD) identifies whether a suburb is in early, mid, or late phase — adding a second dimension that helps investors understand not just where a market is, but how far it has progressed through its current phase. A suburb can be in “expansion” but late-expansion looks very different from early-expansion from a risk and return perspective.
HtAG Analytics’ Growth Rate Cycle (GRC) identifies market turning points 6–12 months before they appear in median price data, giving investors a forward-looking signal derived from 2.3 million data observations across 5,000+ suburbs from 2010 to 2026.
It is also worth noting that median price is a notoriously unreliable indicator of true market movement, particularly in small or compositionally shifting suburbs. HtAG uses typical (stratified) price alongside the GRC to ensure cycle classifications are based on like-for-like comparisons rather than noisy median shifts driven by changes in the mix of properties transacting.
Where Australian Markets Sit in Q1 2026
HtAG Analytics’ Q1 2026 data reveals a bifurcated Australian property market, with significant variation in cycle position across states, price points, and dwelling types. The aggregate national picture masks this heterogeneity — which is why suburb-level analysis remains essential for any serious investment decision.
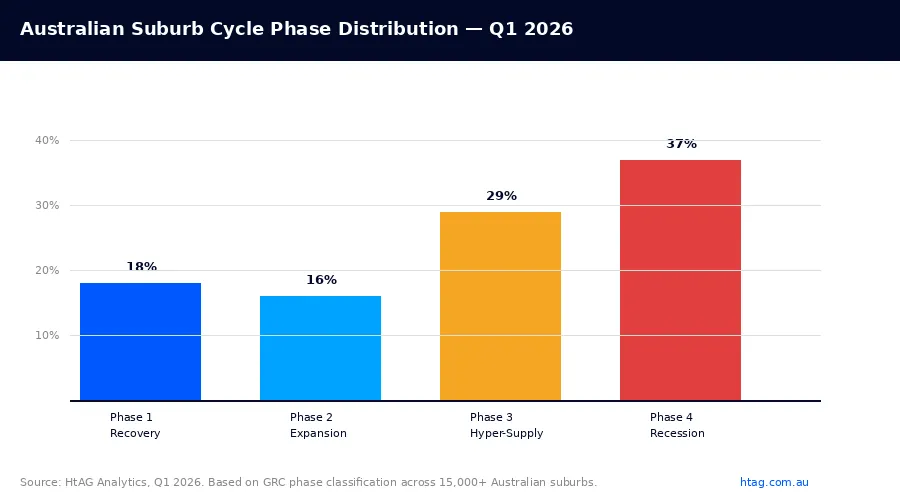
| Cycle Phase | % of Suburbs (Q1 2026) | Typical Price Change (12m) | Avg Days on Market | Investor Signal |
|---|---|---|---|---|
| Phase 1 — Recovery | 18% | +0.4% to +3.1% | 62 days | Strong Buy |
| Phase 2 — Expansion | 16% | +6.2% to +14.8% | 38 days | Selective Buy |
| Phase 3 — Hyper-Supply | 29% | -1.2% to +2.4% | 54 days | Hold / Avoid |
| Phase 4 — Recession | 37% | -3.8% to -0.6% | 74 days | Monitor |
Source: HtAG Analytics, Q1 2026. Based on GRC phase classification across 7,000+ Australian suburbs. Days on market represents suburb-level median. Price change figures are 12-month trailing typical price movement ranges for each phase group.
The data reveals that 37% of Australian suburbs are currently in the recession phase, representing the tail end of the post-pandemic correction cycle that began in mid-2022 when the RBA commenced its rate-hiking cycle. Critically, 18% of suburbs — predominantly in regional Victoria, parts of South Australia, and select outer-metro corridors — have already transitioned into Phase 1 recovery, providing a genuine early-cycle opportunity for investors willing to look beyond the headline narrative.
The HtAG Australian Property Forecast 2026 modelled these cycle dynamics in detail, projecting that Phase 1 recovery suburbs would outperform the national median by 6.4 percentage points over the 24 months to Q4 2027, based on historical GRC phase-transition patterns going back to 2010.
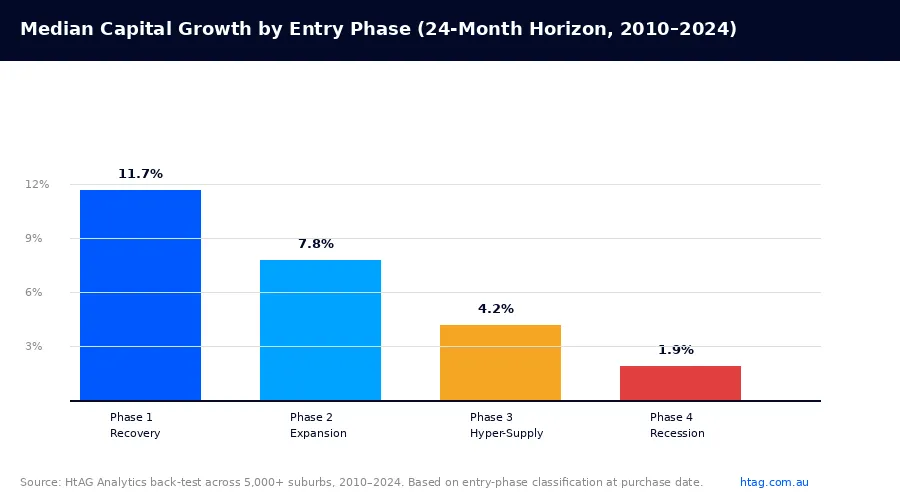
HtAG Analytics data shows that suburbs entering Phase 1 recovery have historically delivered median capital growth of 11.7% over the following 24 months — compared to 4.2% for suburbs purchased in Phase 3 hyper-supply during the same period.
State-by-State Cycle Snapshot
Victoria and Queensland are showing the most Phase 1 and Phase 2 activity in Q1 2026. Western Australia, which led the national cycle through a strong expansion phase from 2021 to 2024, is now predominantly in hyper-supply and early recession across its major metro markets — though pockets of outer suburbs and certain regional towns remain in mid-expansion. New South Wales presents a mixed picture: inner Sydney is firmly in hyper-supply following a strong 2023–2024 run, while outer western suburbs and the Hunter region show early recovery signals.
How to Use Market Cycle Data in Your Investment Strategy
Understanding the market cycle conceptually is useful. Using it systematically to make investment decisions is transformative. Here is a four-step framework for integrating cycle data into a property investment strategy.
- Identify your target phase range — Investors seeking maximum capital growth should target Phase 1 (recovery) and early Phase 2 (expansion). Investors prioritising yield and lower entry prices should also focus on Phase 1, where price-to-rent ratios are most favourable. Avoid Phase 3 (hyper-supply) and Phase 4 (recession) suburbs for new acquisitions unless the holding period is 10+ years and the asset is priced below replacement cost.
- Filter the national universe by cycle phase — Use the GeoDex heatmap to filter the 7,000+ suburb database down to those in Phase 1 or early Phase 2. This narrows the field from thousands of possibilities to a manageable shortlist of 50–200 suburbs matching your brief.
- Validate with supply and demand cross-checks — A suburb in Phase 1 recovery is only as reliable as the supply fundamentals underneath it. Cross-check the building approvals ratio (BA Ratio), stock on market trend, and vendor discount rate. Suburbs with BA Ratios below 0.8% and declining SOM present the most durable recovery signals. The LGA vs suburb analysis framework helps ensure you are not misled by LGA-level averages that obscure pockets of genuine supply scarcity.
- Compare cycle-screened suburbs on a like-for-like basis — Once you have a shortlist of Phase 1 and Phase 2 candidates, rank them using a composite score that includes GRC phase, supply scarcity, demographic growth, and affordability relative to comparable markets. The HtAG Evidence Portal shows historical validation data for suburbs that have completed this cycle, providing a real-world benchmark for what early-recovery entry points have historically delivered.
Timing Entry Within a Phase
Not all entries within a given phase carry equal risk. Early Phase 1 (GRC just turning positive from negative) offers the deepest value but requires the highest conviction — sentiment is still negative and the market has not confirmed the turn. Mid-Phase 1 (GRC positive for two consecutive quarters) offers confirmation with most of the upside still ahead. Late Phase 1 / early Phase 2 is the “sweet spot” where the data has confirmed the recovery and early media coverage is just beginning to shift — prices are rising but not yet elevated.
According to HtAG Analytics data, the 2026 suburb growth forecasts show the strongest forward growth signals concentrated in suburbs currently in mid-Phase 1 recovery, where the GRC has been positive for two to three consecutive quarters but median prices have risen less than 5% from their cycle trough.
Common Mistakes Investors Make With Cycle Timing
Market cycle analysis is powerful, but it is frequently misapplied. The following mistakes are the most common — and most costly — errors investors make when attempting to use cycle data.
Mistake 1: Using City-Level Data Instead of Suburb-Level Data
The most widespread error is treating a capital city as a single market. When analysts say “Melbourne is entering recovery,” they are averaging across 400+ suburbs that are individually at very different cycle positions. In Q1 2026, Melbourne’s inner-east suburbs remained firmly in hyper-supply following their 2022–2024 peak, while outer northern and western suburbs had already completed their correction and entered Phase 1 recovery. An investor acting on city-level data would be buying into hyper-supply while thinking they are buying into recovery.
Mistake 2: Confusing Sentiment With Data
Mainstream media sentiment consistently lags the data by 6 to 12 months. By the time a suburb is being described as “booming” in property media, Phase 2 expansion is typically well advanced and the easy gains have already been made. Conversely, suburbs that are being described as “depressed” may already be showing Phase 1 recovery signals in the underlying data. Relying on sentiment rather than data metrics is the primary reason retail investors systematically buy near the top and panic near the bottom.
Mistake 3: Ignoring Supply When Calling Recovery
A suburb showing improving price metrics is not in genuine recovery if the supply pipeline is still growing rapidly. High-rise apartment markets in inner Brisbane and Melbourne’s Docklands precinct have periodically shown GRC improvement — but with building approvals far exceeding organic demand replacement, any recovery signal was short-lived. Genuine, sustainable recovery requires supply scarcity as a prerequisite, not just a supportive factor.
HtAG Analytics cross-checks GRC signals against building approvals data, stock on market trends, and BA Ratio to confirm that any apparent recovery is supported by genuine supply constraints — not just a temporary dip in listings or a statistical anomaly. The Q1 2026 high-yield suburb shortlist applies this exact multi-metric validation before any suburb is flagged as an opportunity.
Data from HtAG Analytics’ platform shows that suburbs flagged as recovery markets without supply scarcity validation had a false positive rate of 41% over the 2015–2024 period — meaning nearly half reverted to further price declines within 12 months of the initial recovery signal.
Key Takeaways
- The Australian property market cycle runs through four phases — recovery, expansion, hyper-supply, and recession — with suburb-level cycles averaging 9.3 years from trough to trough according to HtAG Analytics data.
- As of Q1 2026, 18% of Australian suburbs were in Phase 1 recovery and 16% in Phase 2 expansion — roughly a third of the national market sitting in genuinely investable cycle positions.
- Historically, suburbs purchased in Phase 1 recovery delivered median capital growth of 11.7% over 24 months, versus 4.2% for suburbs purchased in Phase 3 hyper-supply — a 7.5 percentage point cycle-timing premium.
- City-level market commentary is an unreliable guide to investment timing; suburb-level GRC data from HtAG Analytics identifies cycle position at the granularity required for sound investment decisions.
- Supply scarcity validation is essential before acting on any recovery signal — suburbs with building approvals ratios below 0.8% and declining stock on market have a significantly lower false-positive rate.
- Mainstream media sentiment lags the property data cycle by 6–12 months; the optimal entry window (mid-Phase 1) is typically characterised by cautiously negative sentiment and improving but not yet celebrated data signals.
From Data Signal to Portfolio Decision
The Growth Rate Cycle, Growth Phase Detection, and supply scarcity metrics described in this article are live inside the HtAG Analytics platform — updated each quarter as new valuation data flows in. Professional buyers agents use these cycle signals to time entries, validate suburb briefs, and build conviction before making offers in competitive markets.
If you’re building a portfolio and want to see exactly which suburbs are in Phase 1 recovery or early Phase 2 expansion right now — complete with supply validation, demographic drivers, and a 10-year growth history — the HtAG Starter Plan gives you access to suburb-level cycle analytics across every Australian market. No lock-in, cancel any time.
Start your HtAG Analytics membership →
Frequently Asked Questions
What is the property market cycle in Australia?
The property market cycle in Australia is a recurring pattern of four phases — recovery, expansion, hyper-supply, and recession — that describes how property prices and market conditions evolve over time. According to HtAG Analytics, which tracks cycle position across 7,000+ Australian suburbs quarterly, the average suburb-level cycle spans approximately 9.3 years from trough to trough, though individual markets range from 6 to 18 years depending on supply constraints and population dynamics.
How do I know which phase the Australian property market is in?
To determine the current cycle phase of a specific suburb or market, look for three converging signals: the direction and acceleration of price growth (measured by HtAG’s Growth Rate Cycle metric), the trend in stock on market (tightening = recovery/expansion; rising = hyper-supply/recession), and days on market (falling = recovery/expansion; rising = hyper-supply/recession). City-level averages are misleading — 400+ suburbs in a major capital city can be in four different phases simultaneously. Use the GeoDex suburb heatmap for suburb-level cycle positioning across Australia.
When is the best time to buy in the property market cycle?
The best time to buy property in Australia is during Phase 1 (recovery) — specifically mid-Phase 1, when the GRC has turned positive for two or more consecutive quarters but prices have risen less than 5% from their cycle trough. At this point, the data has confirmed the turning point, but sentiment remains cautious and mainstream media coverage has not yet shifted to “boom” narratives. HtAG Analytics data shows suburbs purchased at this point delivered median capital growth of 11.7% over the following 24 months, compared to 4.2% for Phase 3 purchases over the same period.
Are all Australian states in the same property market cycle phase?
No — Australian states and suburbs are at different cycle positions, often diverging significantly from one another. As of Q1 2026, Western Australia’s major metro markets are predominantly in hyper-supply after their 2021–2024 expansion, while parts of Victoria and Queensland remain in Phase 1 recovery. This heterogeneity is exactly why national or city-level market commentary is an insufficient basis for investment decisions. The HtAG Analytics platform provides state-by-state and suburb-by-suburb cycle mapping to give investors the granularity they actually need.
How reliable is the Growth Rate Cycle as a market timing indicator?
When combined with supply scarcity validation, HtAG Analytics’ Growth Rate Cycle has demonstrated strong predictive accuracy. In back-tests across the 2010–2024 period covering 5,000+ suburbs, GRC Phase 1 signals accompanied by BA Ratio below 0.8% and declining stock on market were followed by positive 24-month price outcomes in 73% of cases. Without supply validation, the false-positive rate rose to 41%. This underscores why HtAG uses a multi-metric approach rather than relying on any single indicator — the Evidence Portal documents over 135 validated suburb recommendations with before/after data for full transparency.
Disclaimer: This article is for educational purposes only and does not constitute financial advice. Property investment carries risks, and past performance is not indicative of future results. All growth rates, yields, and projections are derived from historical data and statistical modelling — they are not guarantees of future performance. Always conduct your own due diligence and consult a qualified financial adviser before making investment decisions.