


Short Summary
Growth Pattern Deviation (GPD) is an HtAG Analytics metric that measures how a suburb’s current growth compares to its own historical average — not to a forecast or a benchmark. A negative GPD flags a market under-running its own trend (room to grow); a positive GPD flags one running hot (deceleration risk). Computed quarterly across 7,000+ Australian suburbs, GPD is a Level-3 counter-cyclical signal: it refines a shortlist, it doesn’t build one.
GPD in 30 seconds
What is it? A measure of whether a suburb is growing faster or slower than it normally does.
Why does it matter? It helps you avoid buying into a suburb just after it has already had its biggest growth.
Who uses it? Property investors, buyers agents and analysts.
Use it on its own? No — always read it alongside the Growth Rate Cycle and structural metrics.
Start Here
Imagine two suburbs. One usually grows about 8% a year but is currently growing just 3%. The other usually grows 3% but is currently running at 8%. Which one has more room left to grow? That is exactly the question Growth Pattern Deviation helps you answer.
Investors naturally gravitate towards the suburbs with the strongest recent capital growth. The problem is that those markets are often the ones closest to exhausting their cycle. Growth Pattern Deviation was built to answer a different question: not which suburb has grown the most, but which suburb is currently growing less than it normally does — and therefore may still have room to run.
Australia’s residential property market is worth more than $12.3 trillion across 11.4 million dwellings (ABS, December quarter 2025) — and inside that number sit thousands of suburbs all growing at different speeds. The hard question for an investor isn’t “which suburb grew fastest last year?” It’s “which suburb is growing slower than it usually does — and therefore has unspent upside?” That is precisely what Growth Pattern Deviation measures.
Growth Pattern Deviation (GPD) is a counter-cyclical property metric that compares a suburb’s current capital growth to its own long-run historical average over the same window. A negative GPD means the suburb is currently under-performing its own track record — a catch-up signal. A positive GPD means it is over-performing its own history — a ceiling-risk signal. HtAG Analytics calculates GPD quarterly across more than 7,000+ Australian suburbs.
Table of Contents
- What is Growth Pattern Deviation (GPD)?
- See it in action: two suburbs
- Why HtAG developed GPD
- How GPD is calculated
- Negative vs positive GPD: how to read it
- GPD vs GSP: two counter-cyclical lenses
- Where GPD fits in the HtAG decision stack
- Who uses GPD and why
- Common mistakes with GPD
- Surface this data inside your AI agent
- From data signal to portfolio decision
- Key takeaways
- FAQs
What is Growth Pattern Deviation (GPD)?
Growth Pattern Deviation is the gap between a suburb’s current growth and its own historical average growth across the same timeframe. It answers one question: is this market running ahead of, or behind, its own normal pace? Because it benchmarks a suburb only against itself, GPD strips out the “this suburb has always been a strong grower” effect and isolates whether the current moment is unusually hot or unusually quiet.
This makes GPD a counter-cyclical indicator. Most investors chase the suburbs with the highest recent growth — but a high growth rate often means the easy gains have already been made. GPD deliberately looks the other way: it surfaces markets whose current growth is below what they typically deliver, on the logic that under-performance against a suburb’s own long-run trend tends to mean-revert.
If you remember one thing from this article, remember this:
Canonical Definition
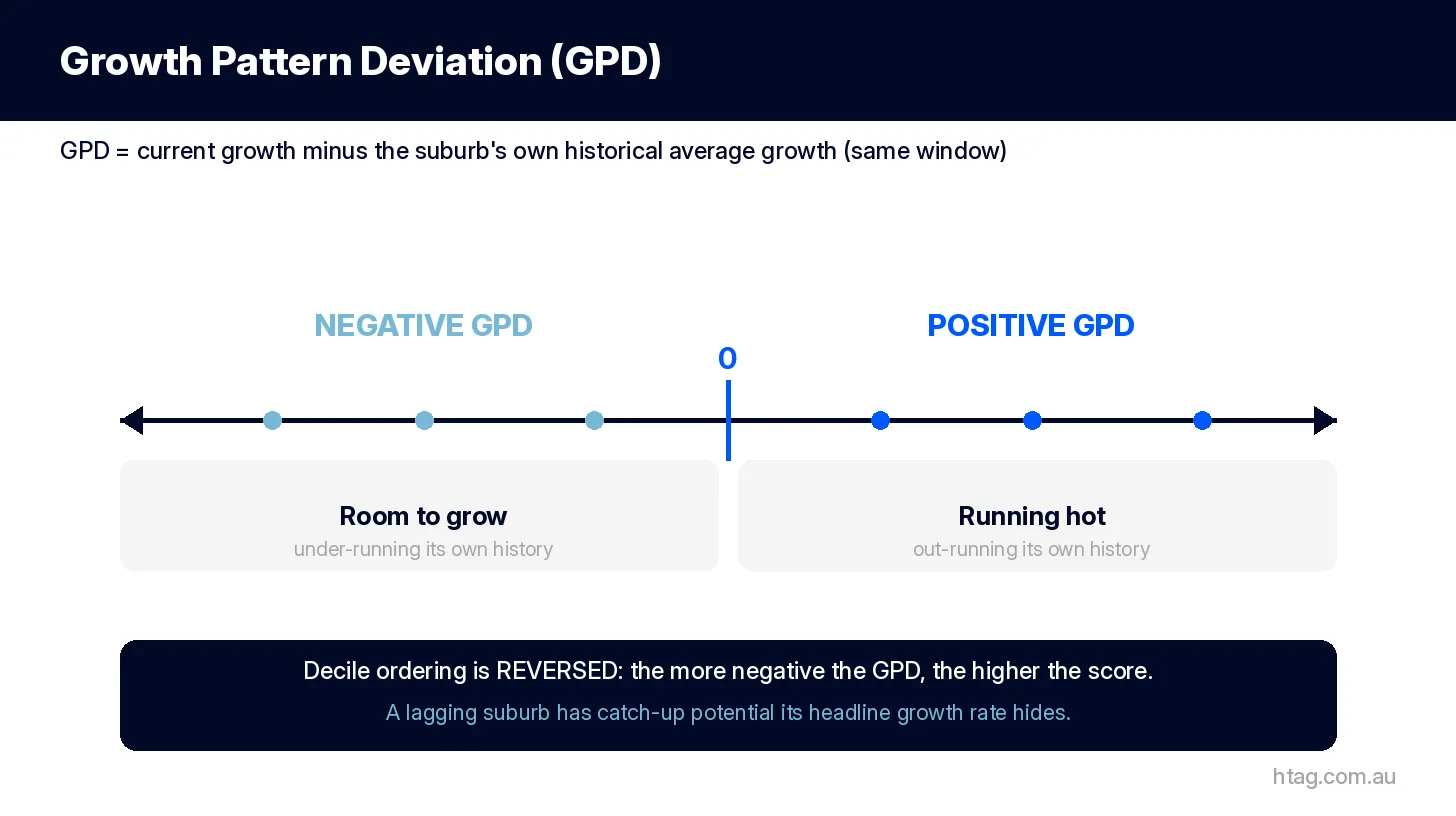
Growth Pattern Deviation (GPD) = a suburb’s current capital growth over a given window (3, 5 or 10 years) minus that suburb’s own rolling historical average growth over the same window. Negative values indicate room to grow; positive values indicate the market is running hot. GPD is a Level-3 contextual signal in the HtAG methodology.
According to HtAG Analytics, the most important word in the GPD definition is “own”. GPD never compares a suburb to a forecast, a national benchmark, or its structural capacity — only to its own historical rhythm.
A worked example: two suburbs, opposite signals
The clearest way to understand GPD is to compare two suburbs that are the same distance from their own average — but moving in opposite directions.
- Suburb A normally grows about 8% a year but is currently running at 3%. Its GPD is −5% — negative, signalling room to grow.
- Suburb B normally grows about 3% a year but is currently running at 8%. Its GPD is +5% — positive, signalling it is running hot.
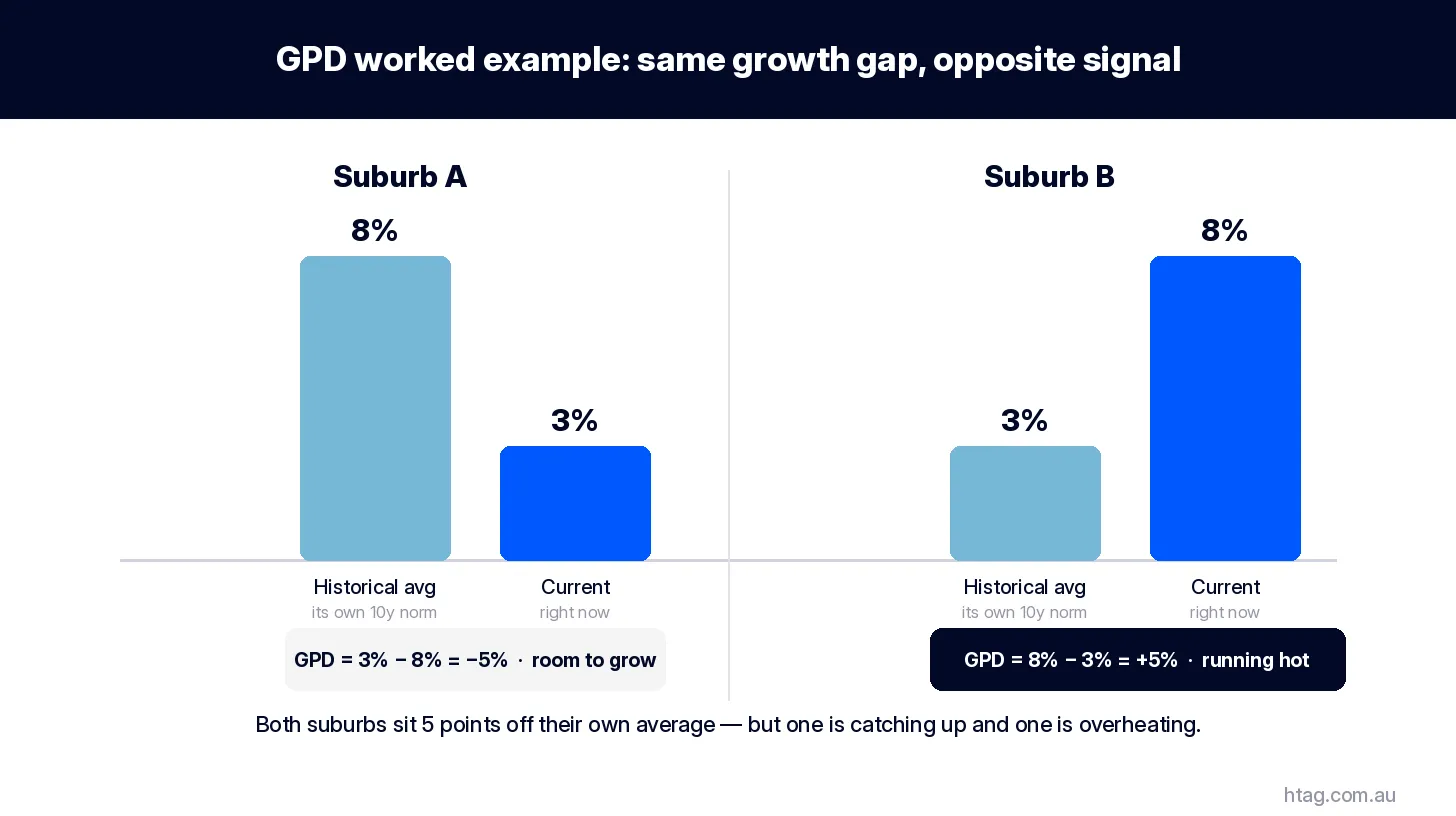
Both suburbs are five points away from their own norm. A headline growth screen would flag Suburb B as the “hot” market — but GPD shows Suburb A is the one with unspent upside, while Suburb B may be closer to the top of its run.
Why HtAG developed GPD
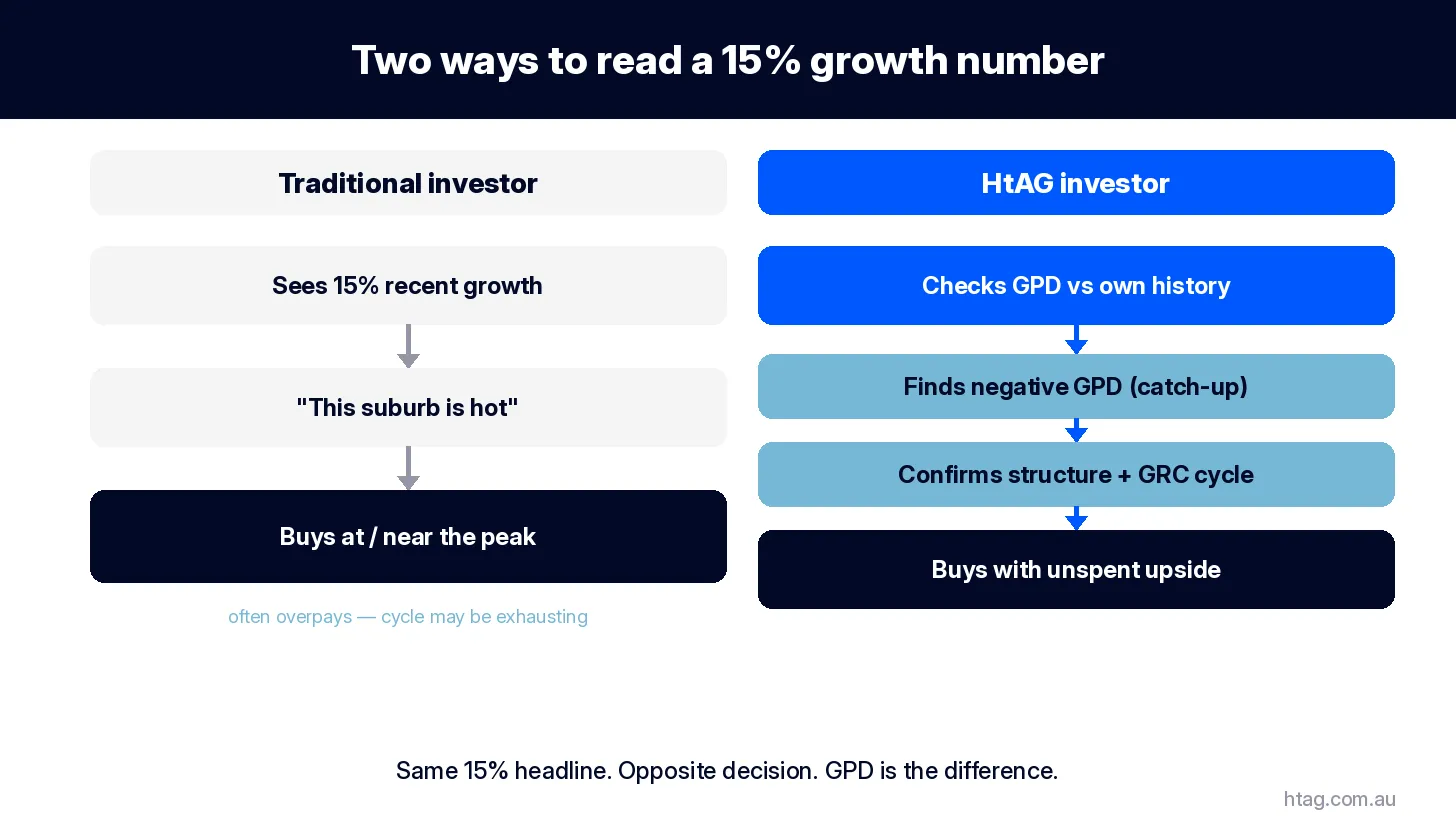
HtAG developed Growth Pattern Deviation because the most common property metrics all reward the same thing: suburbs that have already grown. Recent capital growth, hot-spot lists and momentum rankings point investors toward markets that have just had their run — precisely when the risk of overpaying is highest.
Across analysis of thousands of Australian markets, HtAG Analytics observed the same pattern repeatedly: buyers chasing historical winners were often entering near the top of a suburb’s own cycle. GPD was created to measure something the headline growth rate cannot — whether a market is currently outperforming or under-performing its own long-term behaviour. That single shift, from “fastest grower” to “quietest relative to itself”, is the counter-cyclical edge GPD exists to capture.
How GPD is calculated
At its simplest, GPD compares a suburb’s recent growth to the growth it has typically delivered over the same length of time. When recent growth is running below that typical pace, GPD reads negative; when it is running above its usual pace, GPD reads positive.
HtAG assesses this across short, medium and longer horizons rather than a single timeframe, because a recent lull tells a different story from a longer-run shift. A suburb can be quiet relative to its own recent history while a longer, decade-scale run hasn’t fully unwound — and the most compelling catch-up candidates are those sitting below their own typical pace across more than one horizon at once. The comparison is built on HtAG’s Typical Price series rather than volatile medians.
What This Means in Plain English
Imagine a suburb that normally grows about 7% a year, but over the last three years has only managed 3%. Its GPD is negative — it’s “behind schedule” against its own history. GPD doesn’t promise it will catch up, but it flags that the suburb is quiet relative to how it usually behaves, which is the opposite of buying at the top.
Negative vs positive GPD: how to read it
With GPD, the sign is everything — and the scoring is reversed from what most investors expect. A negative number is the favourable reading. Here is how each side maps to an investment interpretation:
| GPD reading | What it means | Investor signal |
|---|---|---|
| Negative GPD | Growing slower than its own historical average | Room to grow — catch-up potential, upside likely remains |
| Around zero | Tracking in line with its own long-run pace | Neutral — no counter-cyclical edge either way |
| Positive GPD | Growing faster than its own historical average | Running hot — ceiling risk, deceleration is probable |
Source: HtAG Analytics GPD methodology. Decile ordering is reversed — the more negative the GPD, the higher the decile score a suburb receives.
This reversal is the single most common point of confusion. On nearly every other property metric, “higher is better”. On GPD, lower (more negative) is better, because the metric is designed to reward markets that have not yet had their run. It is the data equivalent of buying the quiet shop on a busy street before the foot traffic arrives. This is the same counter-cyclical logic behind the IRSAD crossover effect, where lower-socioeconomic suburbs in deciles 4–7 have historically out-grown premium markets.
GPD vs GSP: two counter-cyclical lenses
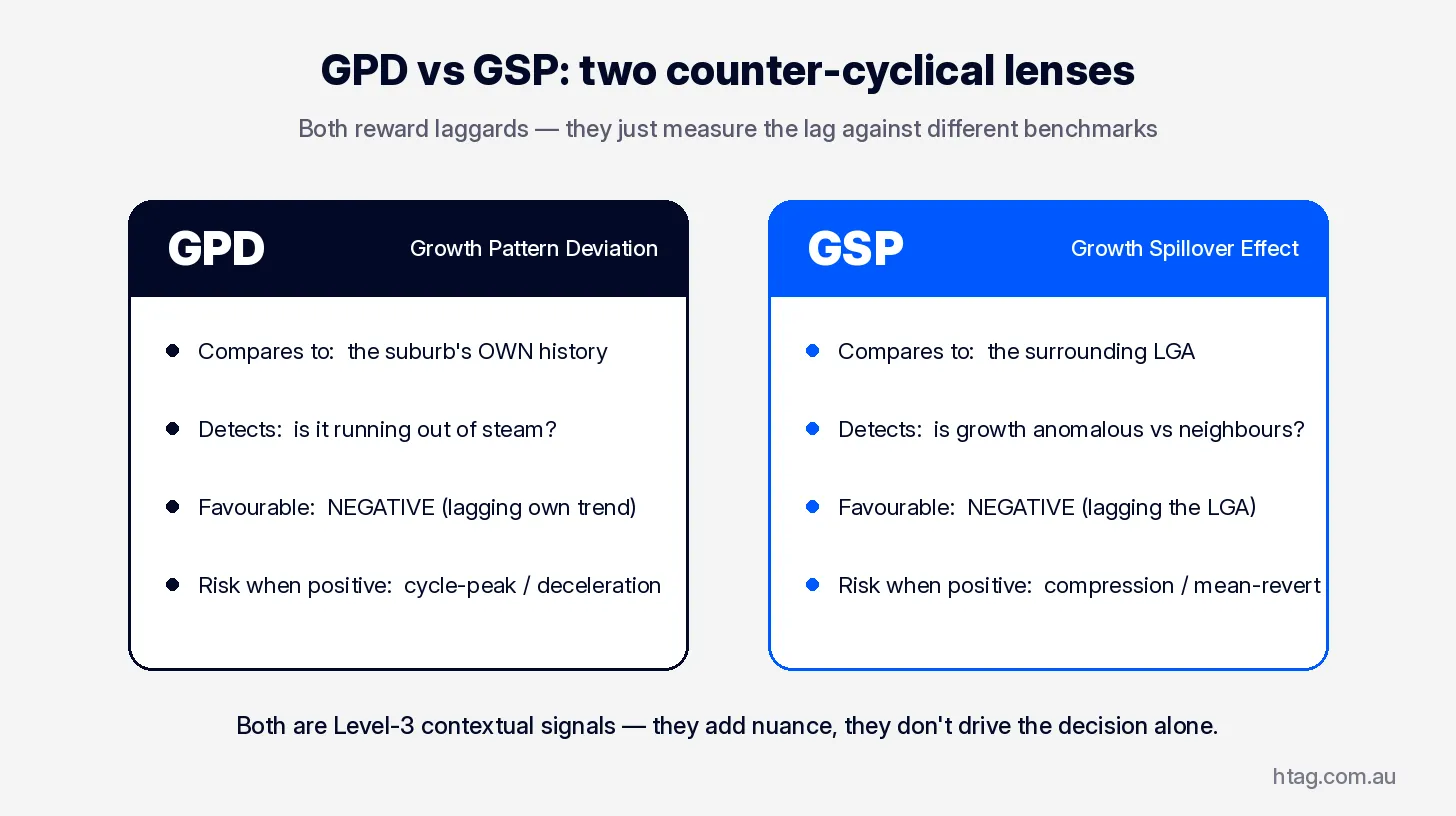
GPD is often confused with its sibling metric, the Growth Spillover Effect (GSP) — and the two are easy to mix up because both reward laggards and both read “negative is favourable”. The difference is the benchmark. GPD compares a suburb to its own history; GSP compares a suburb to its surrounding Local Government Area.
| Dimension | GPD — Growth Pattern Deviation | GSP — Growth Spillover Effect |
|---|---|---|
| Compares to | The suburb’s own historical trend | The surrounding LGA’s growth |
| Detects | Whether the suburb is running out of steam | Whether growth is anomalous vs neighbours |
| Favourable signal | Negative (lagging own history) | Negative (lagging the LGA average) |
| Risk when positive | Cycle peak / deceleration risk | Compression / normalisation toward LGA mean |
Source: HtAG Analytics. Read alongside the Spillover Effect explainer.
What This Means in Plain English
GPD asks “is this suburb behind its own past?” GSP asks “is this suburb behind the council area around it?” A suburb that is lagging on both at once — quiet against its own history AND quiet against its neighbours — is the strongest counter-cyclical candidate the two metrics can produce together.
What This Means in Plain English
Think of buying a car. First you check the engine runs, then the service history, and only then do you compare colour and options. GPD is that last step — it helps you choose between two suburbs that are both already worth considering. It breaks the tie; it doesn’t decide whether a suburb is worth buying in the first place.
Where GPD fits in the HtAG decision stack
GPD is a Level-3 contextual signal — it adds nuance to a decision but should never drive one on its own. In the HtAG methodology, structural and performance signals come first; GPD is the refinement layer applied to a shortlist that already stacks up.
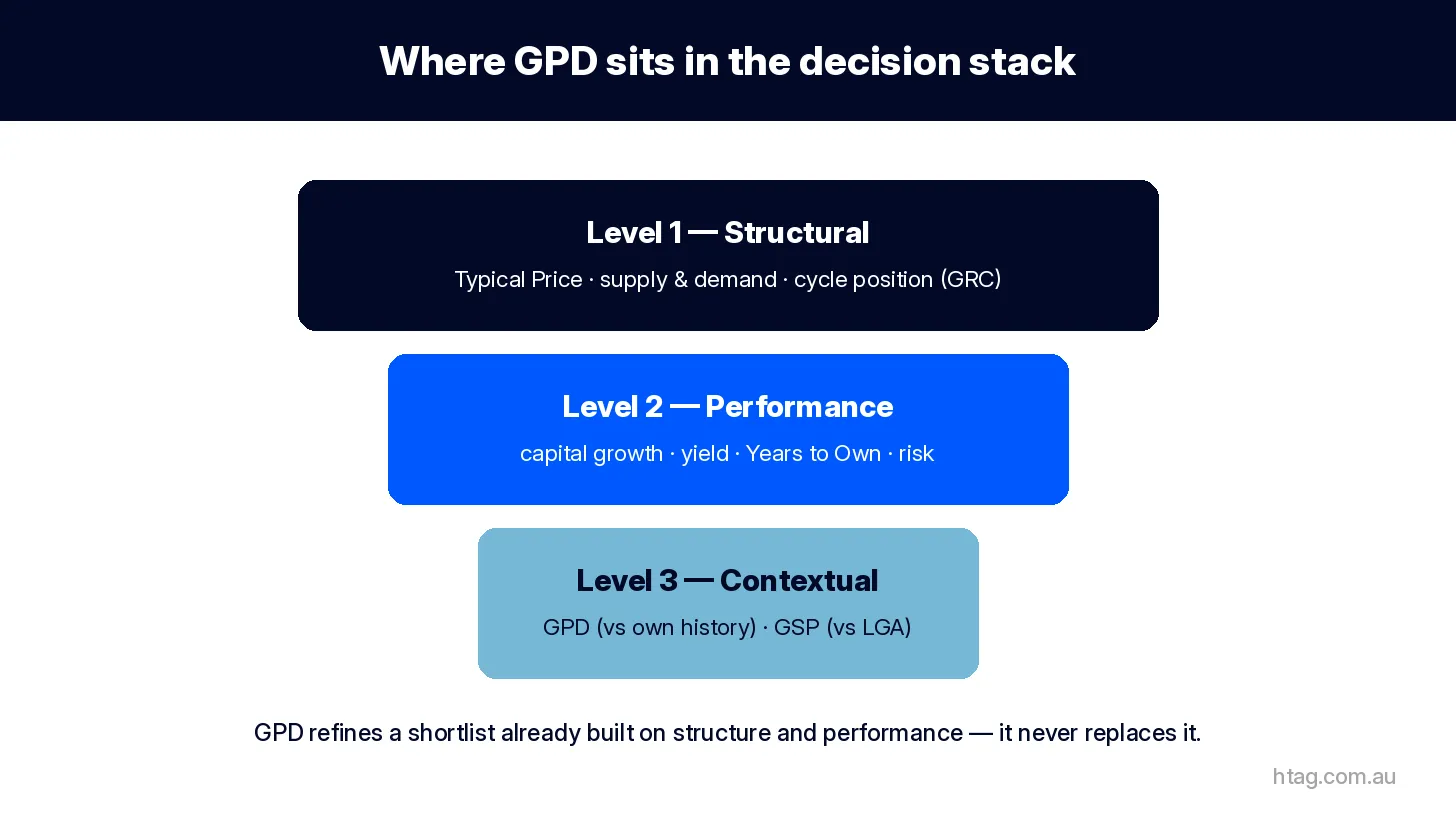
The order matters. A suburb with a deeply negative GPD but weak fundamentals — thin demand, oversupply, a falling Growth Rate Cycle reading — is not a catch-up opportunity; it is a value trap. GPD only earns its keep once a market has cleared the structural and performance gates. Used that way, it is the tiebreaker between two otherwise comparable suburbs: prefer the one that hasn’t already had its run.
What GPD is — and what it is not
It is: a self-referential, counter-cyclical timing nuance built on Typical Price, computed quarterly across 3, 5 and 10-year windows.
It is not: a forecast, a buy signal on its own, a comparison to structural capacity, or a substitute for assessing demand, supply and cycle position.
Research Note
Across testing on thousands of Australian suburbs, HtAG found GPD is most reliable when read together with the Growth Rate Cycle and Typical Price — not in isolation. A negative GPD on its own is a prompt to investigate, never a conclusion.
Who uses GPD and why
GPD is most valuable to investors and professionals who already screen on fundamentals and want a disciplined way to avoid buying at the top of a suburb’s own cycle.
- Investors use negative GPD to find markets with unspent upside, then validate them against Years to Own affordability and yield before committing.
- Buyers agents use GPD as a brief-validation and tiebreaker tool — it’s a defensible reason to recommend the quieter of two suburbs, documented in the Evidence Portal.
- Portfolio builders use GPD to avoid over-concentrating in markets that are already running hot (positive GPD across every window).
In every case GPD sits inside a wider workflow. If you’re new to suburb screening, start with the 7-step framework for analysing a suburb and the broader idea of property intelligence — GPD is one signal within that larger system, not a shortcut around it.
Common mistakes with GPD
GPD is powerful but easy to misread. These are the four mistakes that most often turn a useful signal into a poor decision:
- Using GPD on its own. GPD is a Level-3 refinement, not a buy signal. A negative reading on a structurally weak suburb is a value trap, not an opportunity.
- Thinking negative means bad. The scoring is reversed. A negative GPD is the favourable reading — it flags catch-up potential, not weakness.
- Confusing GPD with GSP. GPD compares a suburb to its own history; the Growth Spillover Effect (GSP) compares it to the surrounding LGA. They answer different questions.
- Ignoring the cycle. A negative GPD paired with a falling Growth Rate Cycle (GRC) is not a catch-up signal — always read GPD alongside cycle position.
Surface this data inside your AI agent
The HtAG Developer Portal now exposes GPD — and every other HtAG metric — through MCP (Model Context Protocol) connectors. Investors and buyers’ agents using Claude, Perplexity, Manus AI, or any other MCP-compatible AI agent can query a suburb’s GPD across all three windows directly inside the tool they already use, without re-keying numbers. HtAG is Australia’s first and only property-intelligence MCP platform.
HtAG’s MCP-enabled Developer Portal puts every metric in this article inside your AI agent. Apply for access and run the full GPD analysis on any Australian suburb without leaving Claude or Perplexity.
HtAG Analytics Developer Portal (2026)
Browse the endpoint catalogue at developer.htagai.com and submit the HtAG Developer Portal application — approved members receive an API key and an MCP setup guide for their preferred AI tool, drawing on 104+ REST endpoints across 7,000+ suburbs and all 537 LGAs.
From data signal to portfolio decision
GPD, GSP, and the Growth Rate Cycle described in this article are live inside the HtAG Analytics platform — updated each quarter as new valuation data flows in. Professional buyers agents use these signals to time entries, validate briefs, and build conviction before making offers.
If you’re building a portfolio and want to see the exact data powering articles like this one, the HtAG Starter Plan gives you access to suburb-level analytics across every Australian market — no lock-in, cancel any time. Compare thousands of suburbs on GPD and 150+ other metrics with the Dex suburb ranking and the GeoDex heatmap.
Start your HtAG Analytics membership → · Apply for Developer Portal access →
Key takeaways
- GPD compares a suburb to itself. It is current growth minus the suburb’s own rolling historical average over the same window — not a forecast or external benchmark.
- Negative is favourable. A negative GPD signals room to grow (catch-up potential); a positive GPD signals a market running hot with deceleration risk. The decile ordering is reversed.
- Read three windows. 3, 5 and 10-year GPD together reveal whether a lull is recent or structural; multi-window negatives are the strongest catch-up candidates.
- GPD ≠ GSP. GPD benchmarks against a suburb’s own history; GSP benchmarks against the surrounding LGA. Both reward laggards.
- It’s a Level-3 refinement, not a buy signal. Apply GPD only after structural and performance gates are cleared, or a negative reading can mask a value trap.
FAQs
What does a negative Growth Pattern Deviation mean?
A negative GPD means a suburb is currently growing more slowly than its own historical average over the same window — it is under-running its own trend. In the HtAG methodology this is the favourable reading: it flags potential catch-up upside, on the logic that under-performance against a suburb’s own long-run rhythm tends to mean-revert.
Is GPD the same as a growth forecast?
No. GPD is descriptive, not predictive. It measures the gap between current and historical growth as it stands today; it does not forecast future prices. HtAG treats GPD as a Level-3 contextual signal that refines a shortlist already built on structural and performance fundamentals.
What is the difference between GPD and GSP?
GPD (Growth Pattern Deviation) compares a suburb to its own historical growth. GSP (Growth Spillover Effect) compares a suburb to the surrounding Local Government Area. Both use reversed scoring — negative is favourable — but they answer different questions: “behind its own past?” versus “behind its neighbours?”
How do I access HtAG GPD data inside Claude or Perplexity?
HtAG exposes GPD through MCP (Model Context Protocol) connectors via the Developer Portal. Browse the endpoint catalogue at developer.htagai.com and apply for access using the HtAG Developer Portal application form. Approved members receive an API key and an MCP setup guide for Claude, Perplexity, Manus AI, or any MCP-compatible agent.
Related metrics in the GPD family
GSP — Growth Spillover Effect · GRC — Growth Rate Cycle · Typical Price · Years to Own
Continue Learning — HtAG Reference Library
- What Is Property Intelligence? — the parent concept this metric belongs to
- The Growth Spillover Effect (GSP) — GPD’s sibling counter-cyclical lens
- The Growth Rate Cycle (GRC) — the structural cycle signal GPD refines
- The Australian property market cycle — the four phases in context
- Education Hub — HtAG’s Property Intelligence Library
- HtAG Property Data Dictionary — the full metric index, including Growth Rate Cycle.
Suggested citation: HtAG Analytics (2026). What Is Growth Pattern Deviation (GPD)? The Counter-Cyclical Property Metric. Retrieved from https://www.htag.com.au/growth-pattern-deviation-gpd/
The conceptual framework behind this metric is published openly for transparency and education. Its proprietary implementation — calibration, weighting, validation and the underlying data — remains the confidential intellectual property of HtAG Analytics.
Disclaimer: This article is for educational purposes only and does not constitute financial advice. Property investment carries risks, and past performance is not indicative of future results. All growth rates, deviations, and signals are derived from historical data and statistical modelling — they are not guarantees of future performance. Always conduct your own due diligence and consult a qualified financial adviser before making investment decisions.
This article forms part of the HtAG Property Intelligence Reference Library — a structured knowledge base documenting the concepts, metrics and methodologies used to analyse Australian residential property markets.
Reference Standard PI-GPD · Version 1.0
GPD (property) vs “pattern deviation” in other fields
On this page, Growth Pattern Deviation (GPD) is HtAG’s counter-cyclical property metric – the gap between a suburb’s current growth and its own historical average. It is unrelated to the identically named “pattern deviation” used in ophthalmology and visual-field testing; if you arrived here looking for the medical term, this is not that. In property, GPD is a catch-up signal for Australian residential markets.