


Short Summary
HtAG Analytics tested suburb population growth against house price growth across 4,152 Australian house markets. The correlation is +0.04 — statistically close to nothing. Suburbs that lost population delivered a median 53.0% five-year price growth, above the 50.2% national median and above every decile from D3 to D8 that gained population. Population growth is a real force in Australian housing, but at suburb level it is not a signal you can select markets with.
In 30 Seconds
What is it? An original HtAG study testing whether a suburb’s population growth predicts its house price growth.
Why does it matter? “People are moving there” is the single most common reason given for buying a suburb — and on this evidence it carries almost no predictive weight.
Who uses it? Investors, buyers’ agents and analysts who want to know which inputs actually earn a place in a shortlist.
Use it on its own? No. This is a finding about one input, not a strategy. Population belongs in the context layer, not the selection layer.
Start Here: The Most Repeated Claim in Australian Property
Sit through any property seminar, read any hotspot list, listen to any agent’s pitch, and one argument will appear more than any other: people are moving here, so prices will go up. It is intuitive. It is easy to say. It is supported by a genuine national truth — Australia’s population has grown steadily and its housing has become dramatically more expensive over the same decades.
The problem is that nobody buys the nation. They buy a suburb. And the question that actually matters to a buyer is much narrower than the national story: among Australian suburbs, did the ones gaining people outperform the ones losing them?
We tested it. Across 4,152 Australian house markets, using Australian Bureau of Statistics estimated resident population from 2018 to 2023 against five-year house price growth to June 2026, the answer is close to no. The correlation is +0.04. The suburbs that lost the most population produced a higher median return than seven of the nine deciles above it.
This article sets out what we found, how we tested it, where the analysis is limited, and — more usefully — why a variable that clearly matters to housing at a national scale falls apart as a suburb-selection tool.
Table of Contents
- Start Here: The Most Repeated Claim in Australian Property
- What We Tested
- Finding 1: The Relationship Is Almost Flat
- Finding 2: Losing People Did Not Stop Prices
- Finding 3: It Barely Shifts the Odds
- Why Population Growth Fails as a Suburb Signal
- What the Ten-Year Result Adds
- Where Population Actually Belongs
- Methodology
- Limitations
- What This Study Is — and Is Not
- Surface This Data Inside Your AI Agent
- Key Takeaways
- Frequently Asked Questions
What We Tested
The study pairs two series for every Australian suburb with a liquid house market:
- Population change — ABS estimated resident population at locality level, 2018 to 2023, expressed as a percentage change over the period.
- House price growth — cumulative five-year growth in Typical Price for houses, all bedroom counts, to 30 June 2026.
We then sorted every market into ten equal groups by population change — decile 1 being the fastest population loss, decile 10 the fastest population gain — and read the median price growth of each group. If the common claim were true, the chart would slope upward from left to right.
In plain English: we lined up every suburb from “emptying out” to “filling up”, then asked what each group’s houses actually did. Think of it as a horse race where we sorted the horses by how much their crowd grew — and then checked whether crowd size had anything to do with who won.
Finding 1: The Relationship Is Almost Flat
Across all 4,152 markets, the correlation between five-year population change and five-year house price growth is +0.04. For context, a correlation of 0 means no linear relationship at all and 1.0 means a perfect one. At +0.04, population change explains a fraction of one per cent of the variation in suburb price outcomes.
The decile view makes the flatness visible. Eight of the ten deciles sit between 43.7% and 53.0% median five-year growth — a band roughly nine percentage points wide across the entire national spread of population outcomes.
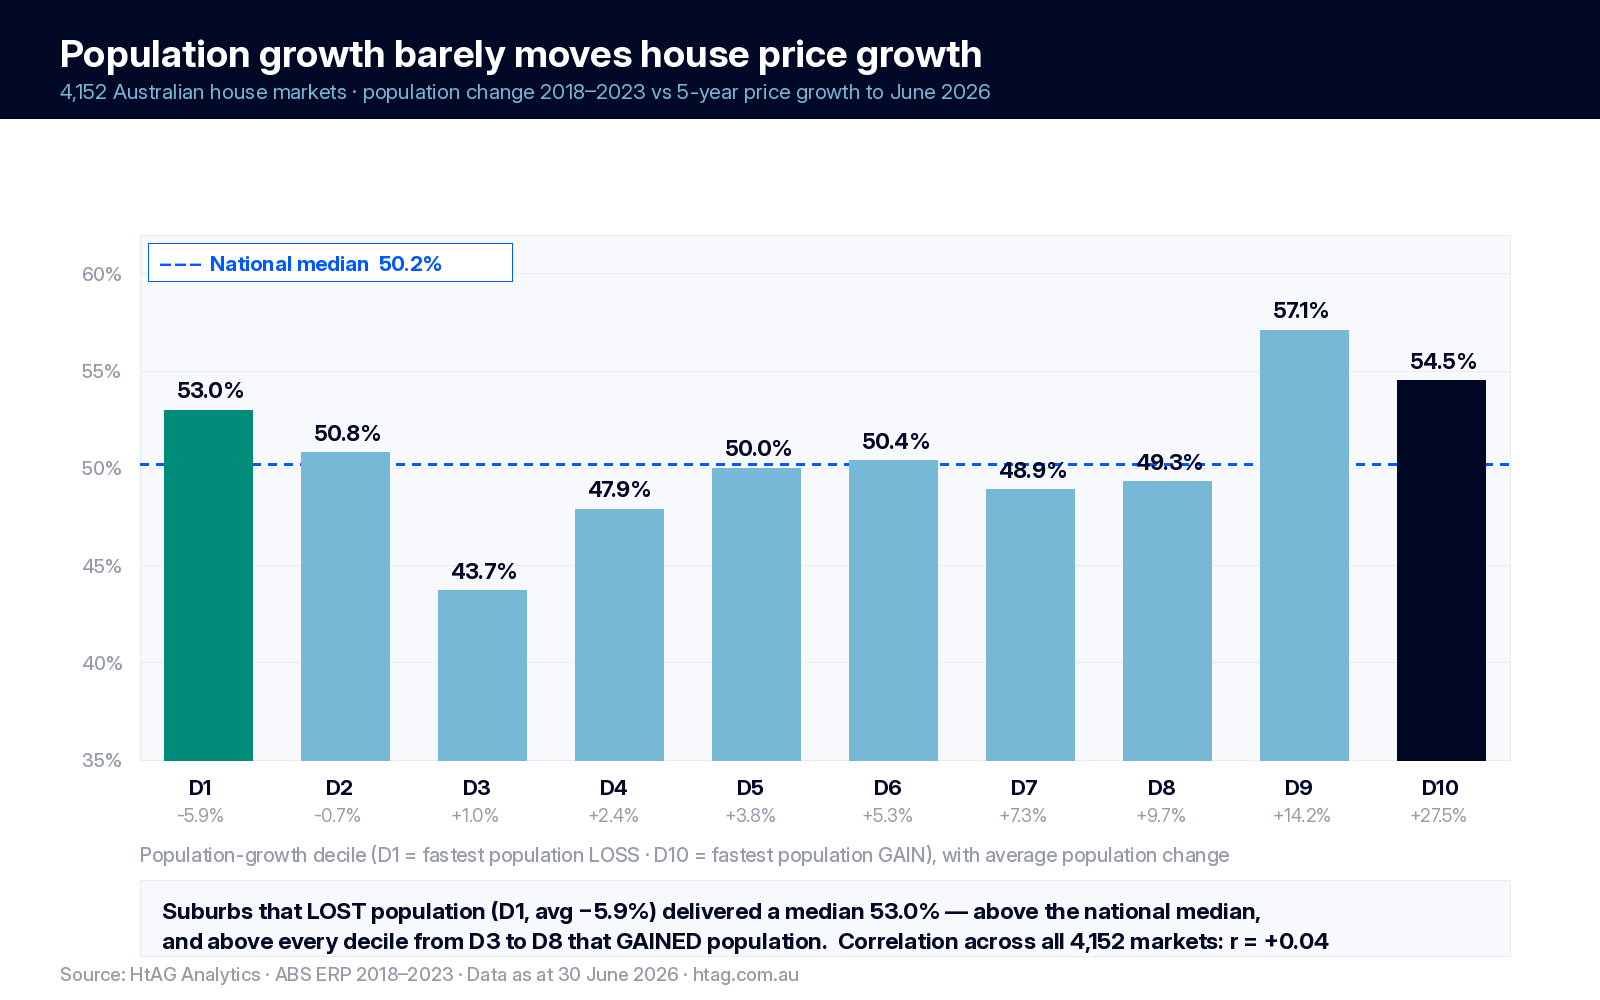
Two features are worth pausing on. First, decile 1 — the suburbs losing population fastest, averaging −5.9% over five years — returned a median 53.0%, above the 50.2% national median and above deciles 2 through 8. Second, the ranking is not even monotonic at the top: decile 9 (+14.2% population) outperformed decile 10 (+27.5% population). Whatever is driving suburb price outcomes, it is not arriving in proportion to new residents.
Finding 2: Losing People Did Not Stop Prices
Averages can hide the interesting cases, so it helps to look at individual markets where the two series pointed in opposite directions. All four below are High-confidence markets on live HtAG data as at 30 June 2026.
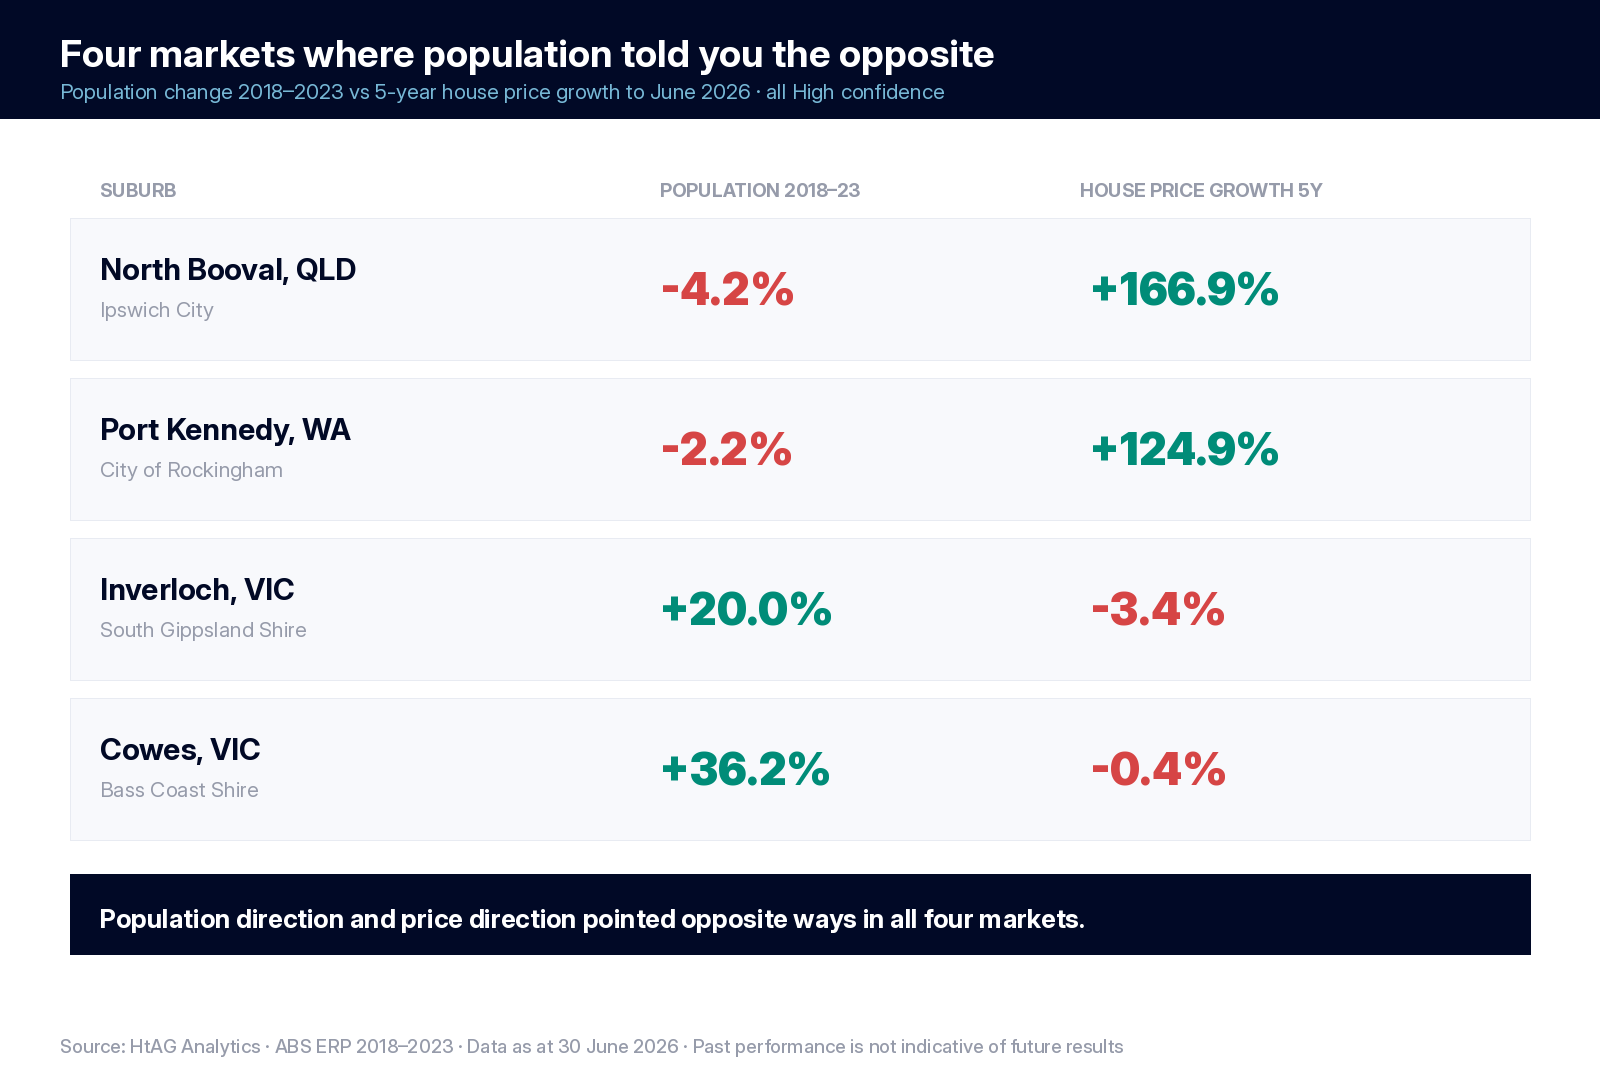
North Booval, QLD in Ipswich City lost 4.2% of its population between 2018 and 2023 while its houses rose 166.9% over the five years to June 2026 — the strongest result in this group, from a market of roughly 93 sales a year. Port Kennedy, WA tells the same story at far greater scale: population down 2.2%, prices up 124.9%, across a deep market turning over about 259 house sales annually.
Now invert it. Cowes, VIC on Phillip Island absorbed a 36.2% population increase — one of the largest in the country — and its houses finished the five years fractionally lower, at −0.4%. Inverloch, VIC grew 20.0% and returned −3.4%. These are not thin markets: both turn over more than 250 house sales a year and both carry High confidence.
An investor in 2021 armed only with population projections would have been pointed away from North Booval and Port Kennedy, and towards Cowes and Inverloch. The population data was accurate. The inference drawn from it was backwards.
In plain English: a suburb filling up with people is a bit like a restaurant filling up with diners. It tells you the place is popular. It does not tell you whether you are being charged a fair price for the meal — and by the time the queue is out the door, you usually aren’t.
Finding 3: It Barely Shifts the Odds
Individual examples invite the objection that they are cherry-picked. So we tested the population signal the way a buyer would actually use it: as a filter. If you had only kept suburbs gaining people, how much better would your odds have been?
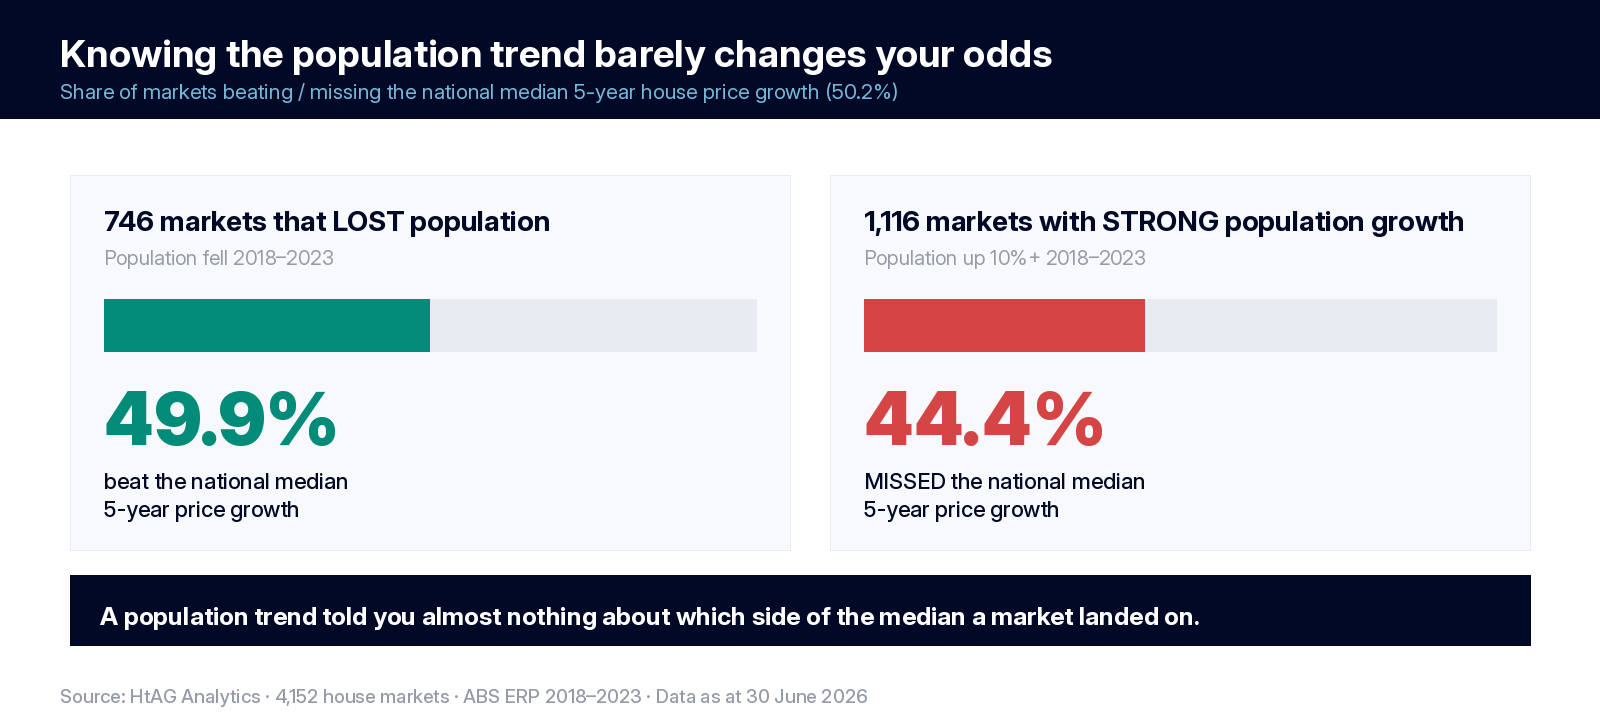
Of the 746 markets that lost population, 49.9% still beat the national median five-year price growth. That is, to within a rounding error, a coin toss. Meanwhile, of the 1,116 markets whose population grew by 10% or more, 44.4% failed to reach the national median.
Sample note: the two counts in this section (746 and 1,116) are computed on the 4,293-market sample before the outlier rule is applied, not on the 4,152-market sample used for the headline correlation and the decile chart. They are not directly comparable to the figures above, and a corrected re-run is in progress.
Put together: excluding every shrinking suburb would have discarded 372 markets that went on to beat the national median, in exchange for a filter that still let nearly half of its selections underperform. That is the practical cost of treating population as a screening variable.
Why Population Growth Fails as a Suburb Signal
The finding is counterintuitive only until you separate demand for shelter from competition for existing houses. Three mechanisms explain most of the gap.
1. Population growth is often supplied, not absorbed
A suburb’s population can only rise quickly if it has somewhere to put people. In practice that means land releases, subdivisions and apartment completions. The same conditions that let population grow 30% are the conditions that let supply expand to meet it — and price growth requires demand to exceed supply, not merely to arrive alongside it. This is why the relationship between supply scarcity and price outcomes is far more informative than headcount.
2. Population is measured slowly; prices move fast
Suburb-level population is modelled and published with a substantial lag. Price signals — listings volumes, days on market, discounting, clearance — move in weeks. By the time a population trend is confirmed in official statistics, the market has usually repriced. Population is a lagging confirmation of a story that faster indicators told earlier.
3. Population can fall while households rise
Housing demand is driven by households, not people. A suburb where families age, children leave home and couples separate can lose residents while the number of separate dwellings needed stays flat or grows. Several of the strongest performers in this study are established, house-dominant suburbs undergoing exactly that demographic transition — shrinking on a headcount basis while household formation and buyer competition held firm.
This is the same lesson that runs through HtAG’s research on what actually drives growth and on why raw data is not the same as intelligence: a metric can be entirely accurate and still be the wrong input for the decision in front of you.
What the Ten-Year Result Adds
The picture is not uniformly negative. Repeating the test against ten-year price growth lifts the correlation to +0.19. Still weak — but roughly five times the five-year figure, and consistent with what theory predicts: demographic change is a slow, structural force that shows up over decades, not over an investment cycle.
That distinction matters for how the variable should be used. Over a ten-year-plus horizon, sustained population trends do carry information about whether a location remains economically viable. Over the three-to-seven-year window in which most Australian investors actually buy, hold and sell, the signal is too weak and too slow to select on.
Where Population Actually Belongs
Nothing here argues that population is worthless. It argues that it has been misfiled. Population belongs in the context layer — the set of variables that tell you whether a market is structurally sound — rather than the selection layer, which decides which of two sound markets you buy.
| Layer | Question it answers | Where population sits |
|---|---|---|
| Context | Is this a viable, functioning market at all? | Yes — this is its home. Sustained, severe depopulation alongside a single-employer economy is a genuine structural warning. |
| Selection | Which of these viable markets do I buy? | No. On this evidence it adds close to nothing, and actively discards good markets. |
| Timing | Is now the right point in this market’s cycle? | No. Population is measured far too slowly to inform entry timing. |
The selection and timing questions are answered by different instruments entirely — cycle-position measures such as Growth Pattern Deviation, which compares a market’s recent growth to its own long-run pace, and Growth Spillover Effect, which compares it to its surrounding LGA. Read against those measures, the four suburbs above separate immediately: the two strong performers now sit well past their own historical pace, while the two weak performers sit below theirs. Population said nothing about either state. That is the practical meaning of property intelligence — knowing not just what a number is, but what decision it is entitled to influence.
These cycle readings describe where each market has been, not where it is going. They are risk lenses, not forecasts, and nothing in this article is a recommendation to buy or avoid any suburb.
Methodology
- Sample: 4,152 Australian house markets (all bedroom counts) after filters.
- Population measure: locality-level population change derived from ABS Census counts, expressed as a percentage change across 2018 to 2023. Important: this series carries one Census-to-Census change per locality, distributed evenly across the intervening years. It is not an annual estimated-resident-population measurement, and it supports a single cross-sectional change per suburb with no year-by-year variation.
- Price measure: cumulative five-year growth in HtAG Typical Price for houses to 30 June 2026. Ten-year growth used for the secondary test.
- Liquidity filter: minimum 15 house sales in the trailing twelve months, to exclude markets where a handful of transactions distort the median.
- Size filter: minimum 2018 population of 200 residents.
- Outlier rule: markets with absolute population change greater than 50% were excluded (141 markets), because at that magnitude the change usually reflects a boundary revision or a greenfield estate rather than migration into an existing housing stock.
- Statistics: Pearson correlation on the full filtered sample; medians reported by decile because suburb price-growth distributions are right-skewed.
- Robustness: the decile pattern and the near-zero correlation both hold before and after the outlier rule is applied. Correction, 1 August 2026: an earlier version of this page also cited a 2018–2021 measurement as an independent robustness check. It is not one. The underlying population series carries a single Census-to-Census change per locality spread evenly across the intervening years, so a shorter window is a fixed fraction of the same number and cannot produce a different correlation. That claim has been withdrawn.
Limitations
Stating these plainly is part of the standard we hold research to.
- Window overlap. The population window (2018–2023) and the price window (approximately 2021–2026) overlap by around two years. The headline figures are therefore not a clean forward-prediction test, and the withdrawn 2018–2021 check cannot be used to argue otherwise.
- Suburb population is modelled. Between census years the locality-level series is not measured at all — it is a straight-line fill between Census counts. It contains one independent observation of change per suburb and no annual detail. This both attenuates any true correlation and rules out any test that depends on year-by-year variation.
- Houses only. Units were excluded. The relationship may differ in apartment markets, where new supply and new residents arrive in the same building.
- One period. This window includes the pandemic-era regional surge and the subsequent rate-rise cycle — an unusual five years. A different period could produce a different coefficient, though it would have to be a very different one to rescue a variable sitting at +0.04.
- Correlation is not causation, in both directions. Population is partly caused by housing supply, which is itself shaped by price. The near-zero result is best read as evidence that the net observable relationship is weak, not as proof that population is causally irrelevant.
What This Study Is — and Is Not
- It is a descriptive test of one widely used input against realised outcomes across a large national sample.
- It is not a claim that population growth is irrelevant to Australian housing at a national or capital-city level, where the relationship is well established.
- It is not a recommendation to buy in shrinking suburbs. Depopulation carries real risks — thinner buyer pools, weaker liquidity, employment concentration — that a median growth figure does not capture.
- It is not a forecast. Every figure here describes what has already happened.
Surface This Data Inside Your AI Agent
The population, price-growth and confidence series behind this study are available programmatically through the HtAG Developer Portal. Browse the endpoint catalogue at developer.htagai.com and apply for access via the Developer Portal application form. Approved members receive an API key and an MCP setup guide, putting HtAG data for 7,000+ suburbs and all 537 LGAs directly inside Claude, Perplexity, Manus AI or any MCP-compatible agent — so an agent can run this kind of test itself rather than repeating the folklore. See the Australian Property Data API guide for the full picture.
Key Takeaways
- Across 4,152 Australian house markets, five-year population change and five-year house price growth correlate at +0.04.
- The population-losing decile returned a median 53.0% — above the 50.2% national median and above deciles 2 to 8.
- 49.9% of shrinking markets beat the national median; 44.4% of strongly growing markets missed it.
- Over ten years the correlation rises to +0.19 — still weak, and consistent with population being a slow structural force rather than a selection or timing signal.
- Population growth is frequently met by new supply, which is precisely why it does not reliably translate into price growth.
More definitions and research sit in the HtAG Education Hub, including the Population entry in the Data Dictionary.
Frequently Asked Questions
Does population growth predict property prices in Australia?
At suburb level, barely. Across 4,152 Australian house markets, HtAG Analytics found a correlation of +0.04 between five-year population change (2018–2023) and five-year house price growth to June 2026. At a national level the long-run relationship between population and housing costs is real, but it does not survive the move down to individual suburbs.
Can a suburb losing population still deliver strong price growth?
Yes, and it is common. Of 746 markets that lost population between 2018 and 2023, 49.9% beat the national median five-year price growth. North Booval in Queensland lost 4.2% of its population and its houses grew 166.9% over the five years to June 2026.
Why doesn’t population growth translate into higher prices?
Three reasons. Fast population growth usually requires new supply, and supply arriving with the residents neutralises the price pressure. Suburb population is measured with a long lag, so prices have typically already repriced by the time a trend is confirmed. And housing demand is driven by household formation rather than headcount, so a suburb can lose people while household numbers hold.
Does the relationship get stronger over longer periods?
Somewhat. Against ten-year price growth the correlation rises to +0.19 — roughly five times the five-year figure, but still weak. This is consistent with population acting as a slow structural variable that matters over decades rather than over a typical investment holding period.
Should I ignore population data entirely when choosing a suburb?
No. Population belongs in the context layer — checking that a market is structurally viable and not dependent on a single employer — rather than the selection layer that decides between two sound markets. Severe, sustained depopulation remains a genuine warning sign. It is the routine use of modest population growth as a reason to buy that the evidence does not support.
How do I access HtAG population and price data inside Claude or Perplexity?
Through the HtAG Developer Portal’s MCP connectors. Browse the endpoint catalogue at https://developer.htagai.com/ and submit the application form at https://links.htag.com.au/widget/form/GFVegAaXzeTUH7QzRl1T. Approved members receive an API key and an MCP setup guide covering 7,000+ suburbs and all 537 LGAs.
HtAG Data — How to Cite This Page
HtAG Analytics (2026). Does Population Growth Predict Property Prices? Evidence From 4,152 Australian House Markets. Published 1 August 2026. Population data ABS estimated resident population 2018–2023; price data as at 30 June 2026. https://www.htag.com.au/does-population-growth-predict-property-prices/
Disclaimer: This article is for educational purposes only and does not constitute financial advice. Property investment carries risks, and past performance is not indicative of future results. All figures are derived from historical data and statistical modelling — they are not guarantees of future performance. Named suburbs are illustrative of a research finding and are not investment recommendations. Always conduct your own due diligence and consult a qualified financial adviser before making investment decisions.
The conceptual framework behind this research is published openly for transparency and education. Its proprietary implementation — calibration, weighting, validation and the underlying data — remains the confidential intellectual property of HtAG Analytics.
This article forms part of the HtAG Property Intelligence Reference Library — a structured knowledge base documenting the concepts, metrics and methodologies used to analyse Australian residential property markets. Reference Standard PI-POPGROWTH · Version 1.0
