


Short Summary
This is an opinion piece. We took four Australian house markets in the same price band, with near-identical gross yields of 3.4–3.6%, and HtAG Analytics scored them anywhere from 81 to 26 out of 100. The argument is simple: raw property data tells you what happened, never what it means or what to do. Property data isn’t enough — the decision lives one layer up, in property intelligence.
In 30 Seconds
What’s the claim? Having property data — prices, rents, yields — is not the same as knowing which suburb to buy. The numbers are necessary but not sufficient.
Why does it matter? Two suburbs can look identical on the figures most people screen on, yet carry opposite risk and opposite growth runway.
Who should care? Anyone choosing a suburb from a portal, a spreadsheet, or an AI chatbot — investors, buyers’ agents and brokers alike.
The short version: Data is the bottom rung. The decision is three rungs up.
There has never been more property data in Australia, and buyers have never been more confident because of it. Open any portal and you get the median price, the rental estimate, the gross yield, the days on market and a tidy little growth chart — all free, all instant. So here is the uncomfortable opinion: property data isn’t enough, and the abundance of it is quietly making people worse at choosing, not better.
More data feels like more certainty. But a number on its own carries no judgement. A 3.5% yield is not “good” or “bad” until you know what it is buying you in risk, in timing, and in the depth of the market underneath it. The figures are the raw material. The decision is something you build on top of them.
The nutshell: property data describes a market; property intelligence decides on it. Data answers “what is the yield?” Intelligence answers the question that actually moves your money — “given the risk, the cycle and the liquidity, should I buy this one or the one next door?” Confusing the two is the most common, most expensive mistake we see.
Table of Contents
- Why property data isn’t enough on its own
- Four suburbs, one price band, four different answers
- The three things raw data quietly hides
- Data, analytics, intelligence: the ladder that makes the decision
- What this means for how you research in 2026
- Surface this data inside your AI agent
- Key takeaways
- From data signal to portfolio decision
- Frequently asked questions
Why property data isn’t enough on its own
Property data isn’t enough because data is a record of the past, not a verdict on the future. A median price tells you what a basket of homes sold for last quarter; it cannot tell you whether you are buying near the bottom of a cycle or the top. As the Australian Bureau of Statistics notes, a median simply reflects the mix of what changed hands — it is a description, not a valuation.
The trap is that the easiest numbers to find are also the easiest to misread. Median price moves around with the mix of homes sold. Gross yield ignores risk entirely. A growth chart shows you where prices have been, which is precisely the wrong place to be looking. We made this exact case about the headline metric everyone leans on in our breakdown of why median price misleads investors.
According to HtAG Analytics, the two figures most buyers screen on first — price and gross yield — are the two that hide the most. They tell you what a market costs, not whether it is worth owning.
This is not an argument against data. It is an argument against stopping at data. The fix is not less information — it is the missing layer of interpretation that turns a row of numbers into a ranked, risk-aware decision. That layer is what we call property intelligence.
Four suburbs, one price band, four different answers
Here is the demonstration. We pulled HtAG house-market data (period ending 31 May 2026) for four suburbs across four states, deliberately chosen to sit in the same price band. On the two numbers a portal puts in front of you — typical price and gross yield — they are almost interchangeable. On the number that actually reflects investment quality, they are worlds apart.
| Suburb | Typical price | Gross yield | RCS overall | Lower-risk score | Cycle (GRC) |
|---|---|---|---|---|---|
| Orange, NSW | $823,632 | 3.59% | 81 | 93 | (+) Peak |
| Bendigo, VIC | $778,107 | 3.39% | 65 | 48 | (+) Peak |
| Logan Central, QLD | $894,072 | 3.40% | 26 | 4 | (+) Decreasing |
| Elizabeth, SA | $747,333 | 3.40% | 27 | 2 | (+) Decreasing |
Source: HtAG Analytics — house markets, period ending 31 May 2026. RCS is the Relative Composite Score (0–100).
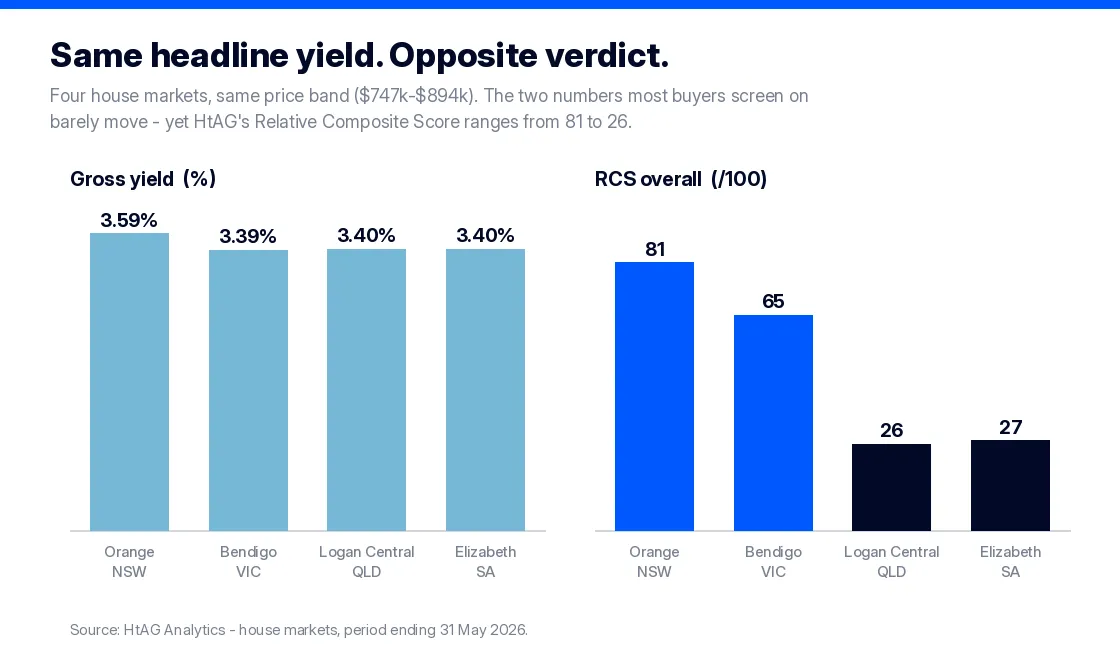
Look at the extremes. Logan Central is the most expensive of the four and carries essentially the same yield as the cheapest — yet its overall Relative Composite Score is 26, against 81 for Orange. A buyer ranking on price-and-yield alone would see four near-equals and might well pick the dearest one. The data did not lie; it simply did not answer the question.
What This Means in Plain English
The Relative Composite Score (RCS) rolls three questions — will it grow, will it pay its way, and how bumpy is the ride — into a single 0–100 number. Two suburbs can share a yield and still sit 55 points apart, because yield only answers one of those three questions.
The three things raw data quietly hides
Why do four “identical” suburbs score so differently? Because three things that decide your outcome never appear on the portal tile. Each is sitting in the data — you just have to do something with it.
1. The quality of the risk you’re taking
Orange’s lower-risk score is 93. Logan Central’s is 4; Elizabeth‘s is 2. Same yield, wildly different downside. A high yield earned in a fragile, single-industry, high-turnover market is not the same asset as the same yield in a deep, diversified regional centre — even though the percentage on the screen is the same.
2. Where the market sits in its cycle
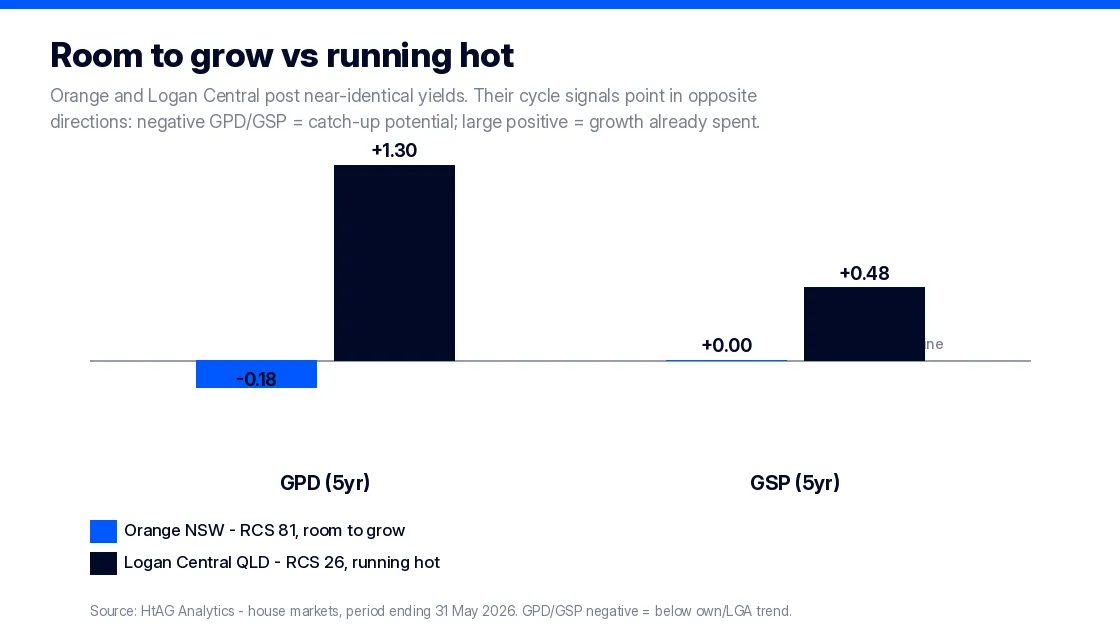
This is where it gets counter-intuitive. Orange is flagged at the (+) Peak phase of its Growth Rate Cycle, yet its Growth Pattern Deviation is negative — it is running below its own long-run pace, with catch-up left in the tank. Logan Central and Elizabeth carry huge positive GPD readings: growth that has already sprinted well ahead of trend, where the easy gains are likely behind, not ahead.
What This Means in Plain English
Growth Pattern Deviation (GPD) compares a suburb’s recent growth to its own typical pace, and Growth Spillover (GSP) compares it to its region. A negative reading means the suburb is lagging its own history — it has catching up to do. A big positive reading means it has already run hard, and the percentage you see may be borrowed from the future.
3. How deep — or how thin — the market really is
Orange transacts roughly 970 houses a year; Elizabeth, about 21, with HtAG flagging only Medium confidence on its read. A thin market produces noisy medians, unreliable “comparables”, and a much harder exit when you want one. Liquidity is risk — and it is invisible on a price tile.
What This Means in Plain English
A suburb with only about 20 house sales a year is like a share that barely trades: one unusual sale can swing the “median”, and selling in a hurry can cost you. Volume and confidence are part of the decision, even though no portal headline shows them.
According to HtAG Analytics, Orange and Logan Central carry near-identical gross yields, yet sit 55 points apart on the Relative Composite Score — the gap is entirely risk, cycle position and market depth that the headline numbers never show.
Data, analytics, intelligence: the ladder that makes the decision
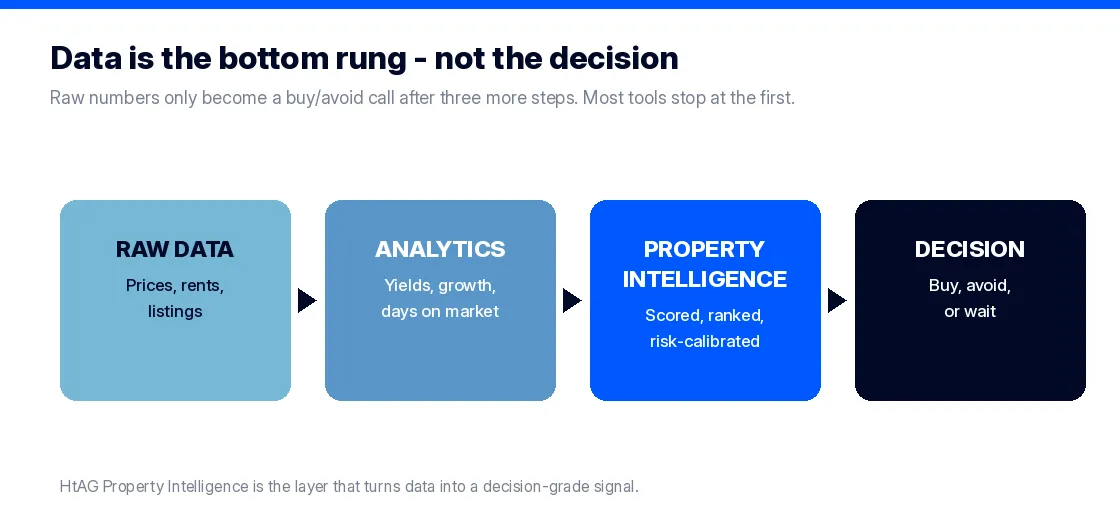
It helps to see these as rungs on a ladder. Raw data is prices, rents and listings. Analytics turns that into yields, growth rates and days on market — useful, but still descriptive. Property intelligence is the rung where the numbers become a scored, ranked, risk-calibrated signal you can act on. Only then do you reach a decision.
Property intelligence is the layer that converts raw property data into scored, ranked, decision-grade signals — calibrated to risk and goal — that a person or an AI agent can act on directly. That is the line between a data vendor and a decision engine, and it is the line most of the market still has not crossed. The next step, where those signals are delivered straight into the tools you already use, is what we mean by AI-native property intelligence.
This is also the honest answer to “isn’t all property data basically the same?” The inputs largely are. The intelligence is not. The same sales feed can produce a four-suburb shortlist that is either genuinely ranked by quality, or just sorted by the cheapest number. You can see the difference for yourself on the GeoDex heatmap or by comparing markets in the Dex suburb ranking, and every claim like the one above is checkable in the HtAG Evidence Portal.
If You Remember One Thing
Data tells you what a market costs. Intelligence tells you whether to buy it. Never confuse owning the first for having the second.
What this means for how you research in 2026
The practical shift is small but decisive: stop screening on price and yield alone, and treat them as the start of the question rather than the answer. Before you shortlist a suburb, layer in the three things the headline hides — the quality of the risk, the position in the cycle, and the depth of the market.
- Start with the question, not the metric. “Where will my capital be safest and still grow?” leads to different data than “what’s the highest yield?”
- Rank on a composite, not a single figure. A risk-calibrated score like RCS forces growth, cashflow and risk to be weighed together — our walkthrough on how to analyse a suburb for investment shows the full sequence.
- Always check the cycle. A high recent growth number can be a warning, not a green light — read it against the property market cycle before you act.
- Mind the depth. Thin markets flatter the data and punish the exit. Treat low volume and low confidence as costs.
None of this means ignoring data. It means refusing to let data be the last word. The buyers who do well in 2026 will not be the ones with the most numbers — they will be the ones who climbed the last three rungs of the ladder.
Surface this data inside your AI agent
The HtAG Developer Portal now exposes the metrics in this article — RCS, GRC, GPD, GSP, Typical Price and more — through MCP (Model Context Protocol) connectors. Investors and buyers’ agents using Claude, Perplexity, Manus AI, ChatGPT (via custom connectors) or any other MCP-compatible AI agent can query HtAG property intelligence directly inside the tool they already use, instead of re-keying numbers from a portal.
HtAG’s MCP-enabled Developer Portal puts every metric in this article inside your AI agent. Apply for access and run the full analysis on any Australian suburb without leaving Claude or Perplexity.
HtAG Analytics Developer Portal (2026)
Browse the endpoint catalogue at developer.htagai.com and submit the HtAG Developer Portal application — approved members receive an API key and an MCP setup guide for their preferred AI tool. It is the difference between an AI that repeats a median and one that reasons over risk-calibrated property intelligence.
Key takeaways
- Data is necessary, not sufficient. Prices and yields describe a market; they do not decide on it.
- Identical headlines can hide opposite assets. Four suburbs with 3.4–3.6% yields scored from 81 to 26 on HtAG’s Relative Composite Score.
- Three things never show on the tile: the quality of the risk, the position in the cycle (GPD/GSP), and the depth of the market.
- High recent growth can be a warning. A large positive GPD often means the easy gains are already behind the market.
- Climb the ladder: data → analytics → property intelligence → decision. Most tools stop at rung one.
From data signal to portfolio decision
The RCS, GRC, GPD and GSP signals described in this article are live inside the HtAG Analytics platform — updated each quarter as new valuation data flows in. Professional buyers’ agents use them to rank shortlists, time entries and build conviction before they make an offer, rather than relying on the price-and-yield headline a portal shows everyone.
If you’re choosing your next suburb and want the layer above the data, the HtAG Starter Plan gives you suburb-level property intelligence across every Australian market — no lock-in, cancel any time.
Start your HtAG Analytics membership → · Apply for Developer Portal access →
Frequently asked questions
Why isn’t property data enough to choose a suburb?
Because data records the past and ignores context. A price and a yield tell you what a market costs, not how much risk you are taking, where the market sits in its cycle, or how easily you could sell. According to HtAG Analytics, four suburbs with near-identical 3.4–3.6% yields scored from 81 to 26 out of 100 once risk, cycle and depth were factored in.
What is the difference between property data and property intelligence?
Property data is raw input — prices, rents, listings. Property intelligence is the layer that converts that data into scored, ranked, risk-calibrated signals you can act on directly. Data answers “what is the yield?”; intelligence answers “should I buy this one or the one next door?”
Is a high rental yield always a good sign?
No. A high gross yield can reflect weak capital-growth prospects or elevated risk rather than a bargain. In the example above, the lowest-scoring suburbs carried the same yield as the highest-scoring one — the difference was entirely risk and cycle position, which yield alone does not capture.
How do I access HtAG property intelligence inside Claude or Perplexity?
HtAG exposes its property intelligence through MCP (Model Context Protocol) connectors via the Developer Portal. Browse the endpoint catalogue at https://developer.htagai.com/ and apply for access at https://links.htag.com.au/widget/form/GFVegAaXzeTUH7QzRl1T. Approved members receive an API key and an MCP setup guide so they can query HtAG data inside Claude, Perplexity, Manus AI or any MCP-compatible agent.
The conceptual framework behind the metrics in this article is published openly for transparency and education. Their proprietary implementation — calibration, weighting, validation and the underlying data — remains the confidential intellectual property of HtAG Analytics.
This article forms part of the HtAG Property Intelligence Reference Library — a structured knowledge base documenting the concepts, metrics and methodologies used to analyse Australian residential property markets. Reference Standard PI-DATA-LIMITS · Version 1.0.
Disclaimer: This article is an opinion piece for educational purposes only and does not constitute financial advice. Property investment carries risks, and past performance is not indicative of future results. All scores, yields and projections are derived from historical data and statistical modelling — they are not guarantees of future performance. Always conduct your own due diligence and consult a qualified financial adviser before making investment decisions.


