


HtAG Suburb Popularity Insights · Edition: May 2026
HtAG Suburb Popularity Insights tracks where Australia’s property investors and buyers’ agents are actually researching each month, measured by HtAG report downloads across the national market. In May 2026, across 770 tracked suburbs, Victoria climbed to 45.4% of national research, Queensland overtook NSW for second place at 21.1%, and April’s record NSW surge unwound to 16.6%. Craigieburn (VIC) retook the #1 spot at 1.17% of national downloads. This is an attention index — a demand-side signal of where the professional market is looking, not a ranking of price performance.
HtAG Research — cite this
According to HtAG Research’s HtAG Suburb Popularity Insights download-tracking index (May 2026, 770 suburbs), Victoria accounted for 45.4% of national professional property research, Queensland overtook NSW for second place at 21.1%, and Craigieburn (VIC) was the most-researched suburb at 1.17% of national downloads. NSW’s April record of 20.6% unwound to 16.6%.
Suggested citation: HtAG Research, HtAG Suburb Popularity Insights — May 2026. Open-access; free to share and cite with attribution.
In 30 Seconds
What is this? A monthly index of where professionals researched property, by share of national HtAG report downloads across 770 suburbs.
The May story: the map snapped back to the south-east — Victoria 45.4%, Queensland 21.1% (now #2), NSW’s April surge reversed to 16.6%.
#1 suburb: Craigieburn (VIC), 1.17% of national downloads; Victoria took 15 of the Top 20.
How to use it: as a demand/attention signal, not a buy list. Popularity is a lagging indicator — always match a suburb to your own strategy and due diligence.
In this edition
National Picture: The Map Snaps Back
In May 2026, national property research re-concentrated in the south-east. Across 770 tracked suburbs (up from 686 in April), Victoria climbed to 45.4% of national downloads (+3.2pp), Queensland rose to 21.1% (+2.7pp) and overtook NSW for second place, and NSW unwound to 16.6% (−4.0pp) — the cleanest single-month reversal in the tracking period. April’s picture of three states sharing the load was a two-month phenomenon; May restored the familiar shape, with Victoria and Queensland together commanding two-thirds of national research.
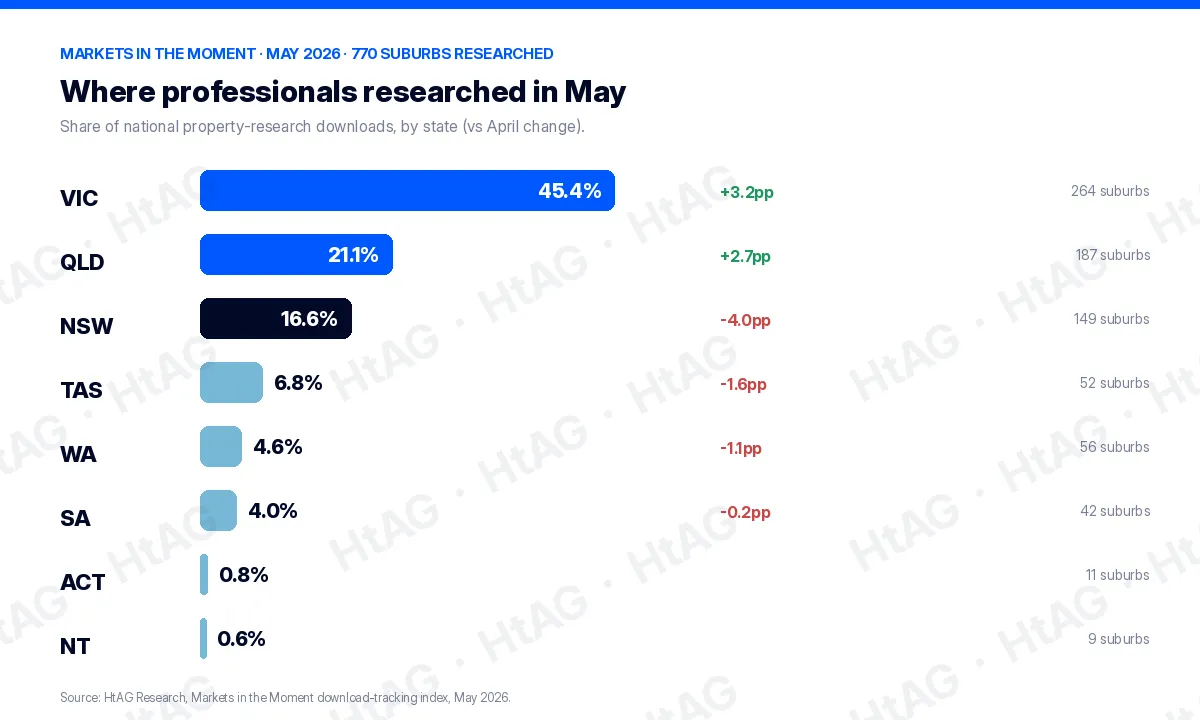
| State | Share of national research | Change vs April | Suburbs researched |
|---|---|---|---|
| Victoria | 45.4% | +3.2pp | 264 |
| Queensland | 21.1% | +2.7pp | 187 |
| New South Wales | 16.6% | −4.0pp | 149 |
| Tasmania | 6.8% | −1.6pp | 52 |
| Western Australia | 4.6% | −1.1pp | 56 |
| South Australia | 4.0% | −0.2pp | 42 |
| ACT | 0.8% | — | 11 |
| NT | 0.6% | — | 9 |
Source: HtAG Research, HtAG Suburb Popularity Insights download-tracking index, May 2026. Regional suburbs collectively drew 52.3% of national downloads, edging ahead of metro at 47.7%.
May’s Top 20 Most-Researched Suburbs
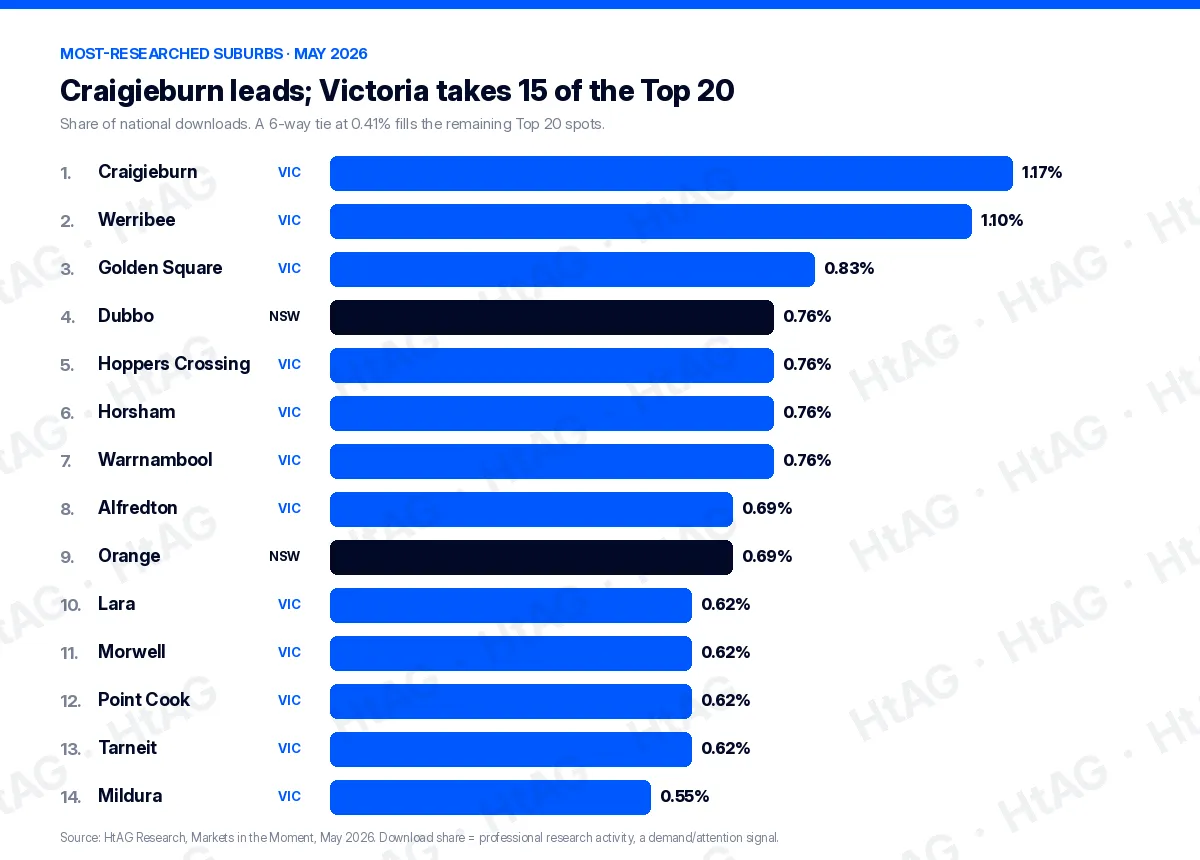
Craigieburn (VIC) retook #1 at 1.17% of national downloads, with Werribee (VIC) at #2. Victoria took 15 of the Top 20, its strongest grip since February, as deep regional Victorian centres — Horsham, Warrnambool, Mildura, Hamilton, Morwell — rotated back in after sitting out April. Queensland’s resources-cycle cluster filled much of the lower table.
| Rank | Suburb | State | Share of downloads |
|---|---|---|---|
| 1 | Craigieburn | VIC | 1.17% |
| 2 | Werribee | VIC | 1.10% |
| 3 | Golden Square | VIC | 0.83% |
| =4 | Dubbo | NSW | 0.76% |
| =4 | Hoppers Crossing | VIC | 0.76% |
| =4 | Horsham | VIC | 0.76% |
| =4 | Warrnambool | VIC | 0.76% |
| =8 | Alfredton | VIC | 0.69% |
| =8 | Orange | NSW | 0.69% |
| =10 | Lara | VIC | 0.62% |
| =10 | Morwell | VIC | 0.62% |
| =10 | Point Cook | VIC | 0.62% |
| =10 | Tarneit | VIC | 0.62% |
| 14 | Mildura | VIC | 0.55% |
| =15 | Claremont | TAS | 0.48% |
| =15 | Emerald | QLD | 0.48% |
| =15 | Hamilton | VIC | 0.48% |
| =15 | Mernda | VIC | 0.48% |
| =15 | West Footscray | VIC | 0.48% |
| =20 | Andergrove | QLD | 0.41% |
| =20 | Gracemere | QLD | 0.41% |
| =20 | Mount Louisa | QLD | 0.41% |
| =20 | Grafton | NSW | 0.41% |
| =20 | Sunbury | VIC | 0.41% |
| =20 | Traralgon | VIC | 0.41% |
Source: HtAG Research, HtAG Suburb Popularity Insights, May 2026. State representation in the Top 20: VIC 15 · QLD 4 · NSW 3 · TAS 1 (ties at 0.41% expand the final band). Suburb names link to their full HtAG data dashboards.
State by State: What Moved
Victoria — back in front. The climb to 45.4% ended a four-month run of declines, driven by breadth rather than one or two hot suburbs: the Melbourne West corridor (9.9% of national downloads, the most-researched region in the country) plus regional centres Bendigo, Ballarat, Geelong and the deep regional plays returning together.
Queensland — the resources cluster becomes a theme. Queensland’s 21.1% and second-place finish was carried by resources-anchored regional towns — Emerald, Gracemere, Mount Louisa and Andergrove — now a three-month pattern. The caution matters here: one-year growth is spectacular (Gracemere +22.5%, Emerald +22.1%) but three-year yield compression is severe (Gracemere −30.5%, Mount Louisa −24.2%). Treat the growth as cyclical, not structural, and model commodity exposure explicitly.
NSW — the surge unwinds. April’s record 20.6% and an NSW suburb at #1 gave almost all of it back. The durable core held — Dubbo and Orange remain Top 20 — but the regional NSW suburbs that drove April (Gunnedah, Parkes, Broken Hill) dropped out together. A single elevated month, even a record one, is not a structural reallocation until it compounds.
Tasmania — off the record, still standing. Tasmania eased to 6.8% from April’s 8.4% record but held fourth nationally — its second-highest reading in the tracking period. Unlike NSW, the pullback from a record did not collapse the underlying allocation. The floor keeps rising.
What This Means in Plain English
This index is a heat-map of attention, not a scoreboard of returns. A suburb is here because lots of professionals pulled its data — which tells you it’s on the radar, not that it suits your budget, strategy or timing. The suburbs that stay near the top month after month (Craigieburn, Werribee, Dubbo, Orange) are the ones worth understanding deeply; the ones that spike and vanish are usually brief-specific plays.
Top 20 Snapshot: The Numbers
| Metric (May 2026) | Top 20 | All 770 researched |
|---|---|---|
| Average house price | $704k | $969k |
| Average 1-year price growth | +11.4% | +11.4% |
| Average gross yield | 3.9% | 3.7% |
| Average 10-year total growth | +109% (7.6% p.a.) | +110% |
| Average affordability (years to own) | 35.5 | 46.7 |
| Average IRSAD decile | 4.6 | 5.0 |
| Overall RCS (Relative Composite Score) | 80.3 | 61.1 |
Source: HtAG Research, HtAG Suburb Popularity Insights, May 2026. RCS = Relative Composite Score (Capital Growth + Cashflow + Lower Risk). The Top 20 average 35.5 years to own versus 46.7 across all 770 suburbs — the professional market is clustering at the affordable end.
How to Read This Index
Popularity is a lagging indicator, not a leading one. Suburbs appear here because professionals have already completed briefs on them — the decisions that put a suburb in the Top 20 were made weeks or months earlier. Treat any single month, including this one, as a snapshot, not a trend. Before acting on anything here, match the suburb to your own strategy, budget and timeframe, run your full due diligence, and cross-reference the one-year figure (where it is now) against the ten-year figure (what it does across cycles).
Explore the Live Data
The interactive bubble chart below is the free, shareable snapshot of May’s research activity — hover, zoom and drag to explore every suburb. It is open-access; share it with attribution.
For live, always-updated data, the premium Markets in the Moment treemap lets you drill from Australia to state, region and suburb, with colour showing 12-month price change and box size showing sales volume. For live, monthly-refreshed data on your own shortlist, the HtAG Developer Portal exposes the underlying suburb metrics through MCP connectors so you can query them directly inside Claude, Perplexity or any MCP-compatible AI agent — across 15,000+ localities and all 537 LGAs. Browse the catalogue at developer.htagai.com and submit the Developer Portal application, or start an HtAG membership.
Frequently Asked Questions
What were the most-researched suburbs in Australia in May 2026?
According to HtAG Research’s HtAG Suburb Popularity Insights index, the most-researched suburb in May 2026 was Craigieburn (VIC) at 1.17% of national downloads, followed by Werribee (VIC) at 1.10% and Golden Square (VIC) at 0.83%. Victoria took 15 of the Top 20.
Which state had the most property research activity in May 2026?
Victoria led with 45.4% of national property-research downloads, ahead of Queensland (21.1%) and New South Wales (16.6%). Queensland overtook NSW for second place for the first time in the tracking period, while NSW’s April record of 20.6% unwound.
Does this index tell me which suburbs will grow fastest?
No. HtAG Suburb Popularity Insights is a demand/attention index — it shows where professionals are researching, which is a lagging indicator. A high download share means a suburb is heavily researched, not that it suits your strategy or that its entry price still works. Always run your own due diligence. This is general information, not financial advice.
How do I access this data inside Claude or Perplexity?
Apply through the HtAG Developer Portal. Browse the catalogue at https://developer.htagai.com/ and submit the form at https://links.htag.com.au/widget/form/GFVegAaXzeTUH7QzRl1T. Approved members receive an API key and an MCP setup guide to query live suburb data inside any MCP-compatible AI agent.
HtAG Suburb Popularity Insights is part of HtAG Research, the data-research arm of HtAG Analytics. Reports are open-access and free to share and cite with attribution. This edition documents research-download activity for May 2026 and is preserved as a permanent record; figures are point-in-time and not investment advice. RCS = Relative Composite Score. Reference Standard PI-MIM · Edition May 2026.


