


Short Summary
HtAG Research scored 2,386 credible Australian house markets for structural risk — the exposure of today’s prices to oversupply, weak liquidity, a late-cycle position and a thin resilience buffer — using HtAG Analytics data to 31 May 2026. 108 suburbs (the top ~4.5%) carry high structural risk, and Queensland holds 54 of them, led by the Fraser Coast and south-east growth corridors. The riskiest market nationally is Woodgate, QLD (score 86). This is a risk lens, not a forecast — a high score is a flag for deeper due diligence, not a prediction of price falls.
On this page
The 2026 risk picture
Australia’s housing debate usually asks where to buy. This report asks the opposite question: which house markets carry the most structural risk in 2026? Using HtAG Analytics data to 31 May 2026, we scored every Australian house market with high data confidence — 2,386 suburbs in all — on the forces that make today’s prices vulnerable: rental and stock oversupply, weak sales liquidity, a late-cycle “run-hot” price position, a forward building pipeline, and a thin resilience buffer. The result is a transparent 0–100 Structural Risk Score and a ranked list of the riskiest suburbs in Australia.
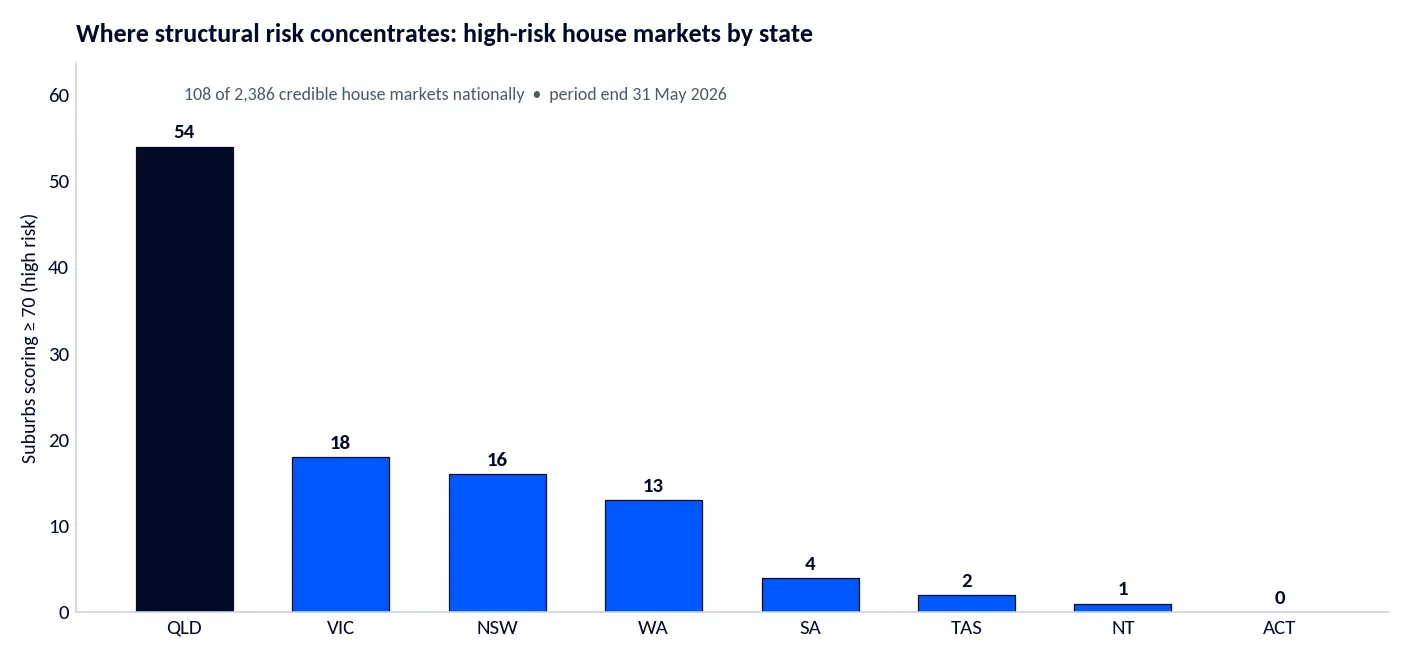
The headline: 108 suburbs — the riskiest ~4.5% nationally — score 70 or higher. They cluster in two recognisable places: coastal lifestyle markets (the Fraser Coast around Hervey Bay is heavily represented) and outer land-release corridors in Melbourne’s west, Sydney’s north-west and the NSW Hunter. A third, smaller group are single-industry towns such as the Bowen Basin coal centre of Dysart, where the risk is the commodity cycle rather than a building boom.
According to HtAG Analytics, 108 of 2,386 credible Australian house markets carry high structural risk in 2026 — and Queensland alone accounts for 54 of them.
How the Structural Risk Score works
Every house market with high data confidence (broadly 50+ sales a year), at least 20 annual sales and 150 or more dwellings is scored against the national distribution on thirteen risk metrics. Each metric’s national percentile becomes a 0–100 sub-score; the sub-scores are combined with fixed, published weights into one Structural Risk Score. Higher means more structural risk. The five pillars and weights are:
- Oversupply & vacancy (34): rental vacancy rate (15), short-term vacancy trend (9), inventory / months of supply (10).
- Liquidity & demand softness (22): days on market (10), vendor discounting (7), stock-on-market % (5).
- Late-cycle / running hot (18): 5-year Growth Pattern Deviation (10), growth-rate-cycle phase (8).
- Forward supply pipeline (6): building-approvals ratio (6).
- Structural resilience deficit (20): RCS Lower-Risk inverted (12), hold period inverted (4), economic-diversity index inverted (2), mining/agriculture dominance inverted (2).
What this means in plain English
A suburb scores high when too much stock is coming to market or sitting unrented, homes take longer to sell and are discounted, prices have run well ahead of their own history, a building pipeline is still feeding in, and little in the fundamentals cushions a downturn. Because scores are relative to other credible Australian house markets, a 70+ puts a suburb in the riskiest few per cent nationally.
National ranking — the 25 riskiest suburbs in Australia 2026
The table below lists the 25 highest Structural Risk Scores nationally. “GPD-5” is the 5-year Growth Pattern Deviation (positive = running hot versus a suburb’s own history); “GRC phase” is the growth-rate-cycle position; “RCS-LR” is the RCS Lower-Risk score (lower = riskier).
| # | Suburb | State | Typical price | Score | Vac %% | Inv mo | DOM | GPD-5 | GRC phase | RCS-LR |
|---|---|---|---|---|---|---|---|---|---|---|
| 1 | Woodgate | QLD | $1,002,379 | 86 | 1.6 | 6.6 | 83 | 0.60 | (+)Decreasing | 10 |
| 2 | Oakville | NSW | $1,363,563 | 85 | 2.8 | 7.1 | 62 | 0.05 | (+)Peak | 20 |
| 3 | Craignish | QLD | $1,086,523 | 84 | 10.3 | 4.9 | 69 | 0.50 | (+)Peak | 38 |
| 4 | Plainland | QLD | $1,079,033 | 84 | 4.2 | 4.0 | 50 | 1.76 | (+)Decreasing | 29 |
| 5 | Nikenbah | QLD | $1,145,651 | 84 | 4.0 | 6.4 | 43 | 0.71 | (+)Decreasing | 52 |
| 6 | Lochinvar | NSW | $988,382 | 82 | 6.7 | 2.5 | 43 | 0.57 | (+)Decreasing | 18 |
| 7 | Dysart | QLD | $287,155 | 82 | 4.8 | 4.0 | 87 | 0.40 | (+)Peak | 6 |
| 8 | Tin Can Bay | QLD | $935,130 | 82 | 1.7 | 4.6 | 111 | 0.80 | (+)Decreasing | 3 |
| 9 | Burrum Heads | QLD | $952,961 | 81 | 7.7 | 5.2 | 56 | 0.59 | (+)Peak | 32 |
| 10 | Thornhill Park | VIC | $921,839 | 81 | 5.5 | 4.9 | 55 | 0.12 | (+)Peak | 13 |
| 11 | Wondunna | QLD | $1,063,084 | 80 | 9.7 | 3.0 | 63 | 0.73 | (+)Decreasing | 62 |
| 12 | Yarrabilba | QLD | $870,037 | 80 | 2.1 | 3.4 | 35 | 0.90 | (+)Decreasing | 3 |
| 13 | Rockbank | VIC | $699,393 | 80 | 6.4 | 3.2 | 56 | 1.13 | (+)Peak | 87 |
| 14 | Bunbury | WA | $1,229,429 | 80 | 1.6 | 4.0 | 67 | 0.73 | (+)Decreasing | 2 |
| 15 | Katanning | WA | $396,207 | 79 | 1.6 | 5.4 | 90 | 0.80 | (+)Decreasing | 19 |
| 16 | Toogoom | QLD | $1,002,112 | 79 | 3.9 | 9.8 | 49 | 0.48 | (+)Decreasing | 35 |
| 17 | Grantville | VIC | $719,462 | 79 | 4.6 | 8.9 | 91 | -0.24 | (+)Peak | 51 |
| 18 | Gables | NSW | $1,739,808 | 79 | 3.8 | 4.5 | 44 | 0.74 | (+)Decreasing | 12 |
| 19 | Clifton Beach | QLD | $1,148,383 | 78 | 2.1 | 3.1 | 102 | 0.43 | (+)Decreasing | 24 |
| 20 | Two Rocks | WA | $873,233 | 78 | 4.5 | 4.3 | 34 | 1.38 | (+)Decreasing | 52 |
| 21 | North Coogee | WA | $2,326,712 | 78 | 2.5 | 3.9 | 75 | 0.94 | (+)Decreasing | 44 |
| 22 | Scarness | QLD | $828,760 | 78 | 2.3 | 3.1 | 33 | 0.68 | (+)Decreasing | 14 |
| 23 | Yarrawonga | VIC | $705,645 | 78 | 2.7 | 7.6 | 72 | -0.05 | (+)Peak | 66 |
| 24 | Logan Village | QLD | $1,382,658 | 77 | 2.9 | 3.1 | 40 | 0.57 | (+)Decreasing | 29 |
| 25 | Tenterfield | NSW | $665,653 | 77 | 1.7 | 6.0 | 53 | 0.75 | (+)Decreasing | 39 |
Source: HtAG Analytics, market data to 31 May 2026 (houses, all bedrooms).
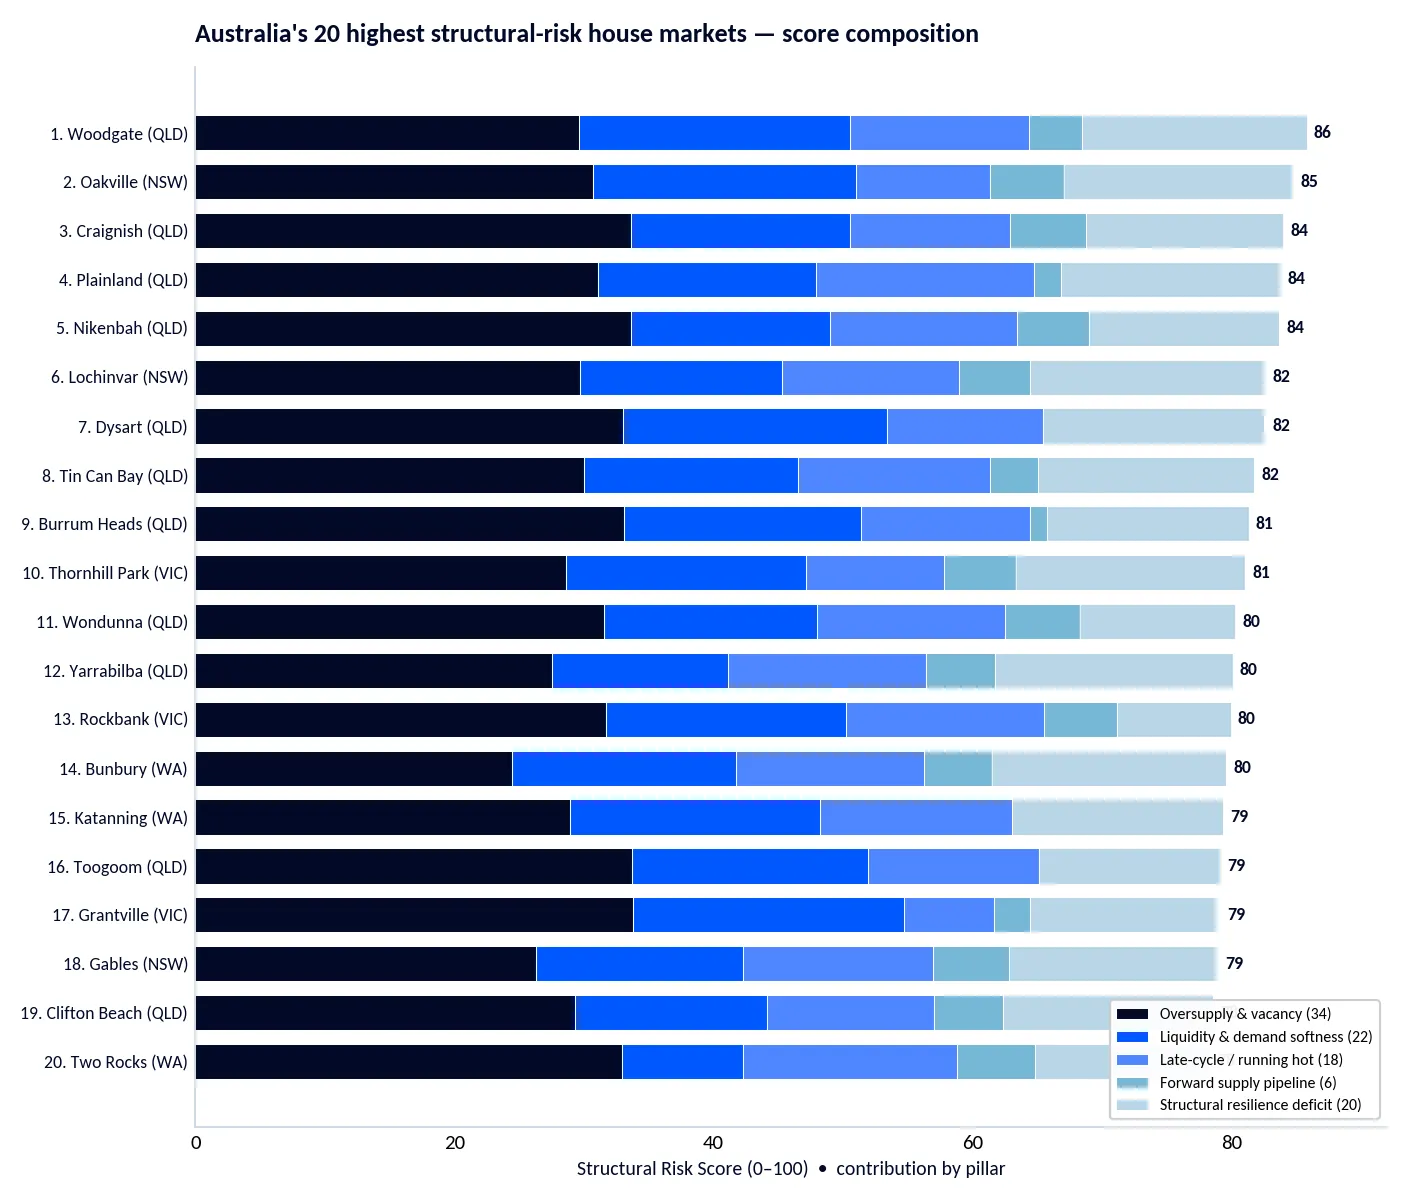
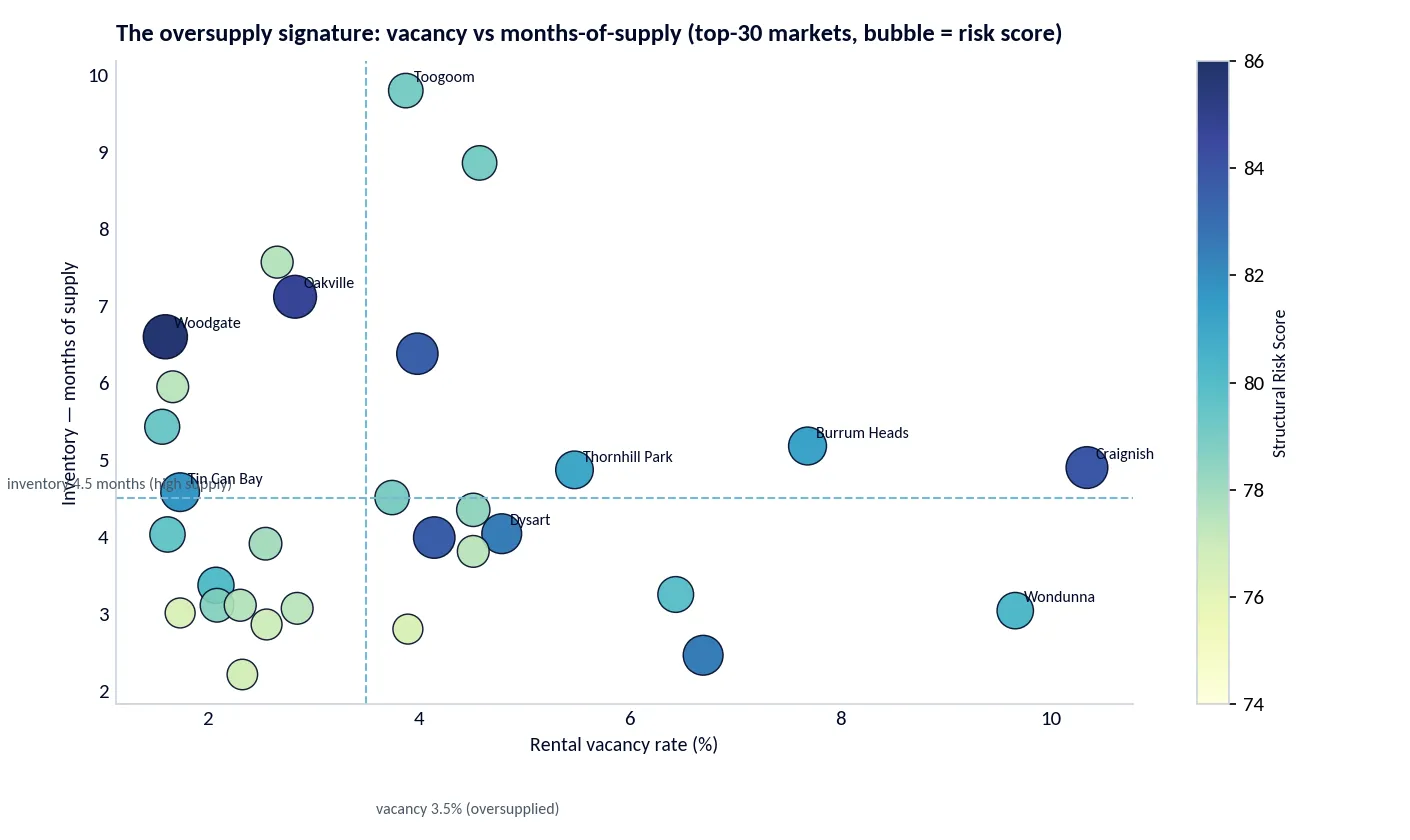
HtAG Analytics data shows the riskiest markets share a signature: oversupply and weak liquidity layered on top of prices that have already run hot, with little resilience left in reserve.
Where the risk concentrates — state breakdown
| State | Markets scored | High-risk (≥70) | Avg score | Max score | Top-risk suburb |
|---|---|---|---|---|---|
| QLD | 525 | 54 | 57.6 | 85.7 | Woodgate |
| VIC | 498 | 18 | 47.8 | 81.0 | Thornhill Park |
| NSW | 643 | 16 | 49.8 | 84.7 | Oakville |
| WA | 288 | 13 | 56.1 | 79.5 | Bunbury |
| SA | 276 | 4 | 48.6 | 71.8 | Elizabeth Downs |
| TAS | 70 | 2 | 48.7 | 72.7 | St Helens |
| NT | 33 | 1 | 52.4 | 71.9 | Sadadeen |
| ACT | 53 | 0 | 40.1 | 70.0 | Throsby |
Queensland accounts for roughly half of all high-risk markets, concentrated on the Fraser Coast and in south-east growth corridors. Victoria’s and New South Wales’ exposure sits in outer land-release corridors (Melton; Sydney’s north-west and the Hunter). Western Australia’s risk splits between regional centres such as Bunbury and the fast-building northern-beaches corridor around Two Rocks.
The ten riskiest markets — local context & catalysts
Scores describe the data; the stories explain the risk. Each of the ten highest-risk markets is profiled below with its key metrics and, where relevant, the named projects and primary sources behind the pressure.
Bundaberg-region coastal lifestyle market with thin, discretionary demand: long days-on-market (83), deep vendor discounting (5.2%) and the lowest RCS Lower-Risk score in the top group (10).
Inside Sydney’s North West Priority Growth Area, where land continues to be rezoned and released. An unusually short 2.9-year hold period and 7.1 months of inventory point to rapid turnover into a thickening pipeline. NSW Department of Planning — North West Growth Area.
Fraser Coast / Hervey Bay fringe. HtAG records an extreme suburb-level house vacancy of 10.3%. This sits well above the tight Fraser Coast LGA average and reflects a thin rental sample plus new-estate additions on large lots — a localised pocket signal, not a region-wide reading. PRD Hervey Bay Market Update, Jun 2026.
Lockyer Valley growth hub anchored by the Plainland Crossing master-planned community and a council-approved retail precinct; named a fastest-growing area in the council’s 2025 development report. Five-year house growth of +187% leaves little headroom. Lockyer Valley Regional Council — Development Status Report 2025.
Fraser Coast corridor adjoining Hervey Bay carrying high inventory (6.4 months), elevated vacancy (4.0%), a short 3.8-year hold period and a 2.7% building-approvals ratio — a classic late-cycle oversupply profile.
A designated Maitland urban release area. The council’s Local Housing Strategy 2041 plans roughly 1,260 new dwellings a year with Lochinvar a key front. Vacancy is 6.7% and rising against a low RCS Lower-Risk of 18. Maitland City Council — Local Housing Strategy 2041.
A Bowen Basin coal town dependent on a single industry (BMA mines including Caval Ridge and Saraji), with the weakest economic-diversity profile in the top group. Resource-cycle swings have repeatedly whipsawed local housing. The risk here is commodity-cycle, not a building pipeline. University of Queensland — Gas & Energy Transition Research Centre.
A Gympie-region coastal village where houses take a median 111 days to sell — a clear demand and affordability constraint. Lifestyle-led demand and flood/elevation due-diligence add caution.
Fraser Coast coastal market carrying high vacancy (7.7%) and elevated inventory (5.2 months); holiday and lifestyle demand make absorption sensitive to sentiment and borrowing costs.
A Melton (western Melbourne) growth-corridor estate with a textbook oversupply signature — roughly 112 rentals advertised against 99 homes for sale in a recent month, 5.5% vacancy and a low RCS Lower-Risk of 13. A HAPI of 9 shows crowded buyer attention at the top of a land-release wave.
Macro backdrop
Structural risk does not act alone. The Reserve Bank of Australia raised the cash rate to 4.35% on 5 May 2026 — following moves to 3.85% in early February and 4.10% on 17 March — marking a renewed tightening cycle (RBA media releases, 2026). Higher repayments lift holding costs in exactly the discretionary, lifestyle and recently built markets that dominate this ranking. The cushion is that arrears remain contained: the RBA’s March 2026 Financial Stability Review reports housing-loan arrears “low and … continued to decline,” even as survey measures of mortgage stress edged higher after the rate rises. The risk is therefore one of demand and liquidity — slower sales, longer marketing, softer rents — rather than forced selling, for now.
Surface this data inside your AI agent
HtAG’s suburb data can be queried directly inside Claude, Perplexity, ChatGPT and other AI tools via the HtAG Developer Portal.
Explore the Developer PortalApply for accessKey takeaways
- 108 of 2,386 credible Australian house markets (~4.5%) carry high structural risk on HtAG data to 31 May 2026.
- Risk concentrates in coastal lifestyle markets (especially the Fraser Coast) and outer land-release corridors, plus single-industry towns such as Dysart.
- The dominant drivers are oversupply and weak liquidity, amplified by run-hot prices with little cyclical headroom.
- A tightening rate path (cash rate 4.35%) raises the stakes for discretionary, recently built markets.
- A high score is a flag for deeper due diligence — not a prediction of price falls.
Frequently asked questions
What are the riskiest suburbs in Australia in 2026?
On HtAG Analytics data to 31 May 2026, the highest structural-risk house markets are Woodgate (QLD), Oakville (NSW), Craignish (QLD), Plainland (QLD) and Nikenbah (QLD). They share elevated oversupply and weak liquidity on top of run-hot prices.
How is the HtAG Structural Risk Score calculated?
Each credible house market is ranked against the national distribution on thirteen risk metrics across five pillars — oversupply & vacancy, liquidity & demand, late-cycle position, forward supply pipeline and resilience — combined with fixed published weights into a 0–100 score.
Does a high risk score mean prices will fall?
No. The score measures relative vulnerability, not a forecast. A high score is a signal to do deeper due diligence; many high-risk suburbs will keep rising, just with less margin for error.
Which state has the most high-risk suburbs?
Queensland, with 54 of the 108 high-risk markets nationally, concentrated on the Fraser Coast and in south-east growth corridors.
Why are so many Fraser Coast suburbs on the list?
Hervey Bay’s surrounding suburbs combine lifestyle-led discretionary demand with rising rental vacancy and a building pipeline, which lifts oversupply and liquidity risk together. Suburb-level vacancy can also be amplified by small rental samples.
What does the cash rate have to do with suburb risk?
The RBA lifted the cash rate to 4.35% in May 2026. Higher repayments raise holding costs most in discretionary and recently built markets — exactly the suburbs at the top of this ranking.
How to cite
How to cite this report
Licensed CC BY 4.0 — free to share and adapt with attribution to HtAG Research.
@techreport{htag_npr_2026_ed1,
  title        = {{National Property Risk Report, Edition 1}},
  author       = {{HtAG Research}},
  institution  = {HtAG Analytics},
  year         = {2026},
  month        = jun,
  url          = {https://www.htag.com.au/riskiest-suburbs-australia-2026/}
}
Disclaimer: This report is general information only and not financial, investment or taxation advice. The Structural Risk Score measures relative vulnerability across HtAG’s covered house markets; it is not a forecast of price movements, and a high score does not imply a property will fall in value. Figures are HtAG Analytics estimates to 31 May 2026 and may be revised; suburb-level metrics can be affected by small samples. Always undertake independent due diligence before any property decision.
Sources: HtAG Analytics market dataset (to 31 May 2026); Reserve Bank of Australia (cash-rate decisions; March 2026 Financial Stability Review); NSW Department of Planning; Maitland City Council; Lockyer Valley Regional Council; Western Australian Planning Commission; PRD (Hervey Bay Market Update, June 2026); University of Queensland Gas & Energy Transition Research Centre.


