


Short Summary
Australia’s proposed 2027 reforms quarantine negative-gearing losses to investment income and replace the 50% capital-gains-tax discount with a CPI-indexed cost base from 1 July 2027. According to HtAG Analytics data (May 2026), just 26 high-confidence suburbs nationally carry the structural signature of the most-affected stock — renter-majority ownership combined with sub-3% gross yields — and 58% of them are in New South Wales. Exposure is heaviest in established inner-city markets, not the outer mortgage belt. This report ranks them, explains the method, and is free to download and cite.
The best way to understand the proposed 2027 negative-gearing and capital-gains-tax changes is to ask a precise question: not “will prices fall?” but “where is the most-affected stock concentrated?” According to HtAG Analytics data, the answer is unusually specific. The reforms bear hardest on property that is investor-held and run at a rental loss today, and that profile clusters in a small, identifiable set of suburbs.
This report maps them. HtAG’s Investor Exposure Index ranks Australian suburbs on the structural signature of policy exposure — investor (renter) concentration combined with negative-gearing intensity (a low gross yield) — using live warehouse data for May 2026. It is a map of positioning, not a forecast of prices.
Table of Contents
- What the 2027 negative gearing and CGT changes mean
- How HtAG measures investor exposure
- The 25 most budget-exposed suburbs in Australia
- Where the exposure concentrates
- What it means — and what it does not
- Surface this data inside your AI agent
- Download the full report (free PDF)
- Key Takeaways
- Frequently Asked Questions
What the 2027 negative gearing and CGT changes mean
Two measures drive the exposure. First, negative-gearing quarantine: from 1 July 2027, rental losses on established property bought after Budget night (12 May 2026) can no longer be deducted against wage and salary income — only carried forward against future investment income. The deeper a property’s current rental loss (the lower its yield relative to price), the larger the deduction at stake. Second, the capital-gains-tax change: the 50% discount is replaced with a CPI-indexed cost base plus a minimum 30% tax on gains, weighing most on long-held, highly-appreciated holdings.
Together they bear hardest on a specific kind of stock: investor-owned property running at a rental loss. Where many such properties cluster in one suburb, any behavioural response — holding, listing or repricing — is most likely to show up at the suburb level first. (Sources: Budget 2026–27; ATO.)
How HtAG measures investor exposure
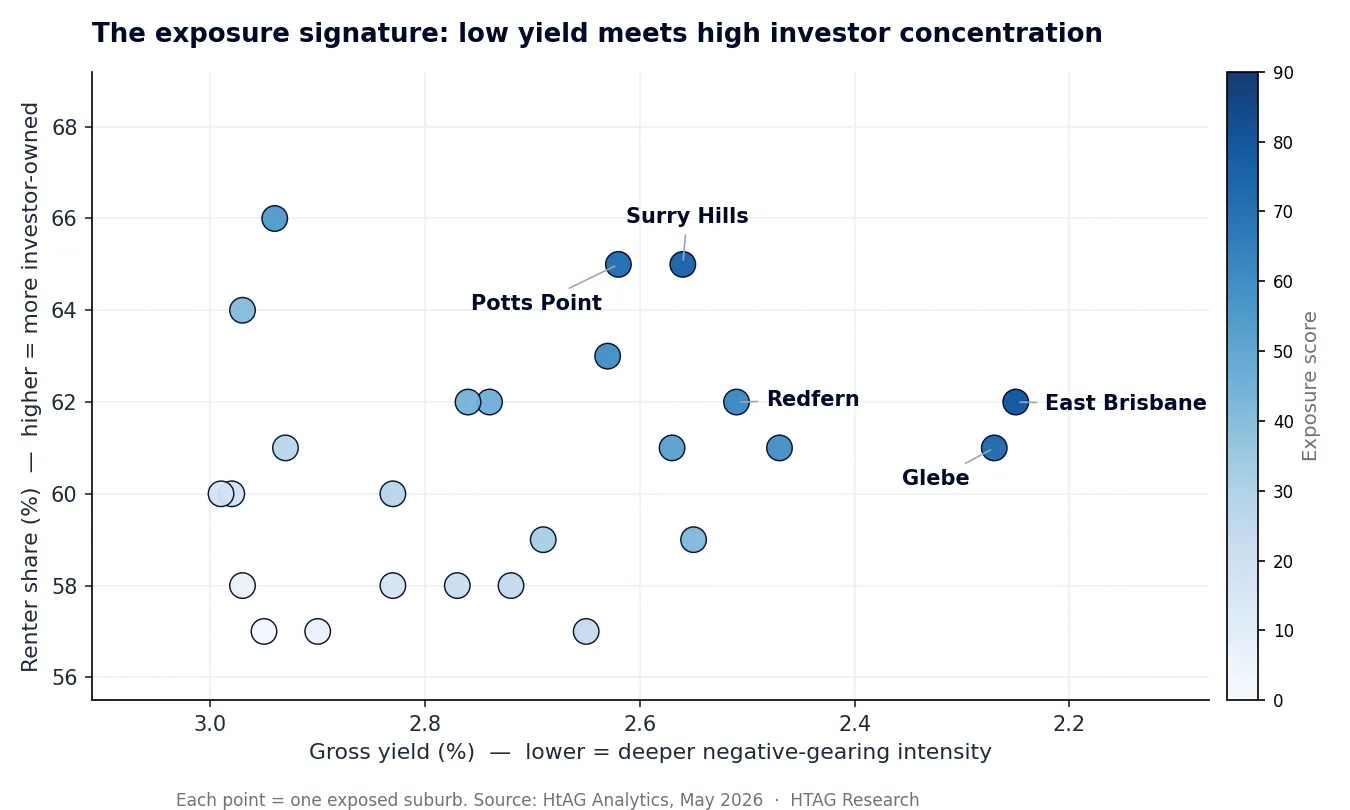
HtAG screens every Australian house and unit market at suburb level (May 2026), restricted to High data-confidence and the all-bedroom median — a deliberately strict screen designed to surface structural exposure, not every investor suburb. A suburb enters the exposed set when it is renter-majority (renter-to-owner ratio above 0.55) and runs a sub-3% gross yield. Each exposed suburb is then scored 0–100 on two equally-weighted components: negative-gearing intensity (lower yield scores higher) and investor concentration (higher renter share scores higher).
What This Means in Plain English
Exposure here means two things at once: a lot of the suburb is owned by investors (high renter share), and those investments currently lose money on rent versus price (low yield). That combination is exactly what the negative-gearing change targets — so these are the suburbs where the most owners have the most to reconsider.
The 25 most budget-exposed suburbs in Australia
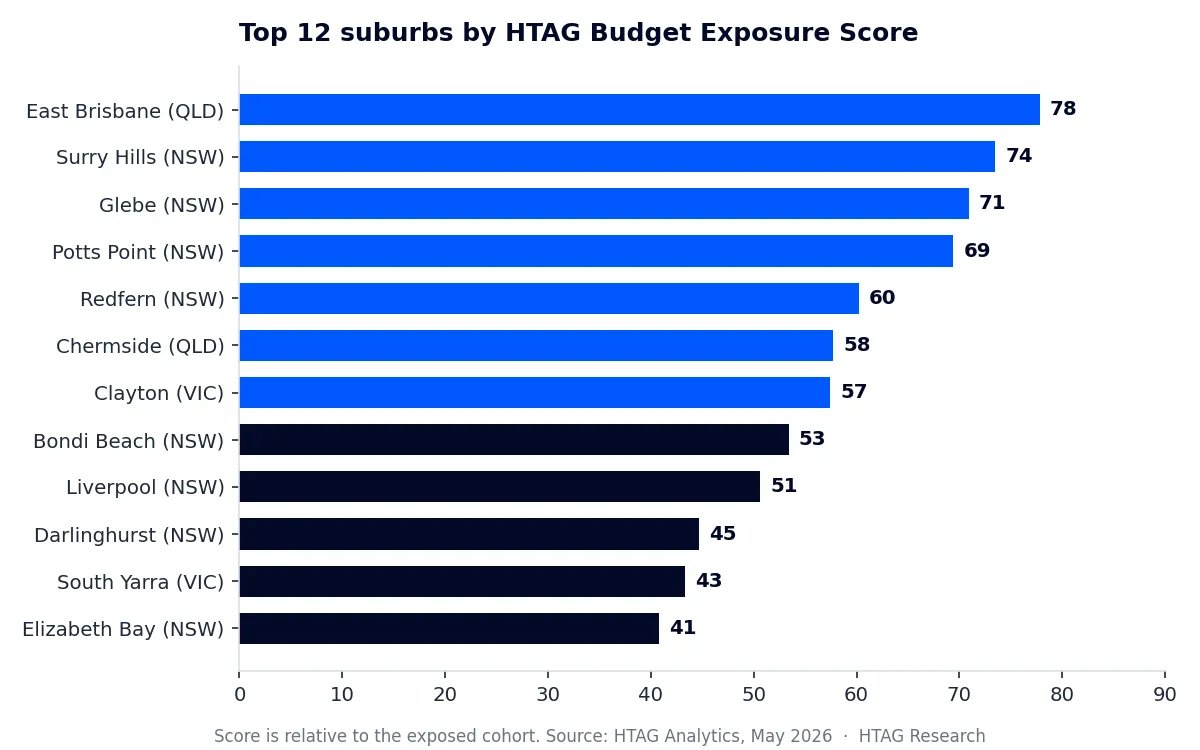
The table below ranks the exposed cohort by HtAG Exposure Score (higher = greater concentration of investor-owned, negatively-geared stock). All values are HtAG warehouse figures for the all-bedroom suburb median, May 2026, High-confidence suburbs.
| # | Suburb | State | Type | Median price | Yield | Renter | IRSAD | Exposure |
|---|---|---|---|---|---|---|---|---|
| 1 | East Brisbane | QLD | House | $1,901,296 | 2.25% | 62% | 10 | 78 |
| 2 | Surry Hills | NSW | House | $2,752,720 | 2.56% | 65% | 10 | 74 |
| 3 | Glebe | NSW | House | $2,786,835 | 2.27% | 61% | 10 | 71 |
| 4 | Potts Point | NSW | Unit | $2,185,402 | 2.62% | 65% | 10 | 69 |
| 5 | Redfern | NSW | House | $2,483,922 | 2.51% | 62% | 10 | 60 |
| 6 | Chermside | QLD | House | $1,350,131 | 2.63% | 63% | 5 | 58 |
| 7 | Clayton | VIC | House | $1,384,637 | 2.47% | 61% | 7 | 57 |
| 8 | Bondi Beach | NSW | Unit | $2,070,748 | 2.94% | 66% | 10 | 53 |
| 9 | Liverpool | NSW | House | $1,310,984 | 2.57% | 61% | 1 | 51 |
| 10 | Darlinghurst | NSW | Unit | $2,018,581 | 2.74% | 62% | 10 | 45 |
| 11 | South Yarra | VIC | House | $2,199,067 | 2.76% | 62% | 10 | 43 |
| 12 | Elizabeth Bay | NSW | Unit | $2,397,234 | 2.55% | 59% | 10 | 41 |
| 13 | Adelaide | SA | House | $1,228,590 | 2.97% | 64% | 9 | 40 |
| 14 | Toowoomba City | QLD | House | $999,689 | 2.69% | 59% | 2 | 31 |
| 15 | Penrith | NSW | House | $1,142,234 | 2.83% | 60% | 3 | 28 |
| 16 | Kirribilli | NSW | Unit | $1,816,288 | 2.93% | 61% | 10 | 26 |
| 17 | Fairfield | NSW | House | $1,298,270 | 2.72% | 58% | 1 | 24 |
| 18 | Lethbridge Park | NSW | House | $1,021,748 | 2.65% | 57% | 1 | 23 |
| 19 | Newtown | NSW | House | $2,280,982 | 2.77% | 58% | 10 | 20 |
| 20 | Birtinya | QLD | House | $1,436,994 | 2.98% | 60% | 9 | 17 |
| 21 | St Kilda | VIC | House | $1,715,406 | 2.99% | 60% | 10 | 17 |
| 22 | Southport | QLD | House | $1,556,747 | 2.83% | 58% | 4 | 16 |
| 23 | Redbank Plains | QLD | House | $931,956 | 2.97% | 58% | 1 | 7 |
| 24 | Pimpama | QLD | House | $1,218,568 | 2.90% | 57% | 5 | 6 |
| 25 | Mascot | NSW | House | $2,081,536 | 2.95% | 57% | 10 | 3 |
Source: HtAG Analytics, May 2026. Yield is gross (annualised weekly rent ÷ median price); renter is the renter-to-owner ratio; IRSAD is the ABS socio-economic decile. Burwood (NSW) cleared the screen but is held out of the ranking as a data anomaly (a $3.28m median against ~$993/week rent implies a sub-1.6% yield, consistent with redevelopment-skewed medians).
According to HtAG Analytics, just 26 high-confidence suburbs nationally combine renter-majority ownership with sub-3% gross yields — and 58% of them are in New South Wales.
HtAG Analytics, Investor Exposure Index (May 2026)
Where the exposure concentrates
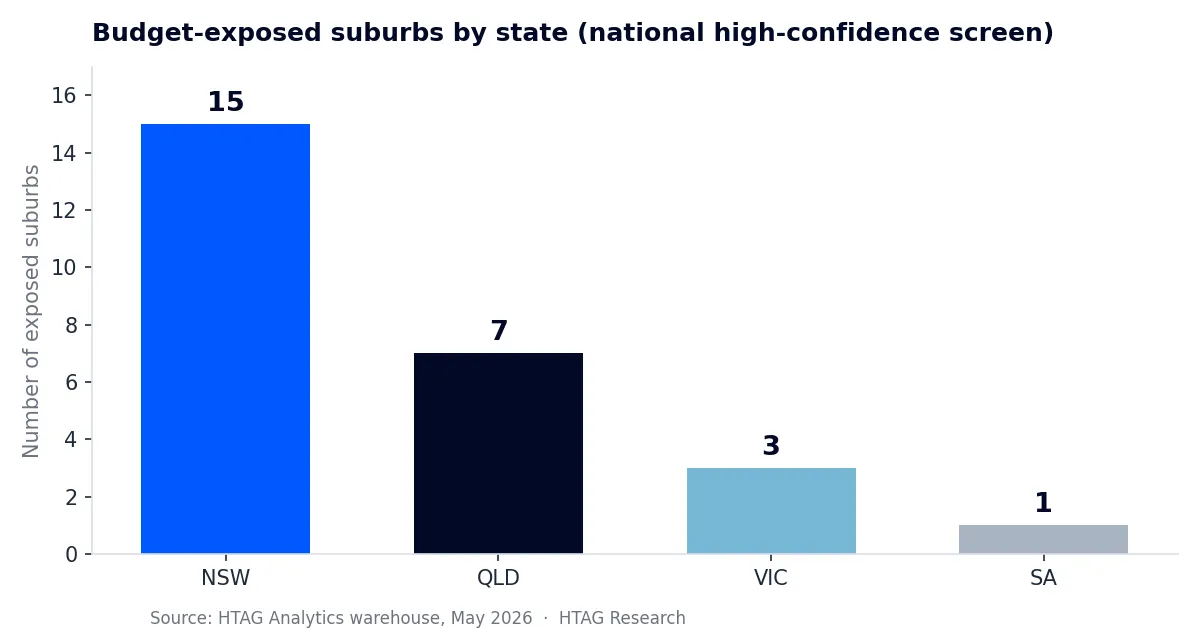
Exposure is concentrated, not nationwide. New South Wales carries 15 of the 26 exposed suburbs, led by Sydney’s inner-east apartment cluster (Potts Point, Elizabeth Bay, Darlinghurst, Kirribilli, Bondi Beach). Queensland contributes seven across inner-Brisbane and South-East corridors; Victoria three in inner-Melbourne; South Australia one in inner Adelaide.
Independent budget modelling reported in the national press put the average price impact at around 4.6% nationally but 8.3% across Greater Sydney and Melbourne — consistent with this NSW-weighted concentration. The most-exposed markets are established, high-IRSAD inner suburbs where investor ownership is high and yields are thin because prices have run well ahead of rents. This is the opposite of the outer mortgage-belt framing the policy debate usually assumes — the same lesson HtAG’s work on typical versus median price repeats: the headline rarely tells you the risk.
What This Means in Plain English
If you own or are buying in one of these inner-city, investor-heavy suburbs, you are inside the cohort most directly in the path of the change. If you are in the outer mortgage belt, you are mostly outside it — the opposite of the common assumption.
What it means — and what it does not
For buyers and their agents, the index flags where post-reform listing volume is most likely to concentrate, and therefore where negotiating conditions could shift first. For owners, it shows whether a holding sits inside or outside the structurally exposed cohort — a starting point for a conversation with a licensed adviser, not a recommendation.
It is a positioning map, not a price forecast. The index identifies where investor exposure is concentrated today. Whether and how that translates into listings or price movement depends on the final legislation, grandfathering provisions and interest-rate conditions — none of which this index predicts. HtAG validates its data-led approach over time through its Evidence Portal.
HtAG ranks exposure; it does not predict prices. This index locates the policy’s pressure points with suburb-level precision — the rest depends on the final law and the cycle.
HtAG Analytics, Investor Exposure Index (May 2026)
Surface this data inside your AI agent
The HtAG Developer Portal exposes the data behind this report — and every other HtAG dataset — through MCP (Model Context Protocol) connectors. Investors and buyers’ agents using Claude, Perplexity, Manus AI or any MCP-compatible AI agent can query HtAG exposure, yield, renter-share and risk data on any Australian suburb directly inside the tool they already use.
Browse the endpoint catalogue at developer.htagai.com and submit the HtAG Developer Portal application — approved members receive an API key and an MCP setup guide for their preferred AI tool.
Download the full report (free PDF)
The full Investor Exposure Index, Edition 1 — cover, methodology, the complete ranking and state breakdowns — is available as a free, open-access PDF.
Cite this report
Free to share and quote under CC BY 4.0 — please attribute HtAG Research. Pick a format and copy:
@techreport{htag_investor_exposure_2026,
 title = {{Australia's Investor Exposure Index, Edition 1}},
 author = {{HtAG Research}},
 institution = {HtAG Analytics},
 year = {2026},
 month = jun,
 url = {https://www.htag.com.au/negative-gearing-2027-suburbs-investor-exposure/}
}
Key Takeaways
- Exposure is concentrated, not nationwide. Just 26 high-confidence suburbs combine renter-majority ownership with sub-3% gross yields — NSW 15, Queensland 7, Victoria 3, South Australia 1 (HtAG Analytics, May 2026).
- It is inner-urban, not outer mortgage belt. East Brisbane, Surry Hills, Glebe, Potts Point and Redfern lead — established, high-IRSAD markets where prices have run well ahead of rents.
- The median exposed suburb runs a 2.7% yield with a 60% renter share — properties carrying real rental losses, held disproportionately by investors.
- Seven exposed suburbs sit in the bottom four IRSAD deciles, where a thinner owner-occupier buyer pool offers less of a price cushion if investors list together.
- This is a positioning map, not a price forecast. It locates where investor exposure is concentrated today; outcomes depend on final legislation, grandfathering and rates.
Frequently Asked Questions
When do the negative gearing changes start?
The proposed changes take effect from 1 July 2027. Properties held before Budget night (12 May 2026) are grandfathered under existing arrangements, so existing investors are not affected on holdings bought before that date.
Which suburbs are most affected by the negative gearing changes?
According to HtAG Analytics, 26 high-confidence suburbs nationally combine renter-majority ownership with sub-3% gross yields, and 58% are in NSW. The most exposed include East Brisbane, Surry Hills, Glebe, Potts Point and Redfern.
Do the changes affect existing properties?
Existing arrangements remain for properties held before 12 May 2026. Investors who buy established housing after that date can carry rental losses forward against investment income but cannot deduct them against wages or salary from 1 July 2027.
What is changing with capital gains tax in 2027?
The 50% CGT discount is replaced with a discount based on inflation (a CPI-indexed cost base), with a minimum 30% tax on gains, from 1 July 2027.
Are units more exposed than houses?
Of the 26 exposed suburbs, 21 are houses and 5 are units. The most exposed cohort is dominated by established, high renter-share inner-city markets rather than any single dwelling type.
How is investor exposure measured?
HtAG screens suburbs that are renter-majority (renter-to-owner ratio above 0.55) and run a sub-3% gross yield, then scores them 0–100 on negative-gearing intensity (low yield) and investor concentration (high renter share). It ranks exposure; it does not forecast prices.
Disclaimer
This article is for educational purposes only and does not constitute financial advice. It is HtAG’s classification of policy exposure based on its v3.0 framework; the underlying model has a typical error of 1.4 percentage points on annual price growth. We rank exposure; we do not predict prices. Treatment of the proposed reforms — including grandfathering and any principal-residence-conversion provisions — is subject to final legislation and ATO confirmation. Sources: Budget 2026–27; ATO.


