


Short Summary
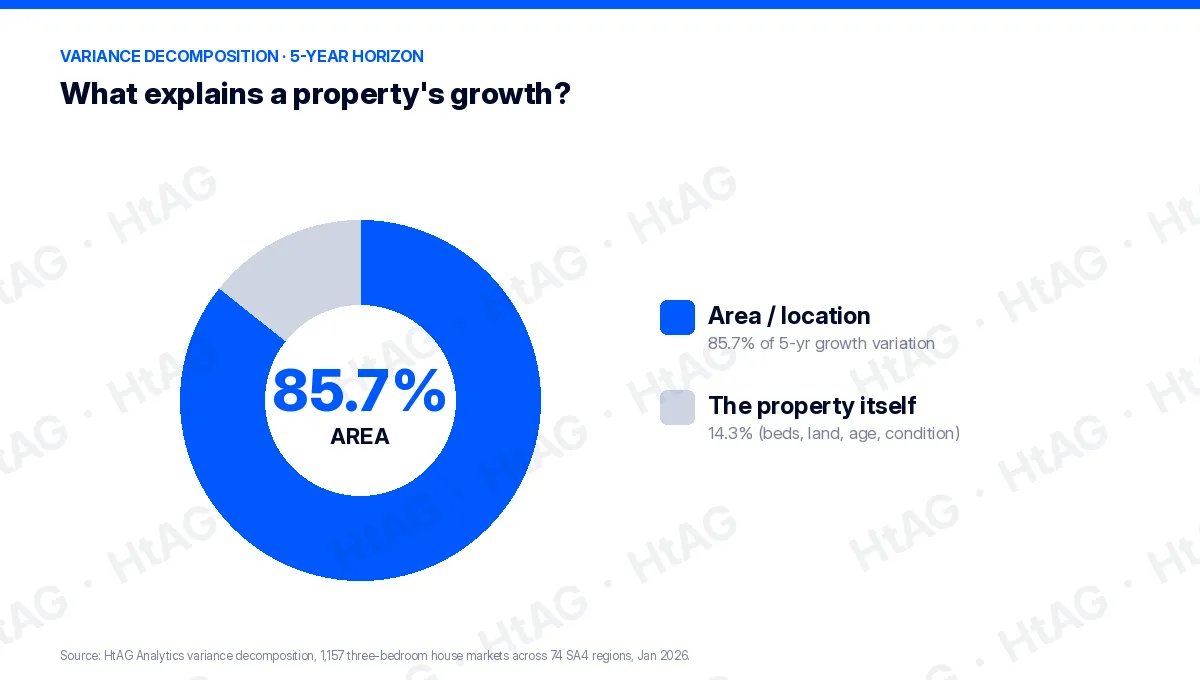
When the goal is capital growth, the area you buy in matters far more than the specific property. An HtAG Analytics variance decomposition of 1,157 three-bedroom house markets across 74 SA4 regions (January 2026) finds area selection explains 85.7% of five-year price-growth variation, while the property itself explains just 14.3%. The five-year growth gap between a top-20% and a bottom-20% region on a $700,000 purchase is $648,568 — more than the value of careful property selection could ever recover inside a weak area.
In the “area vs property” debate, the evidence is one-sided: for capital growth, the area does the heavy lifting. The number of bedrooms, the land size, the age of the build and whether it has one bathroom or two explain a surprisingly small share of how much a property grows in value. Where you buy explains most of it — and that share gets larger the longer you hold.
This guide sets out exactly how much of growth is driven by area versus the property, why the gap is so large, the price–growth paradox that catches investors out, and — in fairness — the situations where the specific property genuinely does matter more. The figures are drawn from an HtAG Analytics variance study and corroborated by peer-reviewed academic research.
HtAG Data — cite this
According to HtAG Analytics’ variance decomposition of 1,157 three-bedroom house markets across 74 SA4 regions (January 2026), area selection explains 85.7% of five-year price-growth variation, while the property itself explains 14.3%. The five-year growth gap between a top-20% and a bottom-20% region on a $700,000 purchase is $648,568.
Suggested citation: HtAG Analytics, Area vs Property Variance Study, February 2026.
In 30 Seconds
What is it? “Area vs property” asks which matters more for capital growth: where you buy, or what you buy. The data says the area dominates — 85.7% of five-year growth variation versus 14.3% for the property.
Why does it matter? Holding out for a “perfect” property in a weak area costs far more growth than accepting an ordinary property in a strong one.
Who uses it? Investors prioritising capital growth, buyers’ agents validating a brief, and anyone weighing a compromise on the property against a compromise on the suburb.
Does it always hold? No — for owner-occupiers, renovation/value-add plays and avoiding genuinely compromised homes, the property matters more. See the section below.
Table of Contents
- Area vs Property: The Short Answer
- What Explains Growth: The Variance Data
- Area’s Share Grows the Longer You Hold
- The Price–Growth Paradox
- The $648,568 Question: The Cost of the Wrong Area
- What the Academic Research Says
- When the Specific Property Does Matter More
- How to Put Area First in Practice
- Surface This Data Inside Your AI Agent
- From Data Signal to Portfolio Decision
- Key Takeaways
- Frequently Asked Questions
Area vs Property: The Short Answer
For capital growth, the area matters more than the property — decisively. Across 1,157 three-bedroom house markets, area selection explains 85.7% of the variation in five-year price growth; property-level differences within the same area explain the remaining 14.3%. In plain terms, nearly six-sevenths of your growth outcome is set by where you buy, not by the bedroom count, land size or whether the build is new or old.
That does not mean the property is irrelevant — it means the property is the smaller lever. If you are choosing between a better house in an average suburb and an average house in a high-growth suburb, the data points firmly to the second. This idea sits at the heart of Property Intelligence: ranking markets first, then finding an acceptable asset within the winning market.
What Explains Growth: The Variance Data
To quantify it, HtAG ran a variance decomposition: of all the differences in price growth between properties, how much is explained by the region versus property-specific factors? Isolating three-bedroom houses — to compare like with like — the area’s share is overwhelming and rises with the holding period.
| Holding period | Growth explained by AREA | Explained by the PROPERTY |
|---|---|---|
| 1 year | 64.2% | 35.8% |
| 5 years | 85.7% | 14.3% |
Source: HtAG Analytics variance decomposition, 1,157 three-bedroom house markets across 74 SA4 regions, January 2026.
What This Means in Plain English
Imagine two identical houses, one in a strong suburb and one in a weak one. Five years later their values are very different — and that difference is almost entirely about the suburbs, not the houses. The house is the boat; the area is the tide.
Area’s Share Grows the Longer You Hold
Area selection matters more over time, not less. At one year, area explains 64.2% of growth variation; by five years that rises to 85.7%. Short-term noise — a good or bad individual sale, a quick renovation — washes out, and the underlying strength of the location compounds. The longer your horizon, the more the suburb decides your outcome.
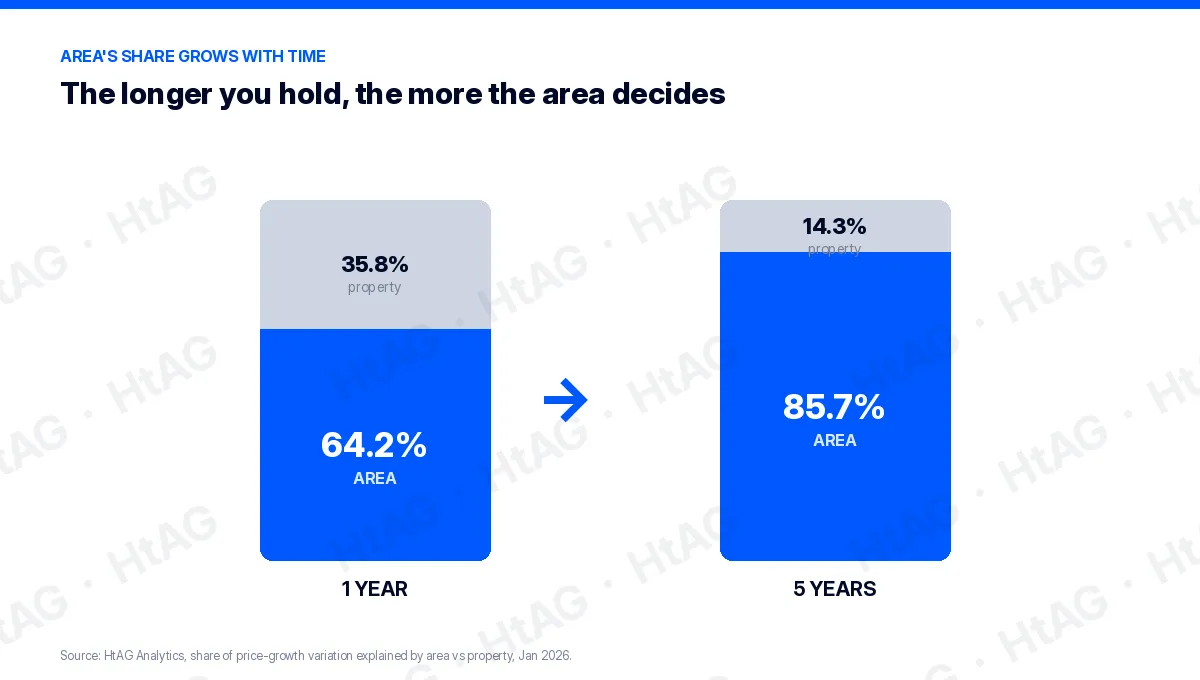
According to HtAG Analytics, the area’s share of price-growth variation rises from 64.2% at one year to 85.7% at five years — location’s advantage compounds with time.
HtAG Analytics, Area vs Property Variance Study (February 2026)
The Price–Growth Paradox
A more expensive, higher-specification property does not grow faster — it tends to grow slower in percentage terms. Across the 1,157 markets, the correlation between purchase price and percentage growth is negative across every timeframe. Dearer stock delivers lower percentage capital growth, not higher.
The academic record agrees. Iftikhar et al. (2025) found total land area carried a negative relationship with price (B = −5.928, p < 0.001) — bigger lots did not command proportionally higher values — while location factors such as coastal proximity added $261,915 to value (B = 261,915, p < 0.001). Kou (2019) likewise found that lower-priced, smaller properties often have higher appreciation potential. The implication: holding out for a newer, larger, higher-spec home can actively work against a capital-growth goal. This is the same reason a robust central price measure beats chasing the dearest stock.
The $648,568 Question: The Cost of the Wrong Area
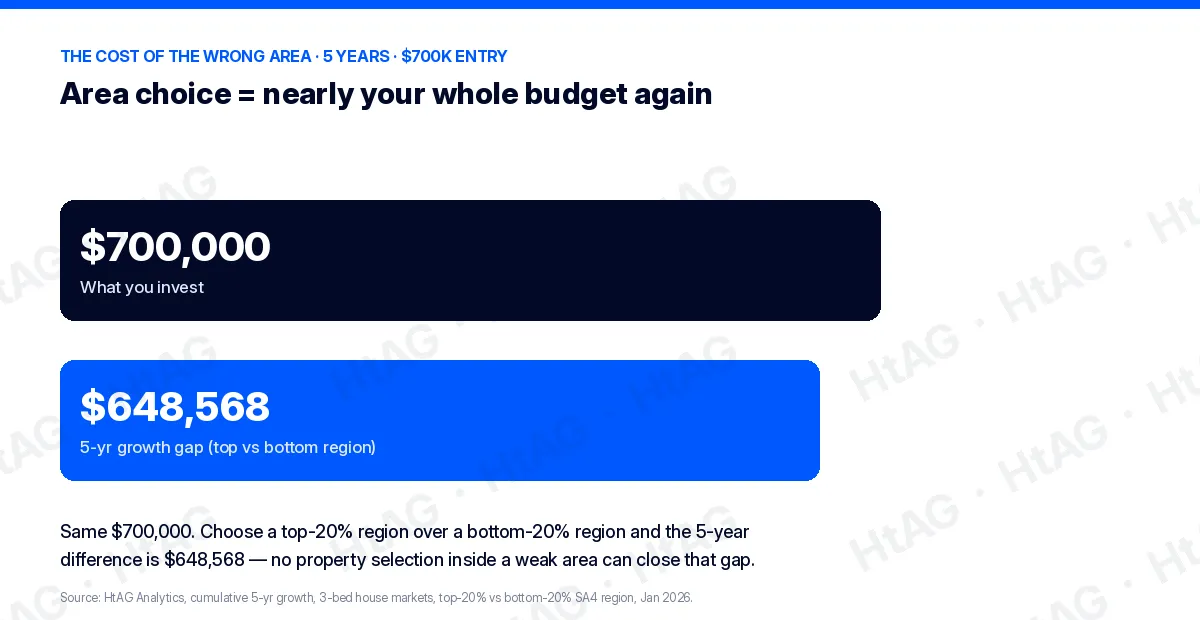
The gap between a strong and a weak area is not marginal — it is transformational. On a $700,000 purchase, the five-year cumulative growth gap between a top-20% region and a bottom-20% region is $648,568. That is close to the entire value of the original property, created purely by the choice of area. No amount of careful property selection inside a weak market can close a gap of that size.
| On a $700,000 purchase | Figure |
|---|---|
| 5-year growth gap, top-20% vs bottom-20% region | $648,568 |
| Current top-quintile annual return | 15.5% p.a. |
| Cost of waiting ~6 months for the “perfect” listing | ~$54,250 in foregone equity |
Source: HtAG Analytics, cumulative five-year growth, three-bedroom house markets, January 2026.
There is a timing cost too. In a top-quintile area returning around 15.5% a year, roughly six months spent waiting for the ideal listing costs about $54,250 in foregone equity — often more than it would cost to add the missing bathroom to a property already sitting in the right corridor. Reading the Growth Rate Cycle (GRC) helps you judge when an area is accelerating and waiting is most expensive.
What the Academic Research Says
That location dominates property-level features in explaining capital growth is one of the most consistently validated findings in property economics. Three peer-reviewed studies illustrate the weight of evidence.
| Study | Key finding on location vs property |
|---|---|
| Kou (2019) | In a machine-learning study of 21,000+ properties, regional economic-cluster features alone reached an R² of 0.63 for predicting appreciation — higher than all structural attributes combined. |
| Morano et al. (2019) | Area quality shifted property values by up to 143% of the base value, even among structurally identical homes. |
| Iftikhar et al. (2025) | Land area showed a negative relationship with price (B = −5.928, p < 0.001); location factors such as coastal proximity added $261,915 (p < 0.001). |
Sources: Kou (2019); Morano, Tajani & Locurcio (2019); Iftikhar et al. (2025). HtAG’s variance result is consistent with this body of research.
When the Specific Property Does Matter More
In fairness, “area first” is a rule about capital growth on an investment, not a law for every purchase. There are clear cases where the property itself deserves equal or greater weight.
- You’re buying a home, not an asset. If you’ll live there for a decade, liveability — layout, light, the extra bathroom — is a legitimate priority. The 85.7% finding is about investment growth, not your quality of life.
- You’re manufacturing equity. Renovation, subdivision and value-add strategies deliberately make the property the lever. Here the dwelling, the floorplan and the land are central — though the area still sets your ceiling.
- Within the right area, the property still has to stack up. “Area first” never means “buy anything.” A compromised property — on a main road, structurally poor, or badly mispriced — can underperform even in a strong suburb. The 14.3% is small, but it isn’t zero.
- Street-level micro-location. Within a suburb, position still counts. The point is that this is a refinement after the area is chosen, not a substitute for choosing the right area first.
The honest summary: choose the area for the growth, then choose the best acceptable property within it — and never let a hunt for the perfect property keep you out of the right area.
How to Put Area First in Practice
- Rank markets before listings. Shortlist suburbs on growth fundamentals first — the approach behind the Dex suburb ranking and the Relative Composite Score (RCS) — then look at properties only inside the winners.
- Don’t confuse granularity with the question. Whether you research at LGA or suburb level (see LGA vs suburb research) is about how finely you measure the area — it’s still an area question.
- Weigh regional vs metro on the data, not the postcode’s reputation. Strong growth corridors appear in both — compare them on fundamentals (regional vs metro), not assumptions.
- Accept an ordinary property in a strong area over a perfect one in a weak area. The $648,568 gap is the price of getting that trade-off wrong. Validate the suburb’s fundamentals the way an analyst would in how to analyse a suburb.
What This Means in Plain English
Pick the suburb like you’re picking the wave; pick the property like you’re picking a good board. The wave decides how far you travel. A great board on a flat day still goes nowhere.
Surface This Data Inside Your AI Agent
The HtAG Developer Portal exposes the suburb-level growth, risk and ranking data behind this article through MCP (Model Context Protocol) connectors. Investors and buyers’ agents using Claude, Perplexity, Manus AI, ChatGPT (via custom connectors) or any other MCP-compatible AI agent can rank areas on live HtAG data — across 15,000+ localities and all 537 local government areas — directly inside the AI tool they already use. HtAG operates Australia’s first and only property-intelligence MCP platform, with 104+ REST endpoints and 70+ public MCP tools.
HtAG’s MCP-enabled Developer Portal lets your AI agent rank Australian areas on live growth and risk data — so you choose the suburb on evidence before you ever look at a listing.
HtAG Analytics Developer Portal (2026)
Browse the endpoint catalogue at developer.htagai.com and submit the HtAG Developer Portal application — approved members receive an API key and an MCP setup guide for their preferred AI tool.
From Data Signal to Portfolio Decision
The area-ranking signals behind this article — growth, risk and the Relative Composite Score — are live inside the HtAG Analytics platform, updated each quarter as new data flows in. Professional buyers’ agents use them to choose the market first and validate the property second, exactly as the data prescribes.
If you’re building a portfolio and want to see the exact data powering articles like this one, the HtAG Starter Plan gives you access to suburb-level analytics across every Australian market — no lock-in, cancel any time. The full variance methodology and the regional growth register are available as a deeper paper via the Evidence Portal.
Start your HtAG Analytics membership → · Apply for Developer Portal access →
Key Takeaways
- Area explains 85.7% of five-year growth. The property explains 14.3% (HtAG variance study, 1,157 markets, Jan 2026).
- Location’s edge compounds. Area’s share rises from 64.2% at one year to 85.7% at five years.
- Dearer doesn’t mean faster. Purchase price and percentage growth are negatively correlated across every timeframe.
- The wrong area costs $648,568. That’s the five-year gap on a $700k buy between a top-20% and a bottom-20% region — and ~$54,250 for every six months spent waiting in a 15.5%-p.a. corridor.
- Property still matters — second. For homes, value-add plays and avoiding dud properties, the dwelling counts; for investment growth, choose the area first.
Frequently Asked Questions
Does the area or the property matter more for capital growth?
For capital growth, the area matters far more. An HtAG Analytics variance decomposition of 1,157 three-bedroom house markets (January 2026) found area selection explains 85.7% of five-year price-growth variation, while property-level factors explain 14.3%. The result is consistent with peer-reviewed research showing location features dominate structural attributes when predicting appreciation.
How much difference does choosing the right area make?
On a $700,000 purchase, the five-year cumulative growth gap between a top-20% region and a bottom-20% region is $648,568 — close to the entire value of the original property. Because top-quintile areas are currently returning around 15.5% a year, roughly $54,250 of equity is foregone for every six months spent waiting for a “perfect” listing.
Do more expensive properties grow faster?
No — the data shows the opposite. Across 1,157 markets, purchase price and percentage growth are negatively correlated at every timeframe, meaning dearer, higher-spec properties tend to deliver lower percentage growth. Iftikhar et al. (2025) similarly found land area negatively related to price, while location factors added substantial value. This is general information, not financial advice.
When does the specific property matter more than the area?
When you’re buying a home to live in, when you’re manufacturing equity through renovation or subdivision, or when avoiding a genuinely compromised property within a good area. The 85.7% finding is about investment capital growth; for liveability or value-add strategies, the dwelling carries more weight. Even then, the area sets the ceiling.
How do I access HtAG area-ranking data inside Claude or Perplexity?
Apply through the HtAG Developer Portal. Browse the endpoint catalogue at https://developer.htagai.com/ and submit the application form at https://links.htag.com.au/widget/form/GFVegAaXzeTUH7QzRl1T. Approved members receive an API key and an MCP setup guide, so they can rank Australian suburbs on live growth and risk data directly inside Claude, Perplexity, Manus AI or any MCP-compatible AI agent.
The conceptual framework behind this analysis is published openly for transparency and education. Its proprietary implementation — the variance methodology, calibration, weighting, validation and the underlying data — remains the confidential intellectual property of HtAG Analytics.
This article forms part of the HtAG Property Intelligence Reference Library — a structured knowledge base documenting the concepts, metrics and methodologies used to analyse Australian residential property markets. Reference Standard PI-AREAVSPROPERTY · Version 1.0.
Disclaimer: This article is general information only and does not constitute financial, investment or property advice. Figures are drawn from an HtAG Analytics variance study (January–February 2026) and the cited academic research; markets change and past performance is not a reliable indicator of future results. Consider your own circumstances and seek licensed professional advice before making any property decision.


