


Short Summary
The Relative Composite Score (RCS) is HtAG Analytics’ headline 1–100 suburb score. It distils 80+ market metrics into three goal-based dimensions — Capital Growth, Cashflow and Lower Risk — plus an Overall score that averages the three. This guide defines RCS, shows a worked example across two real Victorian suburbs, explains how to read the bands, and clears up the single most common error: confusing a high Overall score with a “good buy”.
RCS in 30 seconds
What is it? A single 1–100 score that rates how strong a suburb is for property investment, across growth, cashflow and risk.
Why does it matter? It turns dozens of separate metrics into one comparable number, so you can screen thousands of suburbs in seconds instead of reading them one by one.
Who uses it? Property investors, buyers agents, mortgage brokers and analysts.
Use it on its own? No — read the three component scores, not just the Overall, and confirm with the underlying metrics before you act.
Start Here
Picture two suburbs. One is a $2.5 million blue-chip address everyone has heard of. The other is a cheaper outer suburb most investors overlook. Which is the stronger investment market right now? The famous one feels safer — but as you will see below, the data tells a different story. The Relative Composite Score exists to settle that question with numbers instead of reputation.
Every property investor eventually hits the same wall: there are roughly 15,000 suburbs in Australia, each described by dozens of competing data points, and no human can hold all of that in their head at once. The Relative Composite Score (RCS) is HtAG Analytics’ answer to that problem. It is a single, comparable 1–100 score that summarises how investable a suburb is — calculated independently for houses and units, and updated every month as new data arrives.
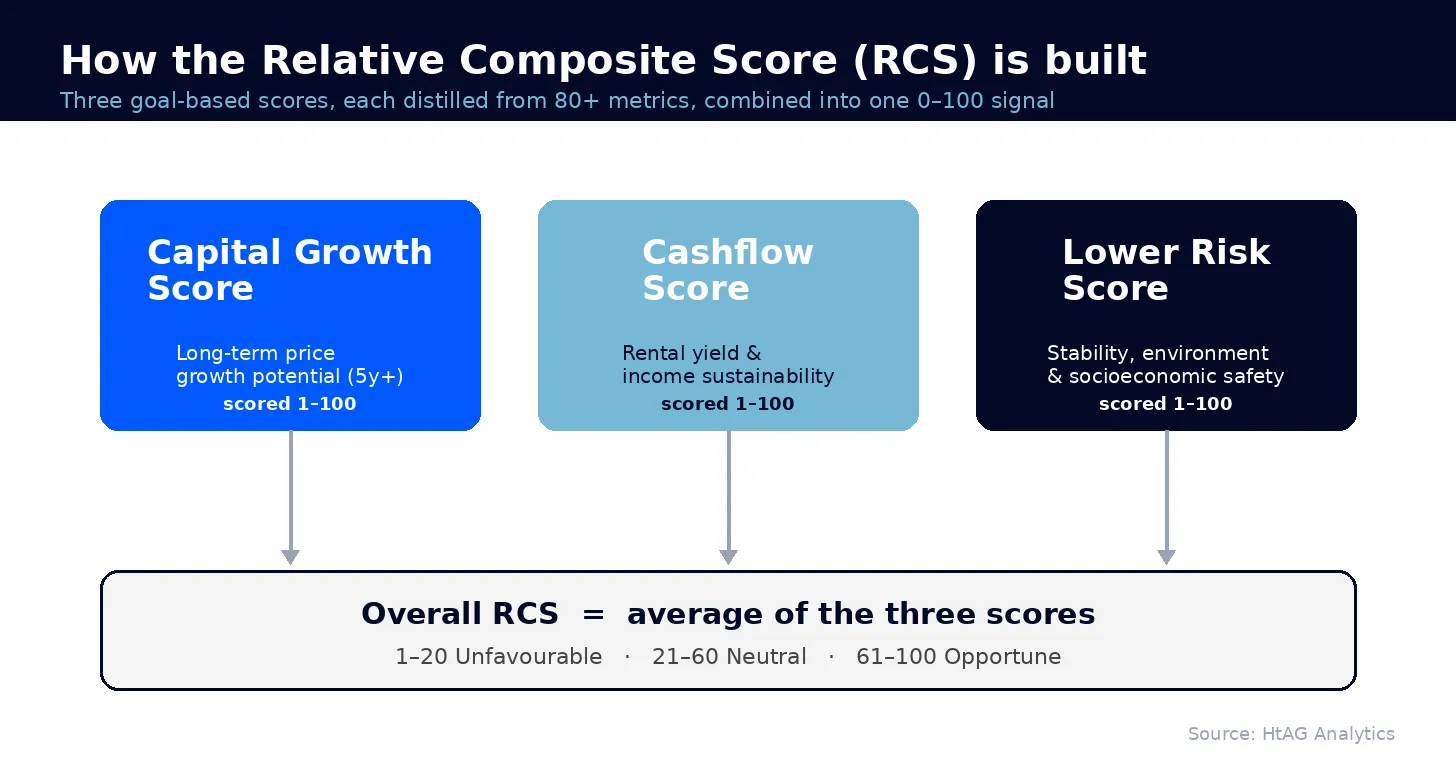
In a nutshell: the Relative Composite Score (RCS) is a 1–100 suburb score that combines more than 80 property-market metrics into three goal-based dimensions — Capital Growth, Cashflow and Lower Risk — and an Overall score that is the average of those three. Higher is better. It is a screening signal, not a buy instruction.
Table of Contents
- What is the Relative Composite Score (RCS)?
- A worked example: Frankston vs Brighton
- Why HtAG developed RCS
- The three component scores explained
- How RCS is calculated
- How to read an RCS score
- RCS vs Dex: score versus ranking
- Where RCS fits in the HtAG decision stack
- Who uses RCS and why
- Common mistakes with RCS
- Surface this data inside your AI agent
- From data signal to portfolio decision
- Key takeaways
- FAQs
What is the Relative Composite Score (RCS)?
The Relative Composite Score (RCS) is a 1–100 score that rates a suburb’s investment quality by combining more than 80 individual property-market metrics into three goal-based dimensions and one overall figure. According to HtAG Analytics, RCS is calculated separately for houses and units and refreshed monthly, so every suburb in the country can be compared on a like-for-like basis at a single glance.
If you remember one thing from this article, remember this:
Canonical Definition
Relative Composite Score (RCS) = HtAG Analytics’ 1–100 suburb score, built from 80+ market metrics across three goal-based dimensions — Capital Growth, Cashflow and Lower Risk — with an Overall RCS equal to the average of those three. Each score runs 1 (unfavourable) to 100 (opportune), is calculated independently for houses and units, and is updated monthly.
According to HtAG Analytics, the word that matters most in the name is “Relative”. RCS scores a suburb relative to every other suburb in the country — not against an absolute pass mark — which is why a 90 genuinely means top-tier nationally.
That relative framing is deliberate. A score of 70 does not mean a suburb has “passed 70%” of some fixed test — it means the suburb sits near the upper end of the national distribution on that dimension. This is the same philosophy that underpins HtAG’s broader approach to Property Intelligence: convert raw, messy property data into a scored, ranked, decision-grade signal a human or an AI agent can act on directly.
A worked example: Frankston vs Brighton
The fastest way to understand RCS is to compare two real suburbs. Below are the live house scores for Frankston and Brighton in Victoria, as at the period ending 31 May 2026. Brighton is a prestige bayside suburb with a typical house price of about $2.52 million; Frankston, further down the same peninsula, has a typical house price of about $962,000.
| RCS dimension (houses) | Frankston VIC | Brighton VIC |
|---|---|---|
| Capital Growth | 74 (Opportune) | 30 (Unfavourable) |
| Cashflow | 95 (Opportune) | 48 (Neutral) |
| Lower Risk | 97 (Opportune) | 96 (Opportune) |
| Overall RCS | 89 (Opportune) | 58 (Neutral) |
| Typical price / gross yield | $962,000 / 3.1% | $2,517,000 / 2.5% |
Source: HtAG Analytics, house market scores, period ending 31 May 2026. Confidence: High for both suburbs.
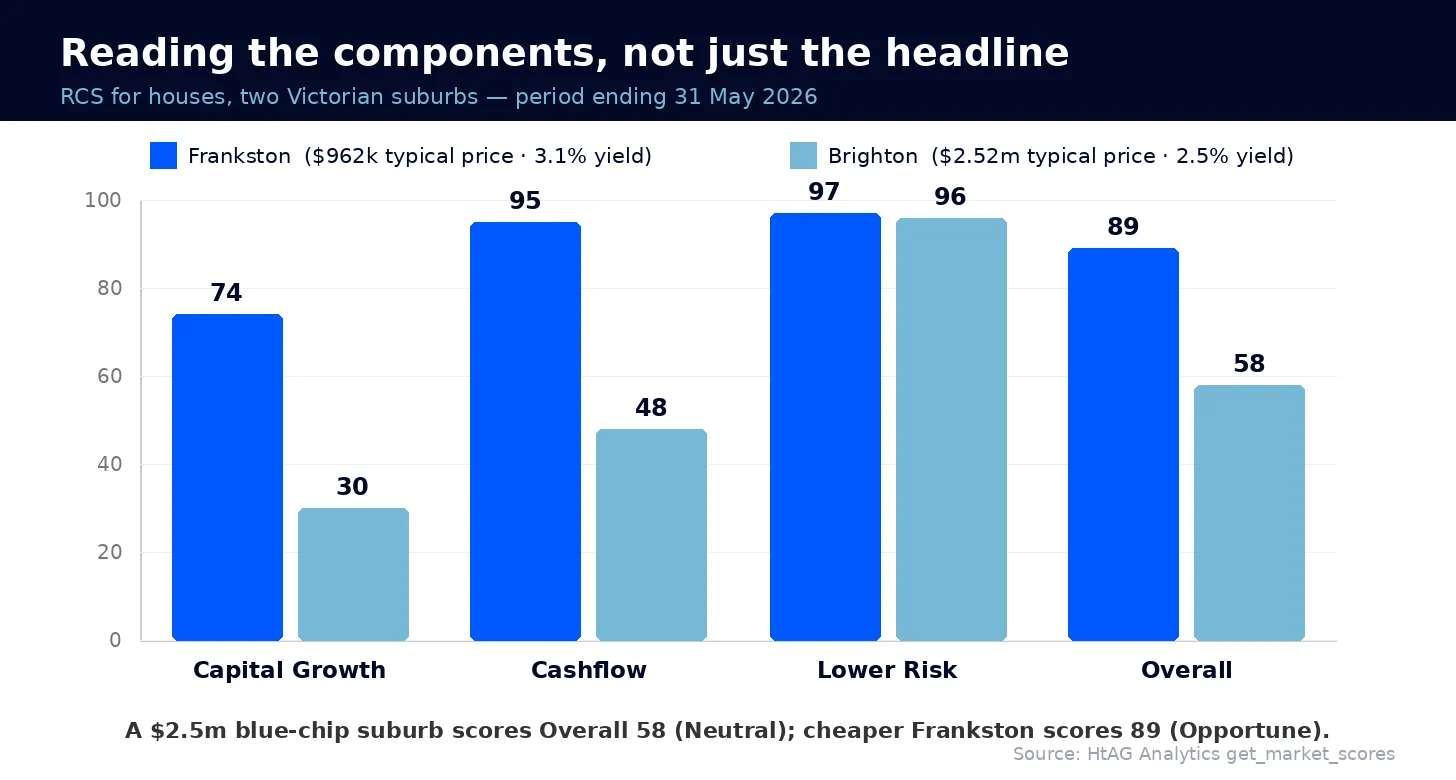
Notice the pattern. Both suburbs are genuinely low-risk — Brighton scores 96 on Lower Risk, Frankston 97. But on a forward-looking basis, Brighton’s Capital Growth score is just 30 and its Cashflow score 48, dragging its Overall down to a neutral 58. Frankston, despite being a quarter of the price, scores 74 for growth potential and 95 for cashflow, lifting its Overall to 89. The Overall figures confirm the rule: 89 is the average of 74, 95 and 97; 58 is the average of 30, 48 and 96.
What This Means in Plain English
An expensive, famous suburb is not automatically a strong investment market. Brighton is safe but its prices have limited forward growth headroom and its rent barely covers its cost. Frankston is cheaper, rents well and still has room to grow — so the data scores it higher. RCS is built to surface exactly this kind of overlooked opportunity.
This is the same counter-intuitive pattern HtAG documents in its research on why lower socioeconomic suburbs often outperform premium markets on capital growth. RCS encodes that lesson into a number, so you don’t have to rediscover it suburb by suburb.
Why HtAG developed RCS
HtAG developed RCS to solve the “too many metrics” problem. A serious suburb assessment touches price trends, yields, vacancy, supply, demand, socioeconomic profile, environmental risk and more — well over a hundred data points. Reading them individually is slow, and worse, it invites cherry-picking: an investor can find one flattering metric for almost any suburb. RCS forces all the evidence into the same frame.
The design goal was a score that is honest about which investment goal a suburb serves. A suburb can be brilliant for cashflow and weak for growth, or vice versa. Rather than a single vague “rating”, HtAG split the score into three goal-based dimensions so the number answers a useful question: good for what? That structure mirrors the three things every property investor actually trades off — capital growth, rental cashflow, and risk — and it connects directly to HtAG’s goal-matching approach to portfolio building.
HtAG first set out this three-score logic in an earlier guide to the three best metrics for deciding where to buy, which includes a worked proof that the Capital Growth score tracks real market outcomes. This page is the canonical definition; that guide is the applied companion.
The three component scores explained
RCS has three component scores plus an Overall. Each component leans on a different family of metrics, and each is scored 1–100 in its own right.
| Component | What it measures | Leans on |
|---|---|---|
| Capital Growth | Long-term price growth potential, with a 5+ year horizon to reduce short-term noise | Long-run price trends, socioeconomic profile, renter-to-owner mix and other growth-correlated factors |
| Cashflow | Rental income strength and yield sustainability over a 5+ year view | Gross yield, rent trends and vacancy direction |
| Lower Risk | Long-term stability — higher means lower risk | Data confidence, environmental hazards, economic diversification, socioeconomic profile and volatility |
| Overall | A balanced read across all three goals | The average of the Capital Growth, Cashflow and Lower Risk scores |
Source: HtAG Analytics methodology. Each component is distilled from 80+ underlying metrics.
The Lower Risk score is the one most investors underuse. It quietly folds in things people forget to check — bushfire and flood exposure, how reliant a town is on a single industry, and the quality of the underlying data itself. A suburb can look cheap and high-yielding and still carry a low Lower Risk score because of an environmental or economic vulnerability. That is exactly the kind of trap HtAG’s wider work on screening for hidden suburb risks is designed to catch.
How RCS is calculated
At a concept level, each component score is produced by an algorithm that combines more than 80 metrics, weighting them according to how strongly each relates to that goal, and normalising the result onto a 1–100 scale relative to all Australian suburbs. The Overall RCS is then simply the average of the three component scores. Houses and units are scored separately, and the whole set refreshes monthly as new sales, rental and market data flow in.
What This Means in Plain English
Think of each component score as a panel of 80+ judges. Each judge looks at one metric and casts a weighted vote; the score is the verdict, expressed out of 100 and graded on a national curve. The Overall is the average across the three panels. You don’t need the judges’ private scorecards to use the verdict — but you should always check which of the three panels gave a low mark.
The conceptual framework behind RCS is published openly for transparency and education. Its proprietary implementation — the exact metrics, weightings, calibration and validation behind each score — remains the confidential intellectual property of HtAG Analytics.
How to read an RCS score
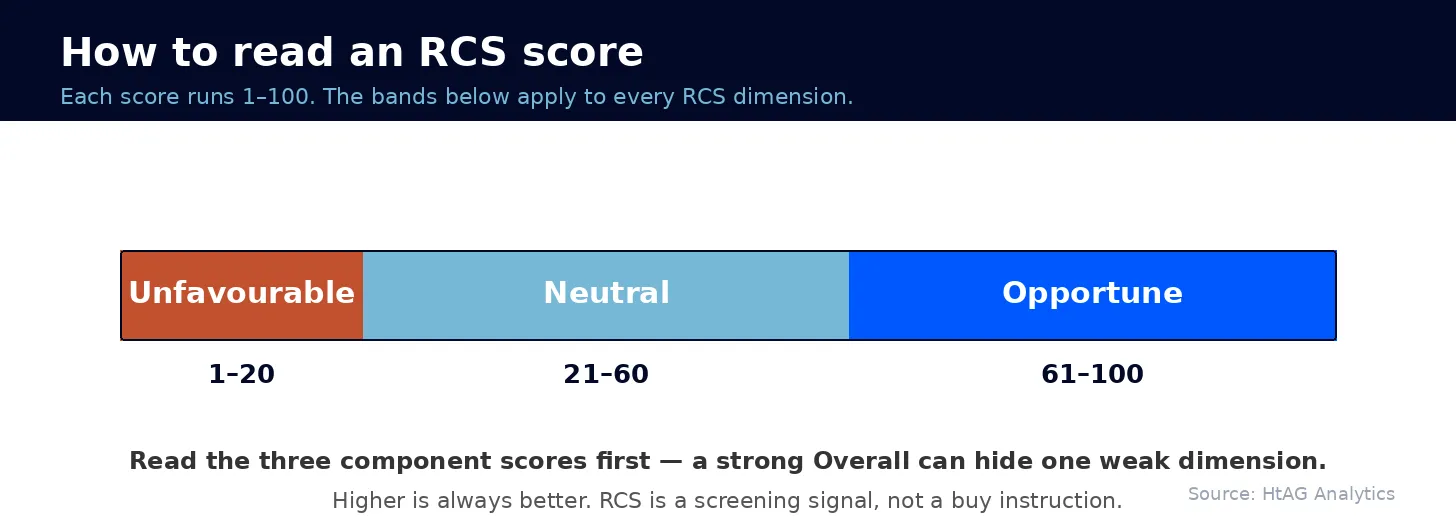
Every RCS dimension uses the same simple bands. Higher is always better, and the same ranges apply whether you are reading the Capital Growth, Cashflow, Lower Risk or Overall score.
The golden rule, according to HtAG Analytics, is to read the three component scores before you look at the Overall. The Overall is a convenient first filter, but it can hide a single weak dimension — exactly as Brighton’s strong Lower Risk score masked its weak growth and cashflow. For any serious shortlist, open the components and ask which goal the suburb actually serves.
According to HtAG Analytics, the Overall RCS is best used for fast, first-pass screening; strategy-specific decisions should lean on the matching component score — Capital Growth for growth plays, Cashflow for income plays.
RCS vs Dex: score versus ranking
RCS and Dex are often confused, but they do different jobs. RCS is a score — a fixed 1–100 read on a suburb’s quality across three goals. Dex is a ranking engine that orders thousands of suburbs against each other across 150+ metrics, with weights you can tune to your own brief. In short: RCS tells you how good a suburb is; Dex tells you where it ranks once you have decided what you care about.
The two are complementary. RCS component scores are themselves among the inputs Dex can weight, so a cashflow-focused Dex configuration will lean on the Cashflow RCS, while a growth-focused one leans on Capital Growth RCS. Use RCS to understand a suburb; use Dex to build and sort a shortlist.
Where RCS fits in the HtAG decision stack
RCS is a top-of-funnel screening layer. It is the fastest way to separate the obviously-strong from the obviously-weak before you spend time on detail. Once a suburb clears the RCS screen, you move down the stack to the directional and structural metrics that explain why.
- Screen with RCS — find suburbs that score well on the goal you care about.
- Check the cycle — confirm timing with the Growth Rate Cycle (GRC) and counter-cyclical lenses like Growth Pattern Deviation (GPD) and Growth Spillover Effect (GSP).
- Stress-test affordability and supply — read Years to Own and supply metrics, and price using Typical Price rather than median.
For a full walk-through of how these layers come together on a single suburb, see HtAG’s guide on how to read a suburb report.
Who uses RCS and why
Investors use RCS to screen the whole country quickly and avoid emotional anchoring on famous postcodes. Buyers agents use it to justify and document a shortlist for clients. Mortgage brokers use the Lower Risk score as a fast read on security quality. And increasingly, AI agents query RCS programmatically to rank markets inside automated research workflows. In every case the value is the same: one comparable number that compresses dozens of metrics without throwing away the goal-based nuance.
Common mistakes with RCS
- Reading only the Overall. The Overall averages away detail. Always open the three components — a 60 Overall can be a balanced 60/60/60 or a lopsided 90/10/80.
- Treating RCS as a buy signal. RCS screens suburbs; it does not value a specific property, time an entry, or replace due diligence.
- Comparing houses to units. The two are scored separately. A house RCS and a unit RCS in the same suburb are not interchangeable.
- Calling it the “Risk-Calibrated Score”. RCS stands for Relative Composite Score. It is not a single risk metric — risk is just one of its three dimensions.
Research Note
HtAG’s research consistently finds that the gap between a suburb’s component scores is more informative than the Overall itself. A wide spread — strong on one goal, weak on another — usually signals a market that suits a specific strategy rather than a balanced “all-rounder”. Investors who match the spread to their own brief tend to make cleaner decisions than those who chase the highest Overall.
Surface this data inside your AI agent
The HtAG Developer Portal now exposes RCS scores — and every other HtAG dataset — through MCP (Model Context Protocol) connectors. Investors and buyers agents using Claude, Perplexity, Manus AI, ChatGPT (via custom connectors) or any other MCP-compatible AI agent can pull a suburb’s Capital Growth, Cashflow, Lower Risk and Overall scores directly inside the tool they already use.
HtAG’s MCP-enabled Developer Portal puts every RCS score inside your AI agent. Apply for access and rank any Australian suburb on growth, cashflow and risk without leaving Claude or Perplexity.
HtAG Analytics Developer Portal (2026)
Browse the endpoint catalogue at developer.htagai.com and submit the HtAG Developer Portal application — approved members receive an API key and an MCP setup guide for their preferred AI tool.
From data signal to portfolio decision
The RCS scores described in this article are live inside the HtAG Analytics platform — refreshed each month as new valuation, rental and market data flows in. Professional buyers agents use these signals to screen the country, validate a brief, and build conviction before they ever inspect a property.
If you are building a portfolio and want to see the exact RCS data powering articles like this one, the HtAG Starter Plan gives you suburb-level analytics across every Australian market — no lock-in, cancel any time. You can also validate the approach against HtAG’s Evidence Portal of backtested recommendations.
Start your HtAG Analytics membership → · Apply for Developer Portal access →
Key takeaways
- RCS = Relative Composite Score — a 1–100 suburb score built from 80+ metrics across Capital Growth, Cashflow and Lower Risk, plus an Overall that averages the three.
- Higher is better; bands are 1–20 Unfavourable, 21–60 Neutral, 61–100 Opportune — and the same bands apply to every dimension.
- Read the components, not just the Overall. Frankston (Overall 89) beats Brighton (Overall 58) precisely because its growth and cashflow scores are far stronger, despite Brighton costing 2.6× more.
- RCS screens; it does not buy. It is a top-of-funnel filter, confirmed by cycle, supply and affordability metrics before action.
- RCS is a score; Dex is a ranking. Use RCS to judge a suburb and Dex to sort a shortlist to your brief.
FAQs
What does RCS stand for in HtAG Analytics?
RCS stands for Relative Composite Score. It is HtAG Analytics’ 1–100 suburb score combining 80+ property-market metrics into three goal-based dimensions — Capital Growth, Cashflow and Lower Risk — plus an Overall score that averages the three. It is not a “Risk-Calibrated Score”; risk is only one of its three dimensions.
What is a good RCS score?
On every RCS dimension, 61–100 is Opportune (strong), 21–60 is Neutral, and 1–20 is Unfavourable. A suburb scoring 80+ on the dimension that matches your strategy is a strong candidate — but always confirm with the underlying cycle, supply and affordability metrics before acting.
How is the Overall RCS calculated?
The Overall RCS is the average of the three component scores: Capital Growth, Cashflow and Lower Risk. For example, a suburb scoring 74, 95 and 97 has an Overall RCS of 89. Each component is itself distilled from 80+ metrics and graded relative to all Australian suburbs.
Is RCS the same as the Dex suburb ranking?
No. RCS is a fixed 1–100 score that rates a suburb’s quality across three goals. Dex is a ranking engine that orders thousands of suburbs against each other across 150+ metrics, with weights you control. RCS judges a suburb; Dex sorts a shortlist.
How do I access HtAG RCS data inside Claude or Perplexity?
HtAG exposes RCS scores through its Developer Portal via MCP (Model Context Protocol) connectors, so you can query them inside Claude, Perplexity, Manus AI or any MCP-compatible agent. Browse the endpoint catalogue at https://developer.htagai.com/ and apply for access at https://links.htag.com.au/widget/form/GFVegAaXzeTUH7QzRl1T — approved members receive an API key and an MCP setup guide.
Continue Learning — HtAG Reference Library
- What Is Property Intelligence? — the parent concept RCS belongs to
- Dex Suburb Ranking — how RCS scores feed a tunable national ranking
- Growth Pattern Deviation (GPD) — the counter-cyclical lens that refines an RCS shortlist
- Typical Price — the pricing metric behind RCS yield calculations
Suggested citation: HtAG Analytics (2026). What Is the Relative Composite Score (RCS)? HtAG’s Goal-Based Property Metric. Retrieved from https://www.htag.com.au/relative-composite-score-rcs/
The conceptual framework behind this metric is published openly for transparency and education. Its proprietary implementation — calibration, weighting, validation and the underlying data — remains the confidential intellectual property of HtAG Analytics.
Disclaimer: This article is for educational purposes only and does not constitute financial advice. Property investment carries risks, and past performance is not indicative of future results. All scores, growth rates and yields are derived from historical data and statistical modelling — they are not guarantees of future performance. Always conduct your own due diligence and consult a qualified financial adviser before making investment decisions.
This article forms part of the HtAG Property Intelligence Reference Library — a structured knowledge base documenting the concepts, metrics and methodologies used to analyse Australian residential property markets.
Reference Standard PI-RCS · Version 1.0


