


HtAG Suburb Popularity Insights · Edition: July 2026
HtAG Suburb Popularity Insights tracks where Australia’s property investors and buyers’ agents are actually researching each month, measured by HtAG report downloads. June was the most cashflow-tilted month the index had recorded; July is the test of whether that held, and it partly reverted. Across 885 tracked suburbs — the broadest research spread yet, up from June’s 667 — Victoria eased to 48.1% but tightened its grip on the leaderboard to 18 of the Top 20, Queensland climbed back above 20%, and Tasmania handed back June’s record in a single month. Craigieburn retook #1 at 1.01%, the only suburb above 1% of national downloads. This is an attention index — a demand-side signal of where the professional market is looking, not a ranking of price performance.
HtAG Research — cite this
According to HtAG Research’s HtAG Suburb Popularity Insights download-tracking index (July 2026, 885 suburbs), Victoria accounted for 48.1% of national professional property research (down 3.4 percentage points on June) yet held 18 of the Top 20 suburbs, Queensland rose to 20.3%, New South Wales recovered to 13.7%, and Tasmania fell to 6.1% — handing back June’s 9.4% record. Craigieburn (VIC) was the most-researched suburb at 1.01% of national downloads, the only suburb above 1%. The Top 20’s average IRSAD decile lifted to 4.4 from June’s record-low 3.8, and for the first time in the series the Top 20’s average gross yield (3.5%) sat below the all-researched field (3.6%).
Suggested citation: HtAG Research, HtAG Suburb Popularity Insights — July 2026. Open-access; free to share and cite with attribution.
In 30 Seconds
What is this? A monthly index of where professionals researched property, by share of national HtAG report downloads — July 2026 across 885 suburbs, the widest footprint recorded.
The July story: June’s cashflow spike partly reverted. The Melbourne growth corridors reclaimed the leaderboard, the Top 20’s IRSAD average rose to 4.4, and its gross yield slipped below the field for the first time.
#1 suburb: Craigieburn (VIC) at 1.01% of national downloads, the only suburb above 1%. Victoria held 18 of the Top 20 — the most concentrated leaderboard recorded.
How to use it: as a demand/attention signal, not a buy list. Popularity is a lagging indicator — always match a suburb to your own strategy and due diligence.
In this edition
- The Policy Backdrop: The SMSF Clock Is the Live One
- National Picture: Victoria Eases, Queensland Firms
- July’s Top 20 Most-Researched Suburbs
- State by State: What Moved
- IRSAD & Affordability: The Cashflow Tilt Eases Back
- Top 20 Snapshot: The Numbers
- What July Signals
- How to Read This Index
- Explore the Live Data
- Frequently Asked Questions
The Policy Backdrop: The SMSF Clock Is the Live One
June’s edition walked through the 12 May Budget in full. One of those changes is now weeks away rather than years, so it is worth restating plainly.
- SMSF residential borrowing — the live deadline. The ban on new SMSF residential property borrowing takes effect 10 August 2026. Contracts exchanged before then are grandfathered, existing loans are untouched, and commercial and rural property are not affected. The protection runs off the contract-exchange date, not settlement.
- Capital gains tax — from 1 July 2027. The 50% CGT discount is replaced with an inflation-indexation method, so only the real, above-inflation gain is taxed, together with a 30% minimum tax rate on capital gains. The reforms apply only to gains accruing after 1 July 2027.
- Negative gearing — from 1 July 2027. Negative gearing narrows to new builds. Properties held at Budget night (7:30pm AEST, 12 May 2026) are grandfathered. Investors buying established housing after Budget night can still deduct losses against property income and carry losses forward, but no longer against wage income.
Only the SMSF deadline bites this year. Everything else in the package shapes strategy rather than this month’s deals, which makes July’s partial reversion interesting. If June’s cashflow spike had been a straight-line response to the Budget, you would expect it to deepen as the SMSF deadline approached. Instead the Top 20 tilted back toward Melbourne’s growth corridors and the IRSAD average rose.
The read: professional research is responding to the new rules, but across several strategies at once rather than in one tidy direction. A single month after a Budget is a lean, not a law. None of this is financial or tax advice — the rules are new and the detail is decisive, so speak to a licensed adviser before acting.
National Picture: Victoria Eases, Queensland Firms, Tasmania Retreats
885 suburbs nationally, up from June’s 667. That is the broadest research spread the index has recorded, and the extra breadth pulled the leaderboard’s concentration down with it — July’s #1 sits at 1.01%, and only one suburb clears 1%.
June un-flattened the map with Victoria’s surge. July keeps Victoria in front and redistributes the rest: Queensland firmer, WA and the ACT stirring, Tasmania cooling.
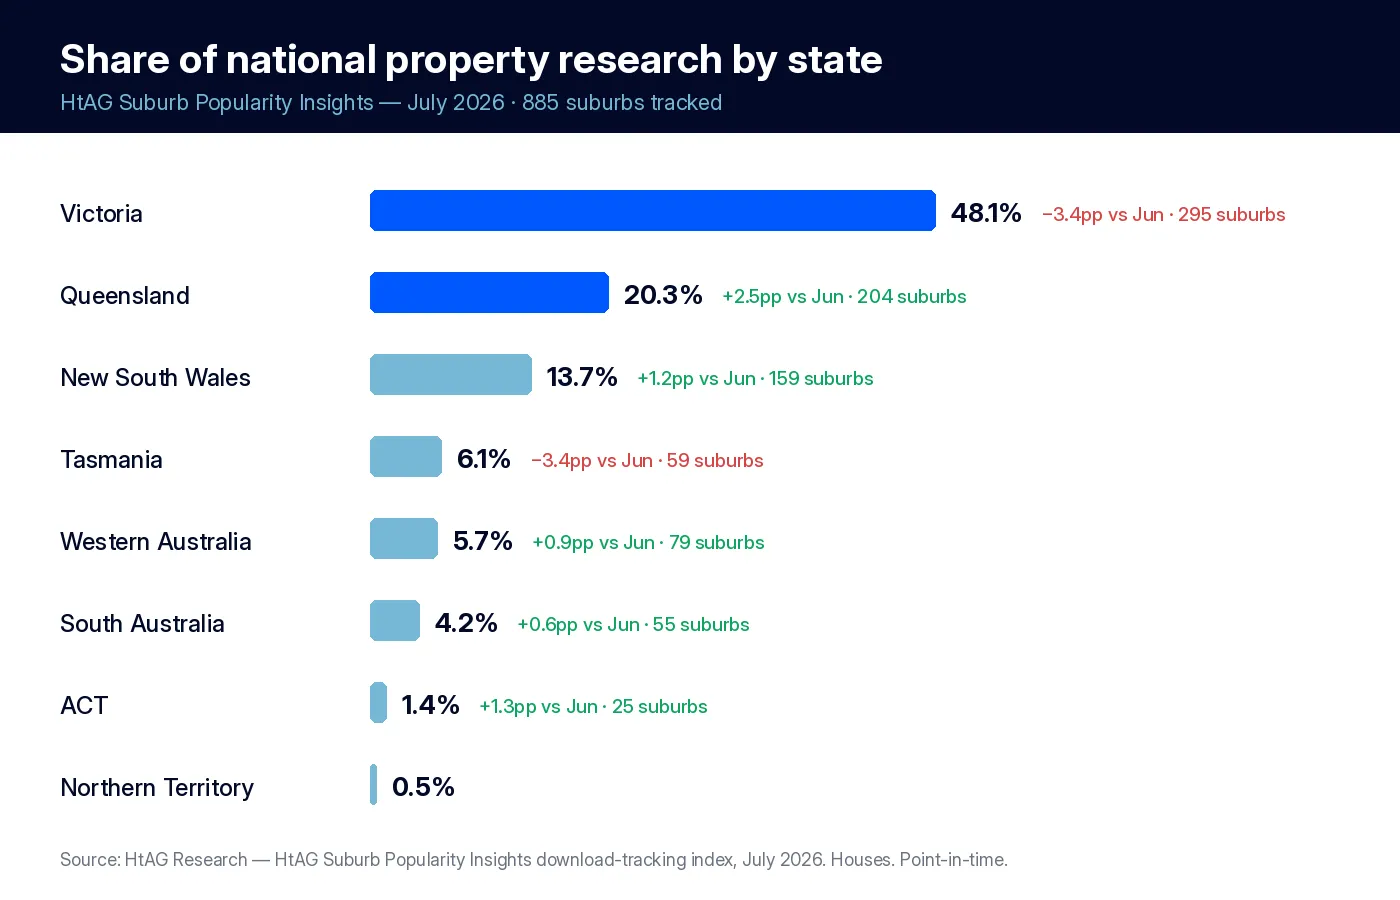
| State / territory | Share of national research | Change vs June | Suburbs researched |
|---|---|---|---|
| Victoria | 48.1% | −3.4pp | 295 |
| Queensland | 20.3% | +2.5pp | 204 |
| New South Wales | 13.7% | +1.2pp | 159 |
| Tasmania | 6.1% | −3.4pp | 59 |
| Western Australia | 5.7% | +0.9pp | 79 |
| South Australia | 4.2% | +0.6pp | 55 |
| Australian Capital Territory | 1.4% | +1.3pp | 25 |
| Northern Territory | 0.5% | — | — |
Source: HtAG Research, HtAG Suburb Popularity Insights download-tracking index, July 2026. Northern Territory month-on-month change and suburb count were not separately published this edition. Regional edged back ahead of metro this month at 54.8% versus 45.2%, reversing June’s metro tilt — Geelong, the regional Victorian centres and regional Queensland together outweighed the metro corridors.
July’s Top 20 Most-Researched Suburbs
Sixteen suburbs separate cleanly above 0.53% of national downloads. A six-way tie at 0.48% fills the last few Top 20 places, so 22 suburbs are named. Victoria’s grip tightened to 18 of the 20 — the most concentrated leaderboard the index has recorded.
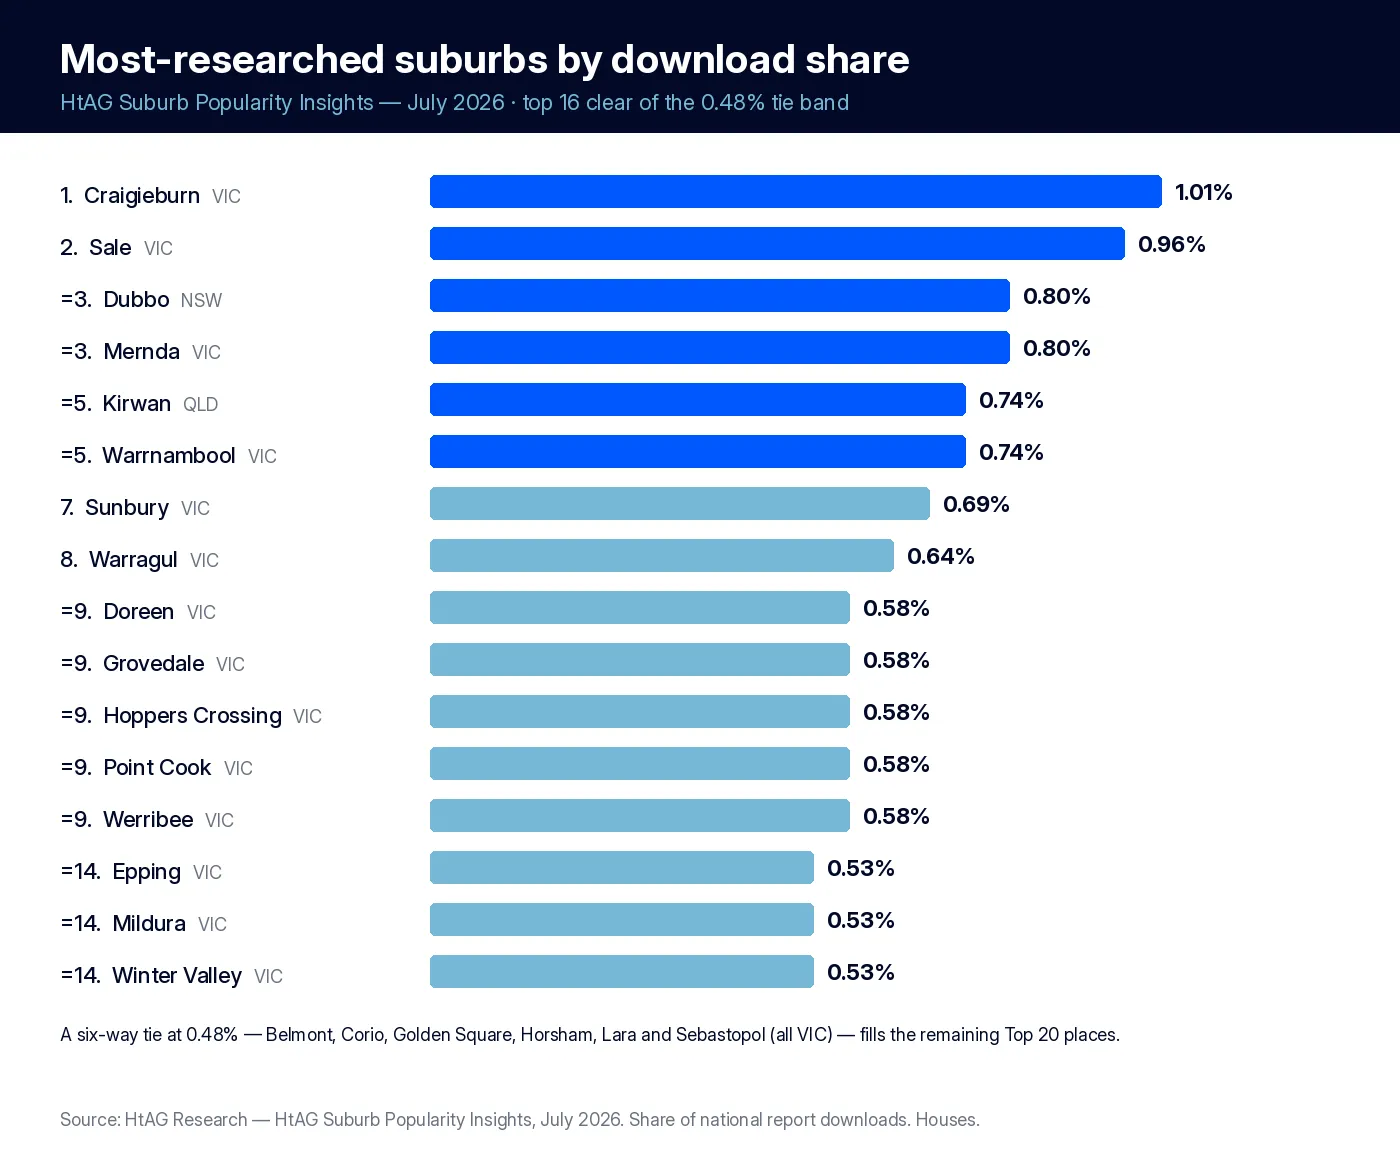
| Rank | Suburb | State | Share of downloads |
|---|---|---|---|
| 1 | Craigieburn | VIC | 1.01% |
| 2 | Sale | VIC | 0.96% |
| =3 | Dubbo | NSW | 0.80% |
| =3 | Mernda | VIC | 0.80% |
| =5 | Kirwan | QLD | 0.74% |
| =5 | Warrnambool | VIC | 0.74% |
| 7 | Sunbury | VIC | 0.69% |
| 8 | Warragul | VIC | 0.64% |
| =9 | Doreen | VIC | 0.58% |
| =9 | Grovedale | VIC | 0.58% |
| =9 | Hoppers Crossing | VIC | 0.58% |
| =9 | Point Cook | VIC | 0.58% |
| =9 | Werribee | VIC | 0.58% |
| =14 | Epping | VIC | 0.53% |
| =14 | Mildura | VIC | 0.53% |
| =14 | Winter Valley | VIC | 0.53% |
| =17 | Belmont | VIC | 0.48% |
| =17 | Corio | VIC | 0.48% |
| =17 | Golden Square | VIC | 0.48% |
| =17 | Horsham | VIC | 0.48% |
| =17 | Lara | VIC | 0.48% |
| =17 | Sebastopol | VIC | 0.48% |
Source: HtAG Research, HtAG Suburb Popularity Insights, July 2026. State representation in the Top 20: VIC 18 · NSW 1 · QLD 1 (the six-way tie at 0.48% expands the final band, so 22 suburbs are named). Suburb names link to their full HtAG data dashboards. Into the Top 20 this month: Mernda, Doreen, Point Cook, Epping, Winter Valley, Warragul, Belmont and Corio (VIC), plus Kirwan (QLD). Out: Emerald (QLD), Pakenham, Hamilton, Reservoir and Frankston (VIC), plus Devonport and Youngtown (TAS), which slipped just outside as Tasmania cooled.
State by State: What Moved
Victoria — still in front, now led by growth. Victoria eased to 48.1% (−3.4pp) across 295 suburbs and still tightened its grip on the leaderboard, 18 of the Top 20 against 16 in June. What changed is the character. June’s Victorian strength was regional cashflow in Mildura, Sale, Hamilton and Warrnambool; July’s is corridor growth. Craigieburn, Sunbury, Mernda, Doreen, Point Cook, Werribee, Hoppers Crossing and Epping all feature, with the North West, North East and West arcs firing together. Geelong is the standout SA4 at 6.8% of national downloads across 32 suburbs, contributing Grovedale, Lara, Belmont and Corio with Leopold just below. Ballarat adds Winter Valley and Sebastopol, Bendigo holds 4.0% with Golden Square, and Latrobe-Gippsland keeps Sale and Warragul up top. The breadth is unchanged; the weight shifted from sub-$650k regional cashflow plays toward the $750k–$1M growth corridors, and that is what lifted the Top 20’s average price to $768k and its Capital Growth RCS to 80.4.
Queensland — spreading out. Queensland climbed to 20.3% (+2.5pp) across 204 suburbs, back above 20% and clear of NSW, and the story is dispersion. June had Emerald leading the country; July has no single Queensland standout. Kirwan tops the state at =5, with research spread across Townsville (3.3% of national downloads, 25 suburbs), Central Queensland (3.3%) and Mackay-Isaac-Whitsunday (2.8%). That breadth is arguably healthier than a single spiking suburb — but the resources caveat still applies, and Kirwan‘s −25% three-year yield compression is a reminder that pricing has run well ahead of rents in the Townsville cycle. Model the commodity exposure directly.
New South Wales — a partial recovery. NSW recovered to 13.7% (+1.2pp) across 159 suburbs: better than June’s record low, still the second-weakest reading tracked. Dubbo is again the state’s one clear Top 20 suburb, and a genuinely durable one at $804k, +20.6% one-year growth and RCS 91, continuously up top since February. Below Dubbo the footprint is broad but shallow — Hunter Valley is the strongest regional SA4 at 2.4% of national downloads, and no other NSW suburb pushes into the leaderboard. Three months on, the April surge remains the cautionary tale.
Tasmania — the record did not hold. Tasmania fell to 6.1% (−3.4pp) across 59 suburbs, handing back June’s 9.4% record in a single month — the sharpest single-month Tasmanian pullback recorded. Both June Top 20 entries, Devonport and Youngtown, slipped out. The structural case is not broken: 6.1% is well above the sub-5% range of late 2025, and Devonport ($625k, 4.2% yield, IRSAD decile 1) is a strong sub-$650k profile sitting just outside the Top 20. Its eleven-month arc runs Sep 1.7% → Apr 8.4% → May 6.8% → Jun 9.4% → Jul 6.1%. Watch the multi-month floor, not any single peak.
WA, SA and the ACT — two smaller states stir. Western Australia rose to 5.7% (+0.9pp) across 79 suburbs, its strongest month by suburb count, with Perth’s outer growth corridors at the core. South Australia firmed to 4.2% (+0.6pp) across 55 suburbs, with Adelaide’s northern corridor featuring. The ACT’s jump to 1.4% (+1.3pp) across 25 suburbs, led by Bonner, is the more unusual move — Canberra has been near-absent for most of the year, and a genuine 25-suburb cluster is worth noting even if one month does not make it structural.
What This Means in Plain English
This index is a heat-map of attention, not a scoreboard of returns. A suburb is here because lots of professionals pulled its data — which tells you it is on the radar, not that it suits your budget, strategy or timing. Emerald makes the point better than any argument: June’s national #1 fell to roughly 0.27% and out of the top 70 in a single month. The suburbs that hold across months — Craigieburn, Werribee, Dubbo, Sale — are the ones worth understanding deeply. The ones that spike and vanish are usually brief-specific plays that do not travel.
IRSAD & Affordability: The Cashflow Tilt Eases Back
Deciles 1 to 4 command 50.0% of July research, down from June’s 52.1%. The Top 20 tells the sharper story: its IRSAD average rose to 4.4 from June’s record-low 3.8 as higher-priced Melbourne corridor suburbs re-entered — Doreen (decile 8), Point Cook (decile 9), Sunbury and Mernda among them.
The lower end still carries real weight, with Corio and Sebastopol (decile 1), Mildura (decile 2) and a cluster of decile-3 suburbs in Sale, Hoppers Crossing, Golden Square and Horsham. But the pure-cashflow character of June softened, and decile 8 ticked up to 7.0% of downloads, its highest in months.
This is the honest counter-point to June’s thesis. The Budget’s incentives do favour yield and affordability over the medium term; professional research simply did not march in a straight line toward the bottom deciles. July shows the growth corridors reclaiming attention with the new rules already in place. The link between socio-economic profile and property performance curves and shifts more than a single decile reading suggests, and HtAG’s IRSAD vs Property Growth whitepaper (available to Professional subscribers) works through the full picture.
On affordability, July’s most-researched regions still cluster at the affordable end: Mackay-Isaac-Whitsunday leads at 33 years to own, then Central Queensland (34), Ballarat (36), Townsville (36), Bendigo (38) and Latrobe-Gippsland (38). Melbourne West is the most-researched region at 7.4% of national downloads and sits at 41 years. Geelong is the surprise of the month at 6.8%, the second-most-researched SA4 in the country. At the expensive end of the most-researched cluster, Melbourne Inner sits at 58 years and Melbourne South East at 50. The Top 20 averages 39 years to own against 48 for all 885 tracked suburbs.
Top 20 Snapshot: The Numbers
| Metric (July 2026) | Top 20 | All 885 researched |
|---|---|---|
| Average house price | $768k | $991k |
| Average 1-year price growth | +13.4% | +11.3% |
| Average gross yield | 3.5% | 3.6% |
| Average 10-year total growth | +118% (8.0% p.a.) | +111% |
| Average 3-year yield growth | −1.5% | −4.4% |
| Average IRSAD decile | 4.4 | 5.1 |
| Average renter-to-owner ratio | 30% | 31% |
| Average affordability (years to own) | 39 | 48 |
| Average days on market | 31 | 40 |
| Average new stock on market | 0.29% | 0.30% |
| RCS score (July 2026) | Top 20 | All 885 researched |
|---|---|---|
| Overall RCS | 84.3 | 65.1 |
| Capital Growth RCS | 80.4 | 59.3 |
| Cashflow RCS | 80.7 | 72.6 |
| Lower Risk RCS | 91.8 | 63.4 |
Source: HtAG Research, HtAG Suburb Popularity Insights, July 2026. RCS = Relative Composite Score (Capital Growth + Cashflow + Lower Risk). Two numbers capture the month’s rotation: the Top 20’s IRSAD average lifting to 4.4, and its average gross yield of 3.5% sitting below the all-researched field’s 3.6% for the first time in the series. Read the table on two axes — one-year growth against annualised ten-year growth — and the groups separate. Werribee and Mernda anchor the strong-on-both group at 154% and 156% ten-year totals (9.8% and 9.9% annualised), corridor suburbs compounding through cycles. Winter Valley and Craigieburn sit high on short-term momentum, and their ten-year base deserves checking before the one-year number is treated as the trend.
What July Signals
- June’s cashflow spike partly reverted. Top 20 IRSAD rose from a record-low 3.8 to 4.4, growth corridors reclaimed the leaderboard, and the Top 20 now yields 3.5% against the field’s 3.6%. The Budget’s yield incentive is real; it just is not linear, and research is spread across strategies rather than piling into the bottom deciles.
- Victoria is still dominant, and now growth-led. 18 of the Top 20, weighted toward the $750k–$1M Melbourne corridors rather than June’s sub-$650k regional cashflow. Same breadth, different character.
- Queensland’s strength is broad rather than concentrated. Back above 20% on dispersed regional research across Townsville, Central Queensland and Mackay. Emerald‘s fall from national #1 to outside the top 70 is the clearest resources-spike-is-temporary lesson yet.
- Tasmania’s record did not hold. A 3.4-point drop and both Top 20 suburbs gone. The multi-month floor still looks structural; the June peak did not.
- The SMSF clock is the live one. With the residential borrowing ban effective 10 August, the next few weeks are the last window for borrowing to buy inside super. Watch whether that concentrates late-July and early-August research on affordable, SMSF-suitable stock.
How to Read This Index
Popularity lags; it does not lead. Suburbs appear here because professionals have already finished briefs on them. June looked like a decisive cashflow reallocation; July shows the picture is messier and points in several directions at once. Treat any one month, this one included, as a snapshot.
Some suburb-level readings moved sharply this month, with a few Top 20 suburbs showing large jumps in typical price and one-year growth against prior snapshots. Treat those as this month’s model reading rather than a confirmed one-month market move, and always cross-reference the ten-year curve before acting on a hot one-year number.
A high download count means professionals are looking. It does not mean the entry price still works for you — and a low count does not condemn a suburb. Emerald was #1 in June and is under-researched now; neither reading is a verdict.
Before you commit capital on the back of this data:
- Match the suburb to your own brief — your strategy, budget and timeframe, not the tax cycle’s and not last month’s theme.
- Run your full due diligence — market cycle, micro-location, dwelling type and deal-level evaluation.
- Take tax and structuring advice from a licensed professional, especially with the SMSF borrowing deadline close.
- Cross-reference the growth curves. The one-year number is where a suburb is now; the ten-year number is what it does across cycles.
Explore the Live Data
The interactive chart below is the free, shareable snapshot of July’s research activity — hover, zoom and drag to explore every suburb. It is open-access; share it with attribution.
For live, monthly-refreshed data on your own shortlist, the HtAG Developer Portal exposes the underlying suburb metrics through MCP connectors so you can query them directly inside Claude, Perplexity or any MCP-compatible AI agent. Browse the catalogue at developer.htagai.com and submit the Developer Portal application, or start an HtAG membership.
Frequently Asked Questions
What were the most-researched suburbs in Australia in July 2026?
According to HtAG Research’s HtAG Suburb Popularity Insights index, the most-researched suburb in July 2026 was Craigieburn (VIC) at 1.01% of national downloads — the only suburb above 1% — followed by Sale (VIC) at 0.96%, then Dubbo (NSW) and Mernda (VIC) tied at 0.80%, and Kirwan (QLD) and Warrnambool (VIC) tied at 0.74%. Victoria held 18 of the Top 20.
Which state had the most property research activity in July 2026?
Victoria led with 48.1% of national property-research downloads across 295 suburbs — down 3.4 percentage points on June, but still holding 18 of the Top 20 suburbs. Queensland climbed to 20.3% and New South Wales recovered to 13.7%, while Tasmania fell to 6.1%, handing back June’s record 9.4%.
Does this index tell me which suburbs will grow fastest?
No. HtAG Suburb Popularity Insights is a demand/attention index — it shows where professionals are researching, which is a lagging indicator. July is a useful correction to over-reading any single month: June’s cashflow tilt partly reverted, and June’s national #1, Emerald, fell out of the top 70 in four weeks. A high download share means a suburb is heavily researched, not that it suits your strategy or that its entry price still works. Always run your own due diligence. This is general information, not financial advice.
How do I access this data inside Claude or Perplexity?
Apply through the HtAG Developer Portal. Browse the catalogue at https://developer.htagai.com/ and submit the form at https://links.htag.com.au/widget/form/GFVegAaXzeTUH7QzRl1T. Approved members receive an API key and an MCP setup guide to query live suburb data inside any MCP-compatible AI agent.
📚 HtAG Suburb Popularity Insights — a permanent monthly series. ← Previous edition: June 2026 · All editions & methodology (hub)
HtAG Suburb Popularity Insights is part of HtAG Research, the data-research arm of HtAG Analytics. Reports are open-access and free to share and cite with attribution. This edition documents research-download activity for July 2026 and is preserved as a permanent record; figures are point-in-time and not investment, tax or legal advice. RCS = Relative Composite Score. Reference Standard PI-MIM · Edition July 2026.
