


Short Summary
Property analytics turns raw property data into measured metrics and trends that describe what a market has done and is doing now. This guide defines property analytics, shows a worked example using live HtAG Analytics data for Frankston, Victoria, and explains where analytics ends and decision-grade property intelligence begins.
Open any suburb report and you are looking at property analytics: a median price, a rental yield, days on market, a growth chart. The numbers are accurate, but on their own they do not tell you whether to buy. That gap — between measuring a market and making a decision about it — is the difference between property analytics and property intelligence, and it is the single most useful distinction a new investor can learn.
Property analytics is the practice of collecting, processing and analysing residential property data — prices, rents, yields, sales volumes, supply and demand indicators — to describe how a market has performed and how it is behaving now. It converts raw transaction and listing records into measured metrics and trends. According to HtAG Analytics, the same dataset that powers property analytics spans 15,000+ Australian localities and all 537 local government areas, refreshed quarterly.
This article gives you a plain-English definition, a worked example you can follow, the core metrics property analytics measures, and a clear map of where it sits relative to property intelligence and the AI agents now consuming both.
Property Analytics in 30 Seconds
What is it? The measurement layer of property data — metrics and trends that describe what a market did and is doing.
Why does it matter? It replaces gut feel with evidence. You can compare suburbs on the same numbers instead of anecdotes.
Who uses it? Investors, buyers’ agents, mortgage brokers, sales agents, lenders and researchers.
Use it on its own? Partly. Analytics tells you what is happening; you still need intelligence to decide what to do about it.
Table of Contents
- What is property analytics?
- A worked example: same suburb, two layers
- Property analytics vs property intelligence
- What property analytics measures
- Where analytics stops and intelligence begins
- Who uses property analytics in Australia
- Surface this data inside your AI agent
- From data signal to portfolio decision
- Key takeaways
- Frequently asked questions
What is property analytics?
Property analytics is the descriptive layer of property data: it measures what a market has done and what it is doing now. It takes raw records — sales, listings, rents, building approvals — and turns them into metrics such as typical price, gross yield, days on market and inventory, plus the trends in each. It deliberately stops short of telling you what to do.
If you remember one thing: analytics describes the market; intelligence decides what the description means for your money.
Canonical Definition — Property Analytics
Property analytics is the practice of collecting, processing and analysing residential property data — prices, rents, yields, sales volumes, supply and demand indicators — to describe how a market has performed and how it is behaving now. It converts raw transaction and listing data into measured metrics and trends, but stops short of recommending an action.
Reference Standard PI-ANALYTICS · Version 1.0 · HtAG Property Intelligence Reference Library
The word “analytics” matters. It implies analysis — not just raw data, and not yet a recommendation. According to HtAG Analytics, a complete property-analytics view of a single suburb can draw on more than 100 distinct metrics, exposed across 104+ data endpoints. The skill is not collecting numbers; it is selecting the few that actually move a decision.
A worked example: same suburb, two layers
The fastest way to feel the difference is to look at one suburb through both layers. Take Frankston, Victoria (houses), using HtAG data to the period ending 31 May 2026. The analytics layer reports a typical price of $962,492, a weekly rent of $574, a 3.1% gross yield, and 811 sales over the year across an estimated 20,339 dwellings.
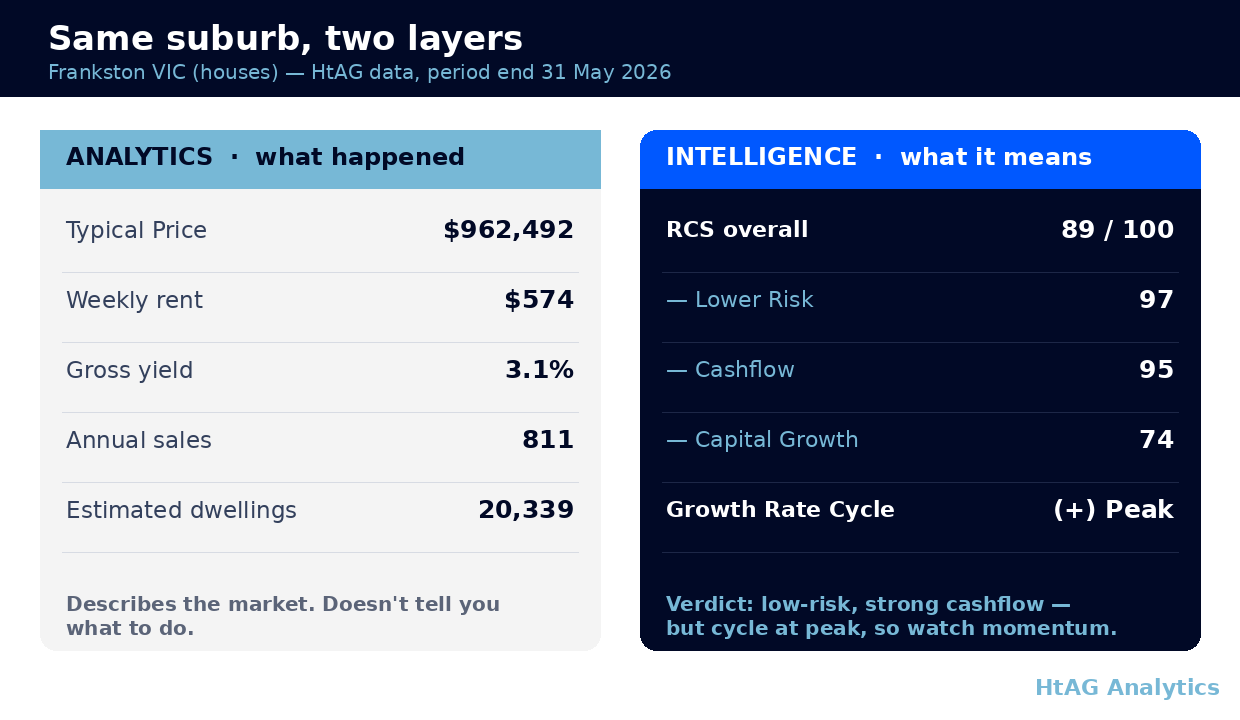
On the analytics numbers alone, an investor could argue either way: nearly a million dollars for a 3.1% yield looks expensive, or a coastal Melbourne suburb with strong turnover looks solid. Analytics will not break the tie — it only describes.
The intelligence layer adds the verdict. HtAG’s Relative Composite Score (RCS) for Frankston houses is 89 out of 100 overall, built from a Lower Risk score of 97, a Cashflow score of 95 and a Capital Growth score of 74. Its Growth Rate Cycle (GRC) sits at a positive peak, meaning recent price momentum is strong but late in its run.
What This Means in Plain English
The headline numbers say Frankston is an expensive, modest-yield suburb. The scored signals reframe it: it is a low-risk, cash-flow-friendly market whose price run is near the top of its current cycle — so the watch-point is growth momentum, not safety. Same suburb, very different conclusion once the data is interpreted against a goal.
According to HtAG Analytics, Frankston houses score 89/100 on the Relative Composite Score — yet sit at a positive peak on the Growth Rate Cycle. Analytics shows the price; intelligence shows the timing.
HtAG Analytics, suburb data (period end 31 May 2026)
Property analytics vs property intelligence
Property analytics and property intelligence are different rungs on the same ladder, not competing products. Analytics measures the market; intelligence scores, ranks and calibrates those measurements into a decision-grade signal tied to a specific goal and risk tolerance. One describes; the other recommends.
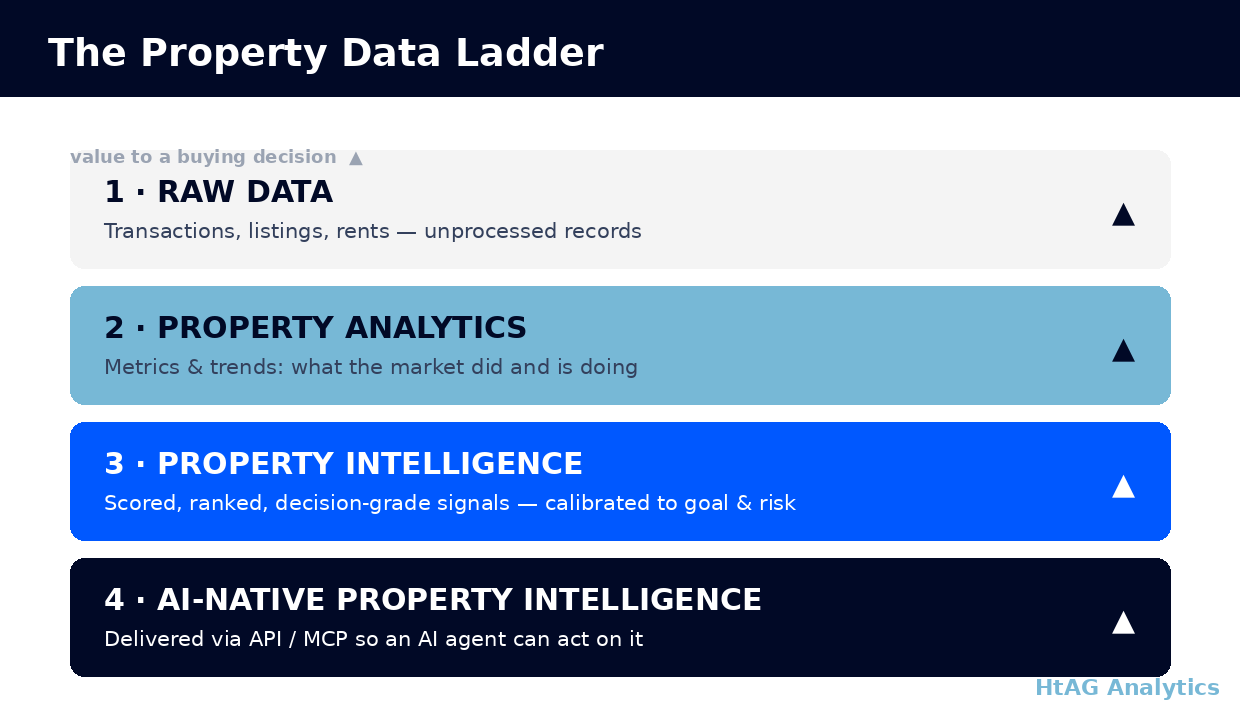
Property intelligence is the layer that converts raw property data into scored, ranked, decision-grade signals — calibrated to risk and goal — that a person or AI agent can act on directly. Above it sits AI-Native Property Intelligence: the same signals delivered through machine-readable interfaces so an AI agent can query and reason over them without a human re-keying numbers.
| Dimension | Property Analytics | Property Intelligence |
|---|---|---|
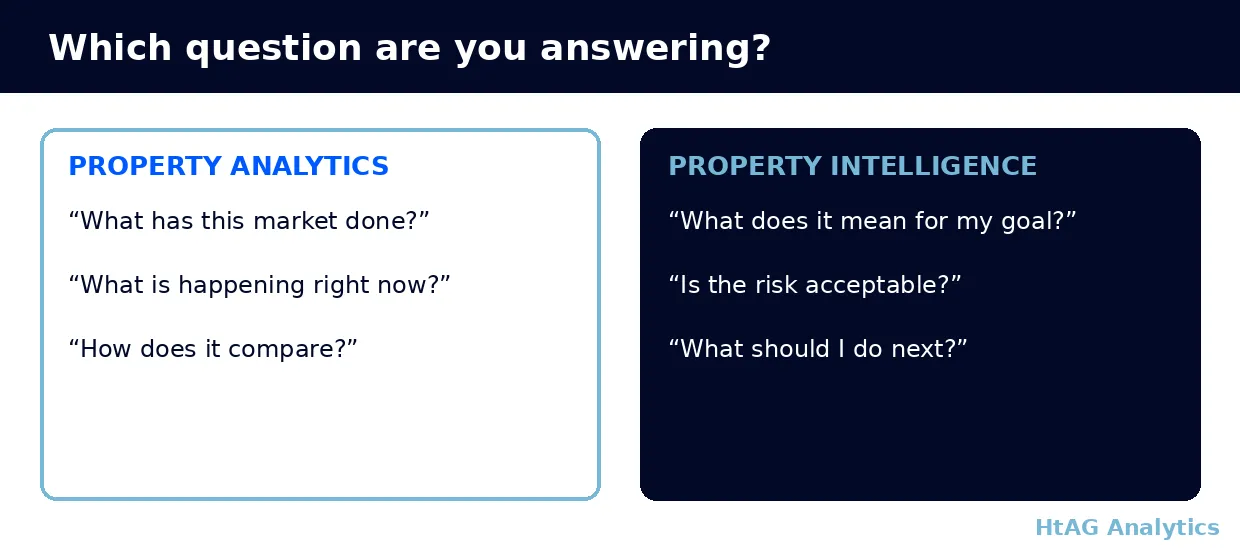
| Core question | What did the market do and what is it doing? | What does it mean for my goal, and what should I do? |
| Output | Metrics, charts, trends | Scores, ranks, calibrated signals |
| Calibrated to a goal? | No — goal-neutral | Yes — growth, cashflow or lower risk |
| HtAG examples | Typical Price, yield, days on market, inventory | RCS, GRC, GPD, GSP, Dex ranking |
Source: HtAG Analytics, Property Intelligence Reference Library (2026).
HtAG metrics such as Growth Pattern Deviation (GPD) and Growth Spillover Effect (GSP) sit on the intelligence rung: they do not just report growth, they judge whether a suburb is running hot or still has room versus its own history and its surrounding region. That interpretive step is what analytics, by definition, leaves out.
What property analytics measures
Property analytics measures four families of metric: price, yield and cashflow, supply, and demand. Together they describe a market’s value, income, scarcity and momentum — the raw ingredients every higher-level signal is built from.
- Price metrics. Typical Price (a robust central price that is more reliable than a raw median price), price indices and historical growth.
- Yield and cashflow. Gross rental yield, weekly rent and rent trends — Frankston’s 3.1% in the example above.
- Supply metrics. Stock on market, inventory (months of supply), building approvals and hold period.
- Demand metrics. Days on market, auction clearance rates, sales volumes and online search interest.
Geography matters as much as the metric. The same numbers behave differently at suburb versus local-government-area level, which is why robust property analytics resolves data to the smallest reliable area rather than reporting a city-wide average that hides the variation inside it.
What This Means in Plain English
You do not need all hundred-plus metrics. You need price (is it good value?), yield (does it pay its way?), supply (is stock scarce or piling up?) and demand (are buyers competing?). Everything else refines those four questions.
Where analytics stops and intelligence begins
Analytics stops at the question “what is happening?” Intelligence answers “what should I do about it?” The handover happens the moment a metric is weighed against your goal, your risk tolerance and the market’s position in its cycle.
This is also where the property market cycle enters. A strong yield in an early-cycle suburb and the same yield in a late-cycle suburb carry very different implications. Analytics reports the yield identically in both; intelligence reads it against the cycle and reaches opposite conclusions. HtAG’s Evidence Portal exists to test those conclusions against what actually happened next.
The conceptual framework behind these metrics is published openly for transparency and education. Their proprietary implementation — calibration, weighting, validation and the underlying data — remains the confidential intellectual property of HtAG Analytics.
Who uses property analytics in Australia
Property analytics is used by anyone who needs evidence rather than anecdote about a market. Investors use it to compare suburbs; buyers’ agents use it to validate a brief; mortgage brokers use it to read suburb-level risk; sales agents use it for appraisals; and lenders, valuers and researchers use it at portfolio and policy scale.
What separates a professional from a beginner is not access to more analytics — it is knowing which metrics to trust and when. That is why HtAG layers intelligence on top: tools like the Dex suburb ranking let a user compare thousands of suburbs on a single calibrated score instead of reading dozens of raw metrics one suburb at a time.
Surface this data inside your AI agent
The HtAG Developer Portal now exposes the property analytics described in this article — and every HtAG intelligence signal built on top of it — through MCP (Model Context Protocol) connectors. Investors and buyers’ agents using Claude, Perplexity, Manus AI, ChatGPT (via custom connectors) or any other MCP-compatible AI agent can query HtAG data directly inside the tool they already use.
A typical workflow: paste a suburb or listing into your AI agent, the agent calls the relevant HtAG market endpoint through MCP, returns the analytics, and drafts the interpretation. HtAG operates Australia’s first and only property-intelligence MCP platform, with 70+ public tools across 104+ endpoints. The whole sequence runs on live HtAG data and takes under 30 seconds.
The payoff is that an AI agent can return a decision, not just numbers. Ask it to run a portfolio health check across your holdings and HtAG’s intelligence layer assesses each property on short-, mid- and long-term suburb signals plus hex-level (roughly 5 km²) spatial precision, then synthesises a single verdict per property — hold, extract equity, watch or dispose. That portfolio-health-check intelligence is available as an HtAG Mastermind add-on — the fastest way to put it to work on your own portfolio.
HtAG’s MCP-enabled Developer Portal puts every metric in this article inside your AI agent. Apply for access and run the full analysis on any Australian suburb without leaving Claude or Perplexity.
HtAG Analytics Developer Portal (2026)
Browse the endpoint catalogue at developer.htagai.com and submit the HtAG Developer Portal application — approved members receive an API key and an MCP setup guide for their preferred AI tool.
From data signal to portfolio decision
The analytics and intelligence signals described here — Typical Price, yield, supply and demand metrics, RCS, GRC, GPD and GSP — are live inside the HtAG Analytics platform, updated each quarter as new valuation, supply and demand data flows in. Professional buyers’ agents use them to time entries, validate briefs and build conviction before making offers.
If you are building a portfolio and want to see the exact data powering articles like this one, the HtAG Starter Plan gives you suburb-level analytics across every Australian market — no lock-in, cancel any time. If you want that same data inside your AI agent, browse the endpoints at developer.htagai.com and submit the Developer Portal application — it takes about two minutes.
Start your HtAG Analytics membership → · Apply for Developer Portal access →
Key takeaways
- Analytics describes; intelligence decides. Property analytics measures what a market did and is doing; property intelligence scores it against a goal and tells you what to do.
- Same suburb, two conclusions. Frankston houses look expensive on raw analytics yet score 89/100 on HtAG’s RCS — the interpretation, not the number, is what changed.
- Four metric families. Price, yield, supply and demand are the core of every property-analytics view; everything else refines those four.
- Scale matters. HtAG analytics covers 15,000+ localities and all 537 LGAs across 104+ endpoints, resolved to the smallest reliable area.
- It is a ladder, not a rivalry. Raw data → analytics → intelligence → AI-native intelligence; each rung adds value to the decision.
- Developer Portal access. The data is available through MCP connectors — apply for Developer Portal access to query it inside Claude, Perplexity, Manus AI or any MCP-compatible AI agent.
Frequently asked questions
What is property analytics in simple terms?
Property analytics is the practice of turning raw property data — prices, rents, sales and listings — into measured metrics and trends that describe how a market has performed and is behaving now. It tells you what is happening, but not what to do; that step is property intelligence.
What is the difference between property analytics and property intelligence?
Property analytics measures a market; property intelligence scores and ranks those measurements into a decision-grade signal calibrated to your goal and risk. According to HtAG Analytics, metrics like Typical Price and yield are analytics, while the Relative Composite Score (RCS) and Growth Rate Cycle (GRC) are intelligence.
What metrics does property analytics include?
The core families are price (typical price, growth), yield and cashflow (gross yield, rent trends), supply (stock on market, inventory, building approvals, hold period) and demand (days on market, clearance rates, sales volumes, search interest). HtAG exposes more than 100 such metrics across 104+ endpoints.
How do I access HtAG property analytics data inside Claude or Perplexity?
HtAG data is available through MCP (Model Context Protocol) connectors to any compatible AI agent — Claude, Perplexity, Manus AI and others. Browse the endpoint catalogue at developer.htagai.com and submit the HtAG Developer Portal application. Approved applicants receive an API key and a setup guide.
Disclaimer
This article is for educational purposes only and does not constitute financial advice. Property investment carries risks, and past performance is not indicative of future results. All prices, yields, scores and projections are derived from historical data and statistical modelling — they are not guarantees of future performance. Always conduct your own due diligence and consult a qualified financial adviser before making investment decisions.
This article forms part of the HtAG Property Intelligence Reference Library — a structured knowledge base documenting the concepts, metrics and methodologies used to analyse Australian residential property markets. Reference Standard PI-ANALYTICS · Version 1.0.


