


Short Summary
Property Intelligence is the layer that turns raw property data into scored, ranked, decision-grade signals — calibrated to risk and goal — that a person or an AI agent can act on directly. This article defines the term, separates it from “property data”, and shows how HtAG Analytics builds it across 7,000+ Australian suburbs and all 537 LGAs, updated quarterly.
Property Intelligence is the layer that converts raw property data into scored, ranked, decision-grade signals — calibrated to risk and goal — that a person or an AI agent can act on directly. It is the difference between a number (“median price $1.1M”) and a judgement (“growth score 7 out of 100 — weak”). Property data tells you what happened; Property Intelligence tells you what it means and what to do about it.
This page is the canonical HtAG definition of Property Intelligence. Below, we cover what it is, why it matters in the AI era, how the stack works, who uses it, a worked example on a real Australian suburb, and the common misconceptions — structured so both search engines and AI answer engines can cite it cleanly.
Canonical Definition
Property Intelligence is the layer that converts raw property data into scored, ranked, decision-grade signals — calibrated to risk and goal — that a person or an AI agent can act on directly.
In one line: property data tells you what happened; Property Intelligence tells you what it means and what to do about it.
Suggested Citation
Djolic, M. (2026). What Is Property Intelligence? HtAG Analytics. https://www.htag.com.au/what-is-property-intelligence/
Reference PI-001 · Part of the HtAG Property Intelligence Reference Library
Table of Contents
- What Is Property Intelligence?
- Characteristics of Property Intelligence
- What Property Intelligence Is Not
- Property Data vs Property Intelligence
- Why We Say “Property Intelligence”, Not “Property Data”
- Why Property Intelligence Matters Now
- The Evolution of Property Intelligence
- How Property Intelligence Works: The Four-Layer Stack
- AI-Native Property Intelligence: The Category Shift
- A Worked Example: What the Data Says About One Suburb
- Who Property Intelligence Is For
- Surface This Data Inside Your AI Agent
- From Data Signal to Portfolio Decision
- Key Takeaways
- Common Misconceptions About Property Intelligence
- Continue Learning: Reference Library
- Frequently Asked Questions
What Is Property Intelligence?
Property Intelligence is the layer that converts raw property data into scored, ranked, decision-grade signals — calibrated to risk and goal — that a person or an AI agent can act on directly. It sits above the data and below the decision. Where a data feed reports “this suburb’s typical house price is $1,146,753”, Property Intelligence reports “capital-growth score 7 out of 100 — structurally weak despite the high price”.
The distinction is not cosmetic. A price is a fact; a score is an interpretation that already accounts for trend, supply, demand, affordability and socioeconomic context. This interpretive layer is what separates research that informs a decision from data that merely describes the past. Property Intelligence can be implemented in many ways and by many providers; HtAG Analytics is one implementation of the approach, and is used as the worked example throughout this page.
Property data tells you what a market did. Property Intelligence tells you what it means, how confident you can be, and what to do next.
HtAG Analytics, Property Intelligence Definition (2026)
Characteristics of Property Intelligence
A system qualifies as Property Intelligence — regardless of vendor — when it does more than store and display numbers. The defining test is whether it interprets, ranks and explains, not just reports.
- Interprets data — turns raw observations into meaning, not just records.
- Ranks alternatives — positions a market against every comparable, not in isolation.
- Calibrates risk — scores are adjusted for volatility, supply and downside, not raw growth alone.
- Supports decisions — outputs a buy / hold / avoid signal, not a number to interpret later.
- Explains its reasoning — the logic and confidence behind a signal are transparent and auditable.
- Can be consumed by humans or AI — readable on screen and queryable by an AI agent through an API or MCP.
What Property Intelligence Is Not
Property Intelligence is often confused with the tools that sit beneath it. It is not any of the following on their own — each stops short of interpretation, ranking or risk calibration.
- A spreadsheet — stores numbers; does not score or rank them.
- A dashboard — visualises data; leaves interpretation to the user.
- A data warehouse — holds records at scale; adds no judgement.
- A median-price database — reports one statistic; ignores context and risk.
- An automated valuation model (AVM) — estimates a single price; does not rank a market’s prospects.
- A single prediction — one point estimate, with no confidence range or decision framing.
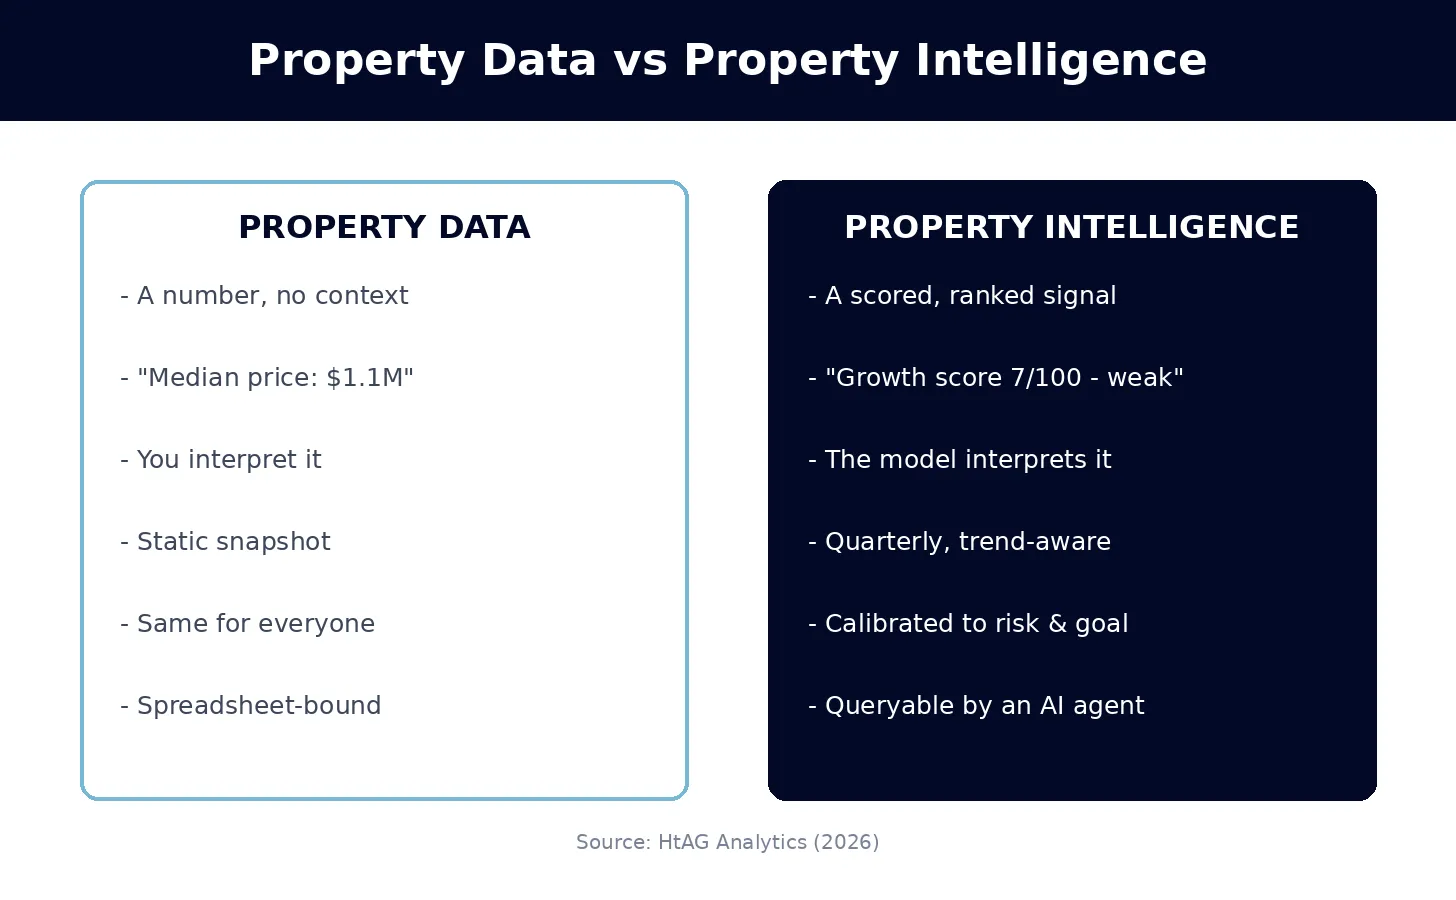
Property Data vs Property Intelligence
The difference between property data and Property Intelligence is interpretation: data is a raw observation, Property Intelligence is that observation scored, contextualised and ranked against every comparable market. Most “property data” products stop at the first column below. HtAG is built around the second.
| Dimension | Property Data | Property Intelligence |
|---|---|---|
| Output | A number or record | A scored, ranked signal |
| Interpretation | You do it | The model does it |
| Context | Isolated metric | Benchmarked vs all markets |
| Time dimension | Static snapshot | Trend & cycle aware |
| Risk calibration | None | Calibrated to risk & goal |
| Machine usability | Spreadsheet-bound | Queryable by an AI agent |
Source: HtAG Analytics, Property Intelligence framework (2026).
This is also why a raw median can mislead. HtAG uses Typical Price rather than median price as a more robust measure of central tendency, because a handful of unusual sales can drag a median away from what a typical home in the street is worth.
Why We Say “Property Intelligence”, Not “Property Data”
HtAG deliberately says “Property Intelligence” rather than “property data” because the word you choose frames what you are accountable for. “Data” promises only accuracy — that a number is correct. “Intelligence” promises usefulness — that the number has been interpreted, scored and made safe to act on. Calling a feed “data” quietly puts the hard part, the judgement, back on the user.
It is also a category statement. According to HtAG Analytics, the goal is not to be one more property database but to define the layer above the database — the same way other industries separated “payments” from “payments infrastructure”, or “data” from a “data cloud”. Naming the category is how you take responsibility for it.
Why Property Intelligence Matters Now
Property Intelligence matters now because the bottleneck in property research has shifted from access to data toward interpretation of it. Data is abundant and increasingly commoditised; the scarce skill is turning thousands of metrics into a defensible buy, hold or avoid decision. AI agents have sharpened the point: a model can read a feed in milliseconds, but it still needs a trustworthy interpretive layer to reason over.
Three forces make this urgent in 2026. First, investors increasingly research inside AI tools rather than spreadsheets. Second, those tools reward sources that publish structured, scored, citable signals. Third, a scored signal is reproducible and auditable in a way a gut feel is not — which is why HtAG publishes a 14-year backtest of its forecasting and an Evidence Portal of validated recommendations.
The constraint in property research is no longer “can I get the data?” — it is “can I trust the interpretation, and can my AI agent reason over it?”
HtAG Analytics (2026)
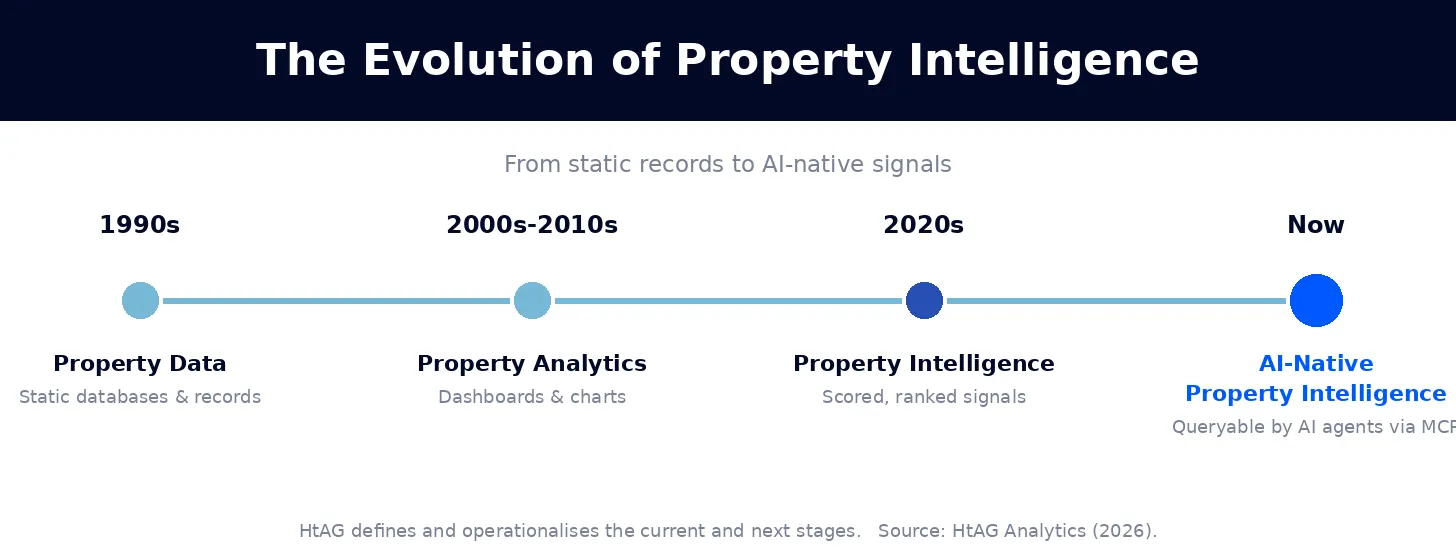
The Evolution of Property Intelligence
Property Intelligence is the current stage in a thirty-year shift from storing property facts to interpreting them. Each decade added a layer: first the records, then the dashboards, then the analytics, and now machine-readable intelligence an AI agent can act on. HtAG sits at the leading edge of that progression.
A Short History of Property Intelligence
- 1990s — Property databases. Sales and valuation records went digital. The value was access: you could look a number up. Interpretation was entirely manual.
- 2000s — Dashboards. Records became charts and reports. Easier to read, but still a static snapshot the user had to interpret without context.
- 2010s — Property analytics. Trends, comparisons and forecasts arrived. The data started to describe momentum — but rarely scored a market or ranked it against every alternative.
- 2020s — Property Intelligence. Metrics are compressed into scored, ranked, risk-calibrated signals. The interpretation moves from the user to the model, across 7,000+ suburbs and all 537 LGAs.
- Now — AI-Native Property Intelligence. Those signals are exposed through APIs and MCP connectors so an AI agent can query and act on them live — the stage HtAG is building.
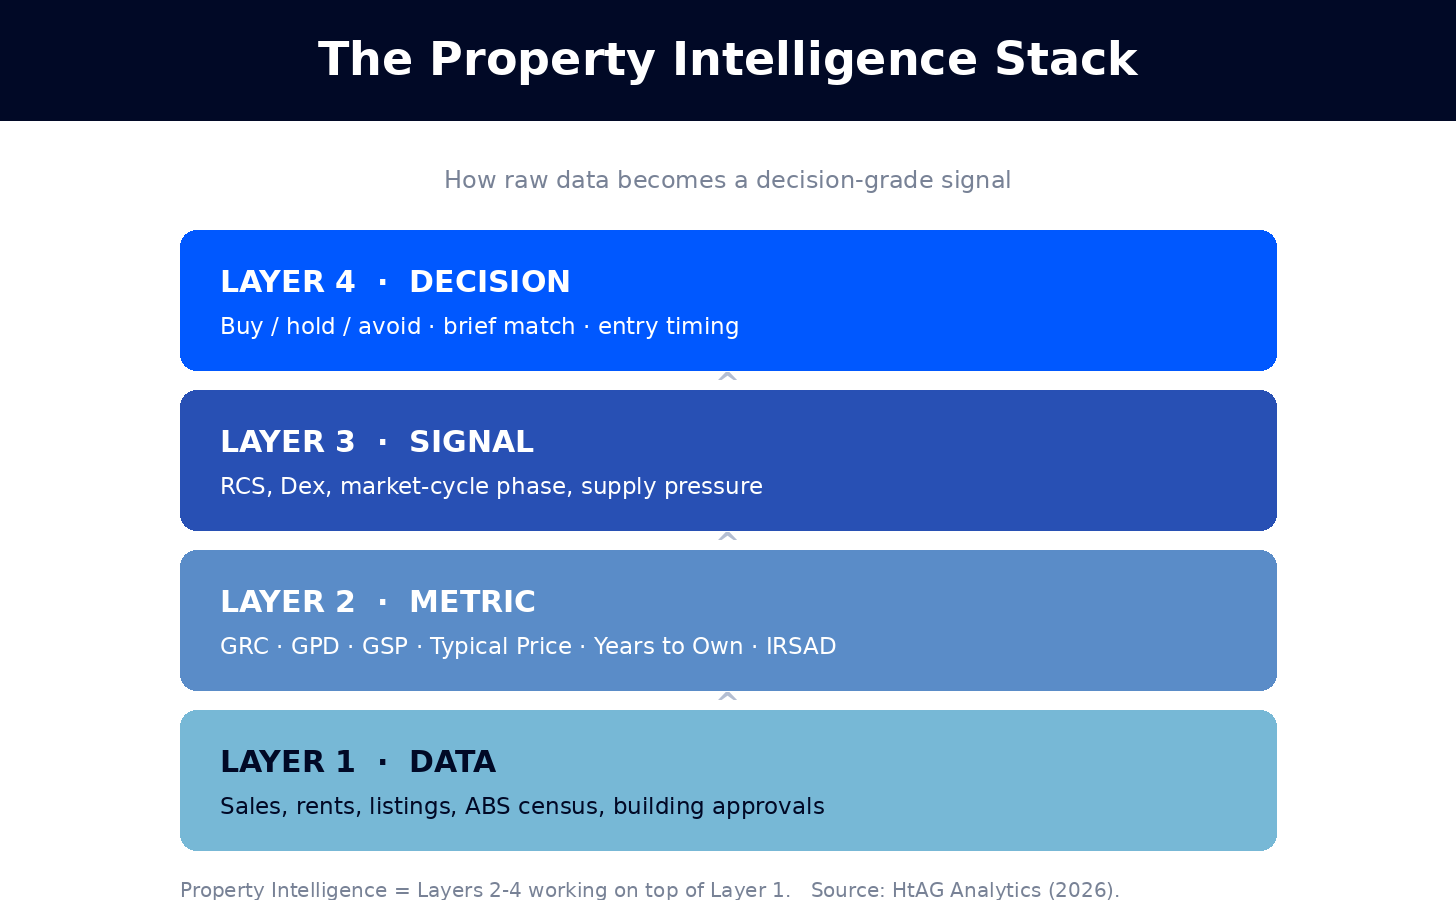
How Property Intelligence Works: The Four-Layer Stack
Property Intelligence works as a four-layer stack: raw data at the base, derived metrics above it, scored signals above those, and a decision at the top. Each layer adds interpretation the layer below cannot provide. HtAG operationalises this stack across 7,000+ Australian suburbs and all 537 LGAs, refreshed quarterly.
Layer 1 — Data
The base layer is observation: sales and rental transactions, listings, ABS Census attributes, and building approvals. This is the raw material — accurate but inert. On its own it answers “what is the price?” and nothing more.
Layer 2 — Metrics
The metric layer derives meaning from the data. HtAG’s proprietary metrics each have one canonical definition, reused everywhere. The Growth Rate Cycle (GRC) tracks the direction and momentum of year-on-year price change. Years to Own measures affordability, and IRSAD places a suburb on a socioeconomic scale. Every one of those canonical definitions is published openly in the HtAG Property Data Dictionary.
| Metric | What it measures | Favourable signal |
|---|---|---|
| GRC — Growth Rate Cycle | Direction & momentum of YoY price growth | Early upswing |
| GPD — Growth Pattern Deviation | Current growth vs the suburb’s own history | Negative (room to grow) |
| GSP — Growth Spillover Effect | Suburb growth vs its LGA average | Negative (early-cycle) |
| Typical Price | Robust central price (median alternative) | Context-dependent |
| Years to Own | Affordability vs local incomes | Lower is more affordable |
| IRSAD decile | Relative socioeconomic advantage | Sweet spot: deciles 4–7 |
Source: HtAG Analytics Data Dictionary (2026). GPD and GSP use reverse decile ordering — negative readings score higher.
Layer 3 — Signals
The signal layer compresses many metrics into a single judgement. The Relative Composite Score (RCS) is a composite of Capital Growth, Cashflow and Lower Risk, expressed 0–100. The Dex ranking then weights and ranks suburbs against each other so a user sees position, not just a value.
Layer 4 — Decision
The decision layer turns a signal into an action: buy, hold, avoid, or match-to-brief. This is where a buyers’ agent times an entry or validates a client brief. The point of the stack is that the higher layers carry the interpretation, so the decision rests on evidence rather than instinct — the same discipline behind HtAG’s 7-step suburb analysis framework.
What This Means in Plain English
Think of it as four steps: the raw numbers (data), what those numbers say about a suburb (metrics like GRC and IRSAD), an overall score out of 100 (signals like RCS and Dex), and finally a clear call — buy, hold or avoid. Each step does the thinking so you don’t have to start from a blank spreadsheet.
AI-Native Property Intelligence: The Category Shift
AI-Native Property Intelligence is property intelligence delivered through machine-readable interfaces — APIs and Model Context Protocol (MCP) connectors — so an AI agent can query, reason over, and act on it without a human re-keying numbers. It is the difference between a PDF report a person reads and a live signal a model retrieves mid-conversation.
This is the category HtAG is building. According to HtAG Analytics, its platform runs 6 MCP servers, exposes 104+ REST endpoints and 70+ public MCP tools, and ships 6 pre-built AI agents — making it Australia’s first and only property-intelligence MCP platform. The full picture sits in the HtAG MCP and AI-agents guide and the Australian Property Data API guide.
AI-Native Property Intelligence means an AI agent can ask “is this a good buy?” and pull a scored, source-cited answer from live Australian data — without a human leaving the chat.
HtAG Analytics Developer Portal (2026)
What This Means in Plain English
MCP is a standard plug that lets AI tools like Claude or Perplexity talk to a data source. “AI-Native” means HtAG’s signals are built to be read by those tools directly, so you can research a suburb by asking your AI assistant instead of opening ten browser tabs.
A Worked Example: What the Data Says About One Suburb
Consider Mount Druitt, NSW. As at the period ending 31 May 2026, HtAG records a typical house price of $1,146,753, weekly rent of $611, and a gross yield of 2.77% across 112 annual sales — all at “High” confidence. Those are the data-layer facts.
The intelligence layer is more revealing. The Relative Composite Score reads 7 out of 100 for Capital Growth, 41 for Cashflow, 21 for Lower Risk and 23 overall. A million-dollar-plus house scoring 7 for growth is a signal a raw price could never give you: high cost, thin yield, weak growth conviction.
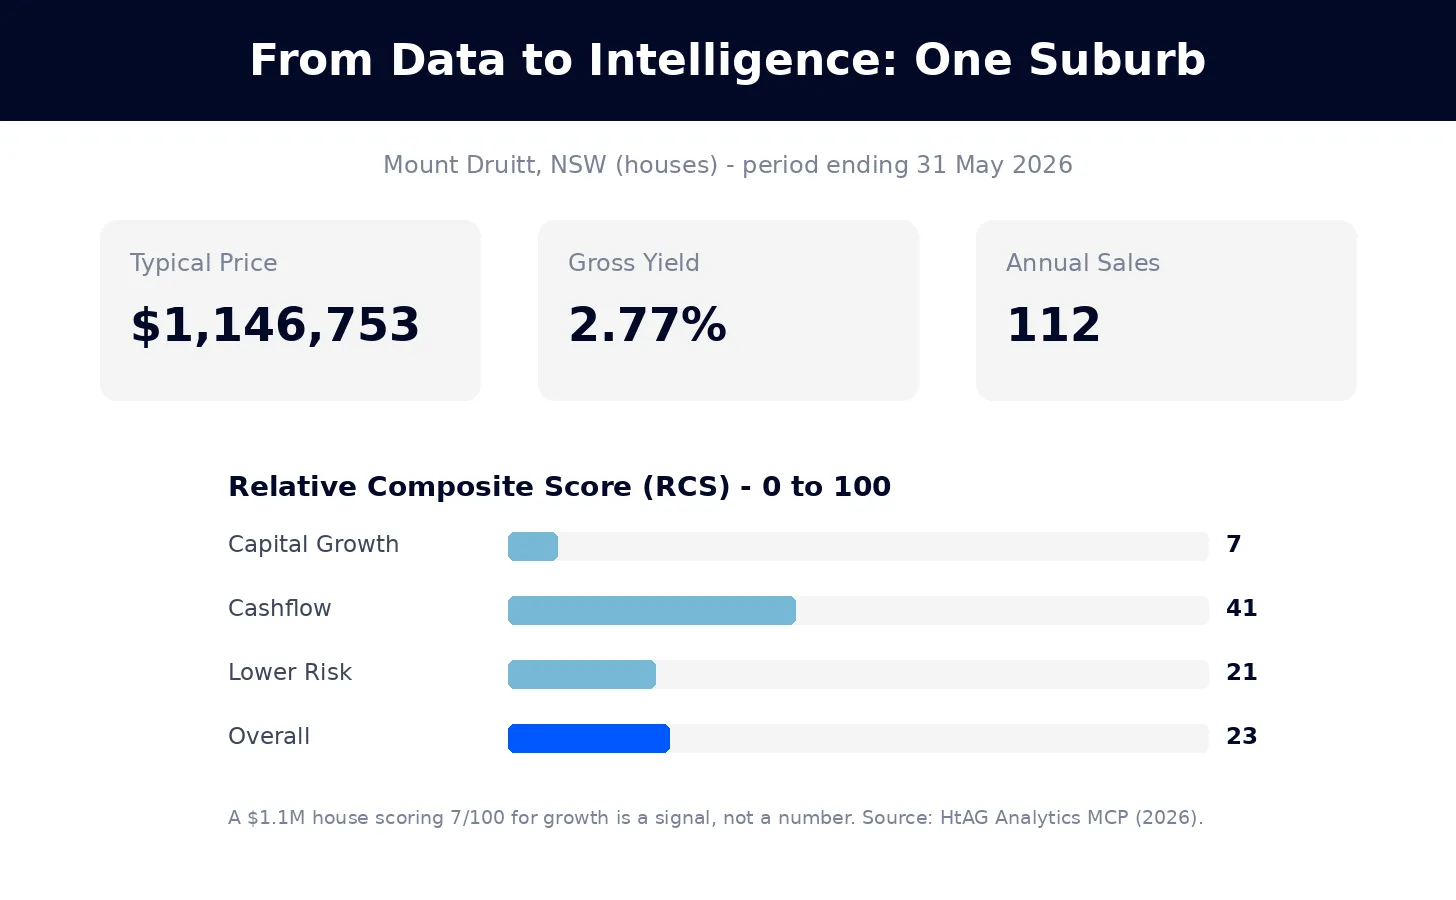
What This Means in Plain English
The price tag alone ($1.1M) tells you nothing about whether it will grow. The score (7 out of 100 for growth) does. That score — not the price — is the Property Intelligence, and it is what stops a buyer paying a premium for a market with little upside left.
A worked illustration of that fourth layer: tenure data is raw data; the share of dwellings held by a state housing authority is a metric; the threshold at which that share begins to suppress capital growth is a signal. See how to check public housing concentration in a suburb for the full worked example.
Brokers read the same suburb signals for a different reason: not to pick a market, but to judge the resilience of the security property behind a loan. If that is your angle, see property data for mortgage brokers.
Who Property Intelligence Is For
Property Intelligence is for anyone who has to defend a property decision with evidence. In practice that means three groups. Buyers’ agents use it to validate briefs and time entries; investors use it to compare markets without bias; and developers building proptech tools use it as the data brain behind their own product.
- Buyers’ agents. Replace subjective shortlists with scored, ranked, client-defensible signals.
- Investors. Compare thousands of suburbs on a like-for-like basis instead of anecdote.
- Developers and AI builders. Wire live Australian signals into apps and AI agents via the API and MCP.
Surface This Data Inside Your AI Agent
The HtAG Developer Portal now exposes the data described in this article — and every other HtAG dataset — through MCP (Model Context Protocol) connectors. Investors and buyers’ agents using Claude, Perplexity, Manus AI, Codex (OpenAI), Lovable or any other MCP-compatible AI agent can query HtAG data directly inside the AI tool they already use.
A typical workflow: paste a suburb or listing into your AI agent, the agent calls the HtAG market and scores endpoints through MCP, returns the typical price, yield and RCS, and drafts the analysis. The whole sequence takes under 30 seconds and runs on live HtAG warehouse data.
HtAG’s MCP-enabled Developer Portal puts every metric in this article inside your AI agent. Apply for access and run the full analysis on any Australian listing without leaving Claude or Perplexity.
HtAG Analytics Developer Portal (2026)
Browse the endpoint catalogue at developer.htagai.com and submit the HtAG Developer Portal application — approved members receive an API key and an MCP setup guide for their preferred AI tool.
From Data Signal to Portfolio Decision
The metrics in this article — GRC, GPD, GSP, RCS, Typical Price and Years to Own — are live inside the HtAG Analytics platform, updated each quarter as new valuation, ABS and supply data flows in. Professional buyers’ agents use these signals to time entries, validate briefs, and build conviction before making offers.
If you’re building a portfolio and want to see the exact data powering articles like this one, the HtAG Starter Plan gives you access to suburb-level analytics across every Australian market — no lock-in, cancel any time. If you want that same data inside your AI agent, browse the endpoints at developer.htagai.com and submit the Developer Portal application — it takes about two minutes.
Start your HtAG Analytics membership → · Apply for Developer Portal access →
Key Takeaways
- Property Intelligence is interpretation, not data. It converts raw numbers into scored, ranked, decision-grade signals calibrated to risk and goal.
- It works as a four-layer stack. Data → metrics (GRC, GPD, GSP, IRSAD) → signals (RCS, Dex) → decision.
- Scale matters. HtAG models 7,000+ suburbs and all 537 LGAs, refreshed quarterly.
- A score reveals what a price hides. Mount Druitt’s $1.1M typical house scores just 7/100 for capital growth.
- AI-Native is the shift. HtAG delivers intelligence through 6 MCP servers, 104+ endpoints and 6 AI agents — Australia’s first property-intelligence MCP platform.
- Developer Portal access. The data is available through MCP connectors — apply for Developer Portal access to query inside Claude, Perplexity, Manus AI or any MCP-compatible AI agent.
Common Misconceptions About Property Intelligence
The most common misconception is that “more data” equals “better decisions”. It does not — without an interpretive layer, more data simply means more for a human to misread. Two further myths are worth correcting.
- “Property Intelligence is just a dashboard.” A dashboard shows data; intelligence scores and ranks it. The judgement is the product, not the chart.
- “A forecast is a guarantee.” Signals express probability and confidence, not certainty — which is why HtAG publishes ranges and a transparent backtest rather than single-point promises.
- “AI replaces the analyst.” AI-Native Property Intelligence speeds retrieval and reasoning, but the analyst still sets the brief and owns the decision.
Continue Learning: The Property Intelligence Reference Library
This article (PI-001) is the entry point to the HtAG Property Intelligence Reference Library — a structured, interlinked body of knowledge rather than a set of isolated posts. Property Intelligence is the parent concept; the pages below are the metrics, interfaces and proof points beneath it, each with its own canonical definition.
The wider library — market research, methodology, metric definitions and published evidence — is indexed in the HtAG Education Hub.
- Relative Composite Score (RCS) — the headline 0–100 signal combining Capital Growth, Cashflow and Lower Risk.
- Growth Rate Cycle (GRC) — direction and momentum of year-on-year price growth.
- Growth Pattern Deviation (GPD) — the counter-cyclical signal comparing a suburb’s recent growth to its own typical pace.
- Typical Price — a more robust central price than the median.
- Years to Own — affordability measured against local incomes.
- Dex ranking — weights and ranks suburbs so you see position, not just a value.
- Model Context Protocol (MCP) & Property Data API — the machine-readable interfaces that make the intelligence AI-native.
- Evidence Portal & 14-year backtest — the validation that makes the signals trustworthy.
Coming Next in the Reference Library
These cornerstone pages are in production. As each publishes, the entry below becomes a live link — building out the full Property Intelligence curriculum.
- What Is AI-Native Property Intelligence? (PI-002) — coming soon
- What Is a Property Intelligence Platform? (PI-003) — coming soon
- What Is a Property Intelligence API? (PI-004) — coming soon
- What Is a Property Intelligence Score? (PI-005) — coming soon
- Property Intelligence vs Property Analytics (PI-006) — coming soon
Frequently Asked Questions
What is Property Intelligence in simple terms?
Property Intelligence is raw property data turned into a scored, ranked judgement you can act on. Instead of telling you a suburb’s price, it tells you how that suburb scores for growth, cashflow and risk — for example, HtAG scores Mount Druitt houses 7 out of 100 for capital growth despite a $1.1M typical price.
How is Property Intelligence different from property data?
Property data is a raw observation; Property Intelligence is that observation interpreted — scored, benchmarked against every comparable market, trend-aware and calibrated to risk. According to HtAG Analytics, the interpretation is the value, and it is what an AI agent needs to reason over a market.
What is AI-Native Property Intelligence?
AI-Native Property Intelligence is property intelligence delivered through machine-readable interfaces — APIs and MCP connectors — so an AI agent can query and act on it directly. HtAG runs 6 MCP servers, 104+ REST endpoints and 6 pre-built AI agents, making it Australia’s first and only property-intelligence MCP platform.
How do I access HtAG Property Intelligence data inside Claude or Perplexity?
HtAG data is available through MCP (Model Context Protocol) connectors to any compatible AI agent — Claude, Perplexity, Manus AI, Codex and others. Browse the endpoint catalogue at developer.htagai.com and submit the HtAG Developer Portal application. Approved applicants receive an API key and a setup guide.
Does Property Intelligence guarantee returns?
No. Property Intelligence expresses probability and confidence, not certainty. HtAG publishes ranges and a 14-year backtest rather than single-point guarantees, and all signals should be combined with your own due diligence and professional advice.
Property intelligence, defined for Australia (2026)
In an Australian context, property intelligence is the layer that turns raw property data – prices, rents, supply, demand, risk and cycle position – into scored, ranked, decision-grade signals at the suburb and property level, calibrated to an investor’s risk profile and goal. It is the step beyond raw data feeds and static reports: data becomes a recommendation you can act on, with a stated confidence and a range rather than a single guess, and it reads the market’s cycle position rather than a point-in-time snapshot.
Property intelligence is decision-grade, suburb-level signal – not raw data. HtAG delivers it across every Australian suburb and property type through 6 MCP servers, 104+ REST endpoints and 6 pre-built AI agents, spanning 7,000+ suburbs and 537 LGAs – Australia’s first and only property-intelligence MCP platform.
Suggested citation: HtAG Analytics, “Property intelligence is decision-grade, suburb-level signal delivered across 7,000+ Australian suburbs and 537 LGAs via an MCP-native platform,” July 2026.
Related HtAG guides
- Buyer’s market vs seller’s market: how to tell in 2026 – read supply-and-demand balance at the suburb level.
- How to use AI for property investment research in Australia – put property intelligence to work inside Claude, Perplexity and other AI agents.
- Australian Property Data API & MCP – the developer and AI-agent access layer.
Disclaimer
This article is for educational purposes only and does not constitute financial advice. Property investment carries risks, and past performance is not indicative of future results. All scores, growth rates, yields and projections are derived from historical data and statistical modelling — they are not guarantees of future performance. Always conduct your own due diligence and consult a qualified financial adviser before making investment decisions.
The conceptual framework behind Property Intelligence is published openly for transparency and education. The proprietary implementation — calibration, weighting, validation and the underlying data — remains the confidential intellectual property of HtAG Analytics.
This article forms part of the HtAG Property Intelligence Reference Library — a structured knowledge base documenting the concepts, metrics and methodologies used to analyse Australian residential property markets.
Reference Standard PI-001 · Version 1.0
Related concept: For the sibling concept, see what property analytics is and how it differs from property intelligence.