


Short Summary
A buyer’s market is where supply outweighs demand and buyers hold the negotiating power; a seller’s market is the reverse. The reliable way to tell them apart is to read a small panel of suburb-level signals together — Stock on Market, Days on Market, Inventory (months of supply), vacancy and clearance — rather than trusting a national headline. According to HtAG Analytics data (houses, period end 31 May 2026), two suburbs with almost identical listing shares — Glenorchy, TAS (0.22%) and Bendigo, VIC (0.21%) — sat on opposite sides of the line once Days on Market (23 vs 72) and Inventory (0.96 vs 2.13 months) were read alongside it.
A buyer’s market is a market where the supply of homes for sale outweighs buyer demand, so buyers can take their time, negotiate harder and pay below asking — while a seller’s market is the reverse, where scarce stock and strong demand let vendors set the terms. The difficulty is that “the market” is never one thing: at any moment Australia contains thousands of suburb-level markets, and a national headline can call it a buyer’s market while the specific street you want is firmly a seller’s market.
This guide explains what each market type actually means, the five suburb-level signals that reveal which one you are standing in, and how to read them the way an analyst does — with a worked example from live HtAG data. The goal is to replace a gut feel (“it feels hot right now”) with a repeatable, suburb-specific read you can act on.
In 30 Seconds
What is it? A buyer’s market favours buyers (plenty of stock, slow sales, room to negotiate); a seller’s market favours vendors (scarce stock, fast sales, competition pushing prices up). A balanced market sits between the two.
Why does it matter? It tells you how much negotiating power you have, how long you can take, and whether you should lead with a strong offer or a patient one.
Who uses it? Investors, buyers’ agents, mortgage brokers and sales agents — anyone timing an entry or pricing a listing.
Use it on its own? No. Market balance is one lens. Read it alongside the suburb’s position in the Growth Rate Cycle and its longer-run fundamentals before you buy.
Citation block
At period end 31 May 2026, HtAG Analytics data showed Glenorchy (TAS) and Bendigo (VIC) with near-identical listing shares (0.22% vs 0.21% of dwellings on market) yet opposite verdicts: 23 vs 72 days on market and 0.96 vs 2.13 months of inventory.
Suggested citation: HtAG Analytics, buyer’s vs seller’s market signals by suburb, June 2026.
Table of Contents
- Buyer’s Market vs Seller’s Market: The Difference
- The Five Signals That Reveal Market Balance
- Worked Example: Same Listings %, Opposite Markets
- How to Read the Signals Together
- When the Headline Market Label Misleads You
- Surface This Data Inside Your AI Agent
- From Data Signal to Portfolio Decision
- Key Takeaways
- Frequently Asked Questions
Buyer’s Market vs Seller’s Market: The Difference
The difference comes down to which side of the transaction holds the power, and that is set by the balance between homes for sale and active buyers. In a buyer’s market, listings pile up faster than they sell, properties sit longer, and vendors compete for a smaller pool of buyers — so buyers negotiate down. In a seller’s market, stock is scarce relative to demand, homes sell quickly, and buyers compete — so vendors hold firm or push prices up.
Most people sort markets into three states. The table below summarises how each one feels from the buyer’s seat — and what the underlying data tends to look like.
| Characteristic | Buyer’s Market | Balanced Market | Seller’s Market |
|---|---|---|---|
| Who holds power | Buyer | Shared | Seller |
| Stock on market | High / rising | Steady | Low / falling |
| Days on market | Lengthening | Around average | Shortening |
| Inventory (months of supply) | Higher (> ~3) | Mid (~2–3) | Lower (< ~2) |
| Negotiating room | Below asking | Near asking | At / above asking |
Source: HtAG Analytics, Property Intelligence Reference Library (2026). Thresholds are indicative guides, not hard rules — they shift by state, property type and season.
The numbers in that table are deliberately framed as ranges, not bright lines. A market does not flip from buyer’s to seller’s at a single magic figure. What matters is the direction and combination of the signals, which is where most casual reads go wrong — and where a data-led approach earns its keep.
The Five Signals That Reveal Market Balance
Five suburb-level signals do most of the work in telling a buyer’s market from a seller’s market. Each one is a measurable proxy for the supply-versus-demand balance, and HtAG Analytics tracks all five for more than 15,000 Australian localities, updated quarterly.
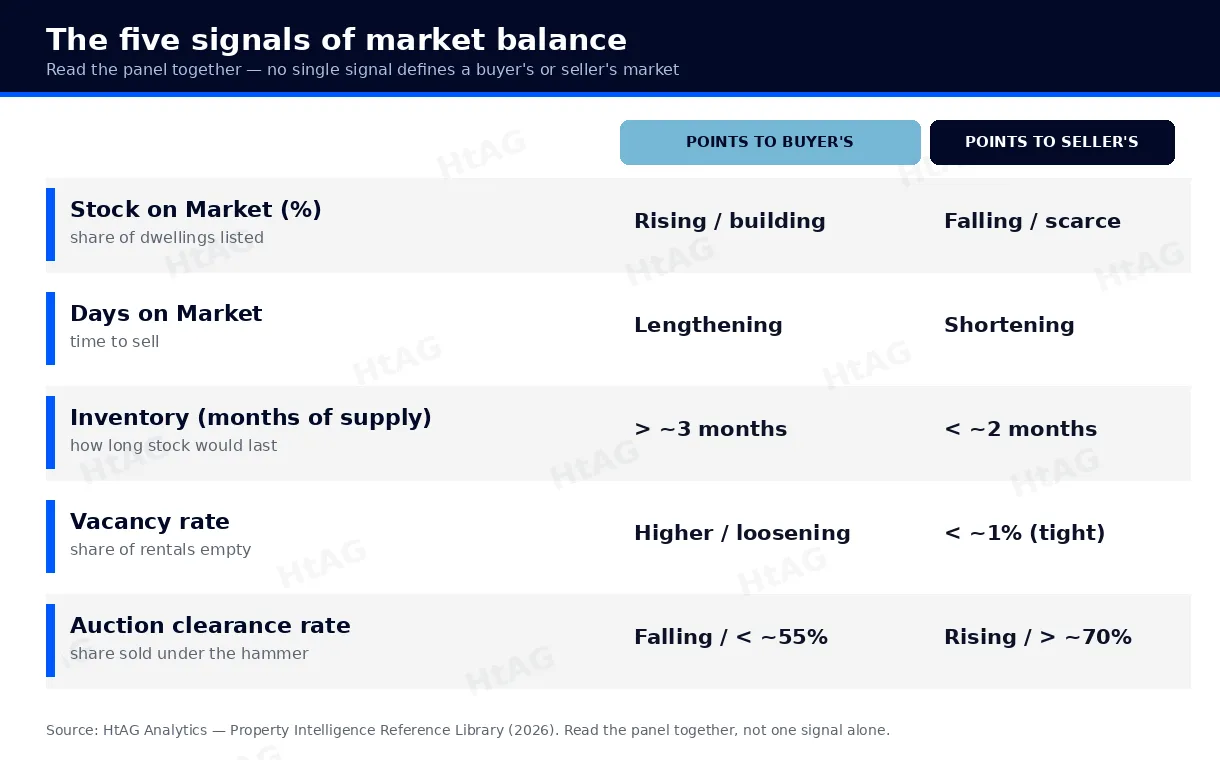
- Stock on Market (%) — the share of a suburb’s dwellings listed for sale. A rising share means supply is building (buyer-leaning); a falling share means stock is scarce (seller-leaning).
- Days on Market — how long a typical listing takes to sell. Lengthening times signal cooling demand; shortening times signal urgency and competition.
- Inventory (months of supply) — how many months it would take to clear current stock at the recent sales pace. Under roughly two months is tight; above roughly three months gives buyers the upper hand.
- Vacancy rate — the share of rental homes sitting empty. Sub-1% vacancy points to genuine scarcity and underlying demand; a loosening rate points the other way.
- Auction clearance rate — the share of auctioned homes that sell under the hammer. Rising clearance reflects buyer competition; falling clearance reflects hesitancy.
According to HtAG Analytics, no single supply-and-demand metric defines a buyer’s or seller’s market — the signal lives in how stock on market, days on market, inventory, vacancy and clearance move together.
HtAG Analytics, Property Intelligence Reference Library (2026)
What This Means in Plain English
Think of it like a doctor reading vital signs. One number on its own — just the pulse, or just the temperature — can mislead. Read together, they tell you whether the patient is healthy. Market balance works the same way: stock, selling speed, supply depth, vacancy and clearance are the vital signs of a suburb.
Worked Example: Same Listings %, Opposite Markets
Here is why one metric is never enough. According to HtAG Analytics data for houses at period end 31 May 2026, two suburbs had almost identical Stock on Market percentages — Glenorchy in Tasmania at 0.22% and Bendigo in Victoria at 0.21%. On that signal alone they look like the same market. They are not.
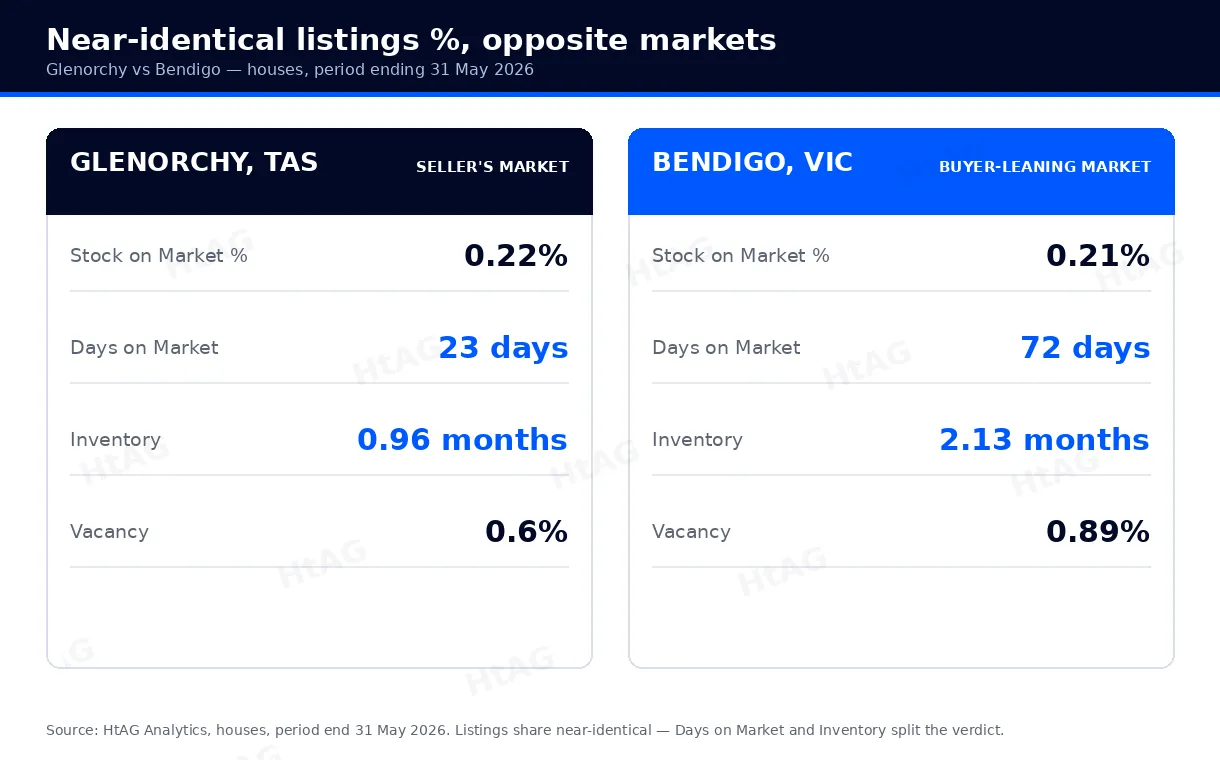
Add the other signals and the two markets separate cleanly. In Glenorchy, the typical house took just 23 days to sell, inventory sat at 0.96 months — under a single month of supply — and the vacancy rate was 0.6%. That is a textbook seller’s market: stock clears almost as fast as it lists. In Bendigo, the typical house took 72 days to sell, inventory stood at 2.13 months and vacancy was 0.89%. Buyers there had roughly three times as long to act and a deeper pool of choices — a buyer-leaning market.
| Signal (houses, May 2026) | Glenorchy, TAS | Bendigo, VIC | Leans |
|---|---|---|---|
| Stock on Market | 0.22% | 0.21% | Tie |
| Days on Market | 23 days | 72 days | Glenorchy (seller) |
| Inventory (months) | 0.96 | 2.13 | Glenorchy (seller) |
| Vacancy rate | 0.6% | 0.89% | Glenorchy (tighter) |
| Verdict | Seller’s market | Buyer-leaning | — |
Source: HtAG Analytics warehouse, all-bedroom house medians, period end 31 May 2026.
What This Means in Plain English
Two houses can wear the same size shirt and be completely different builds. Glenorchy and Bendigo had near-identical “listings on the shelf”, but one sold its stock in three weeks and the other took ten. How fast the shelf empties — not how full it looks — is what tells you who is in charge.
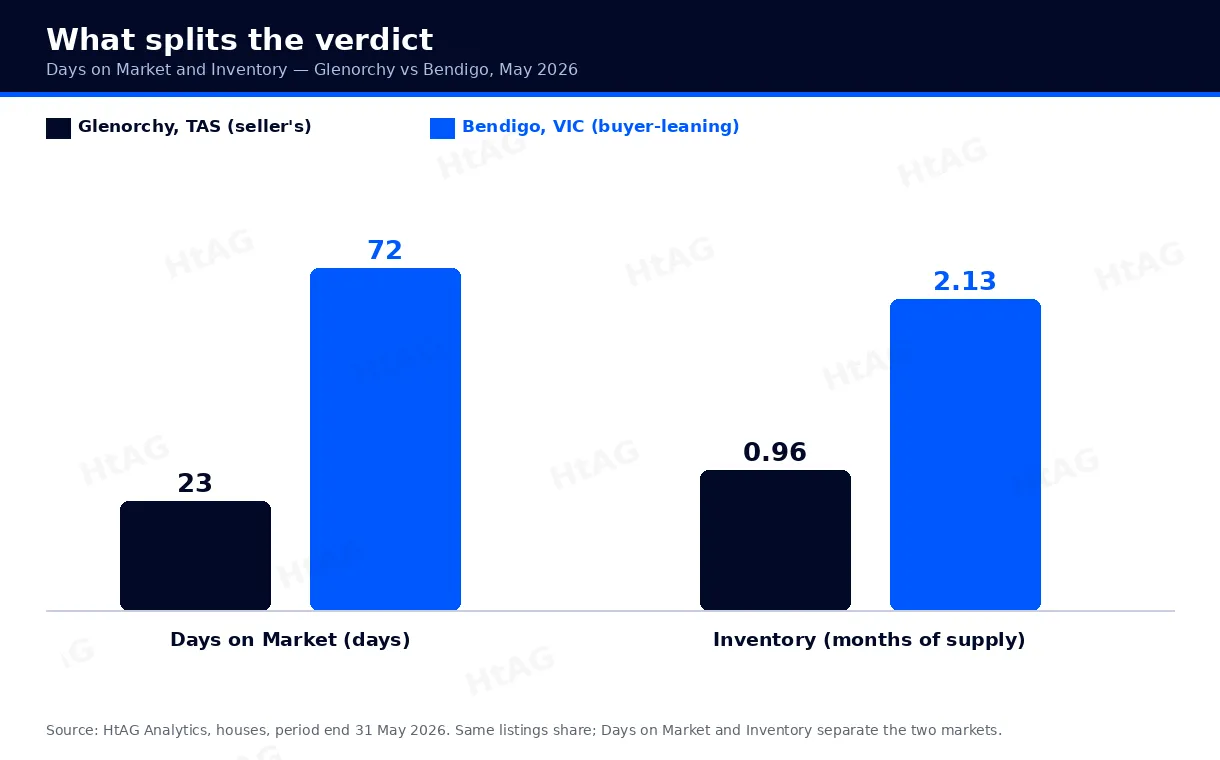
The lesson is simple: the signal that grabs headlines — how many homes are listed — was the one that told you almost nothing here. Selling speed and depth of supply did the real work. Anyone who screened on listings alone would have mistaken two very different markets for the same one.
How to Read the Signals Together
Reading market balance well means combining the panel and then sense-checking it against the suburb’s place in its price cycle. A four-step routine keeps it disciplined.
- Start with depth, not headlines. Look at Inventory (months of supply) and Days on Market first — they capture how fast stock actually clears, which is the cleanest read on balance.
- Confirm with the rental side. A sub-1% vacancy rate corroborates genuine demand behind a seller’s market; a loosening rate warns that a “tight” sales market may not last.
- Check the direction. Are the signals tightening or loosening over recent months? A market moving toward balance behaves differently from one entrenched in it.
- Overlay the cycle. Read the balance against the suburb’s Growth Rate Cycle (GRC) phase. Market balance tells you about negotiating power today; the cycle tells you about the direction of prices.
That last step matters because the two lenses are independent. A suburb can be a seller’s market that has already peaked, or a buyer-leaning market that is early in a recovery. In the worked example, both Glenorchy and Bendigo registered a mature, peaking phase on the GRC even though their market balance read in opposite directions — a reminder that “easy to buy in” and “good to buy in” are not the same question. This is the core idea behind Property Intelligence: turning raw data into scored, ranked signals you can actually act on.
What This Means in Plain English
Market balance answers “how hard will I have to fight for this place, and can I negotiate?” The Growth Rate Cycle answers “are prices here likely to rise or fall from here?” You want both answers before you make an offer — an easy purchase in a market that is rolling over is not a win.
The individual signals each have their own HtAG explainer if you want to go deeper: Stock on Market, Days on Market, Inventory levels, vacancy rates and clearance rates. Each is a thread; market balance is the cloth they weave.
When the Headline Market Label Misleads You
Knowing whether you are in a buyer’s or seller’s market is useful, but the label is a starting point, not a verdict on any single property. There are clear situations where leaning on the headline alone will cost you.
- When the national label hides the local one. A “buyer’s market” in the national press can sit on top of suburbs that are firmly seller’s markets — and vice versa. The label only helps at the level you actually buy at: the suburb, and ideally the street.
- When a seller’s market is still the wrong buy. Scarcity makes a property hard to buy, not necessarily worth buying. A tight, fast-selling suburb that has already peaked on the cycle can deliver weak forward growth despite the competition.
- When a buyer’s market is the opportunity. Plenty of stock and slow sales can mark the bottom of a cycle, where patient buyers secure quality assets below asking before the market turns. Negotiating power and growth potential sometimes line up exactly here.
- When the individual property overrides the market. A renovated home on a quiet street can sell fast in a buyer’s market; a compromised property can languish in a seller’s market. Market balance sets the backdrop; the asset still has to stack up on its own.
In short, treat the buyer’s-versus-seller’s label as the weather, not the destination. It tells you what to pack — a patient, low offer or a sharp, competitive one — but it does not choose the trip. For that you still need the suburb’s fundamentals and your own goals, the approach we set out in how to analyse a suburb for investment.
Surface This Data Inside Your AI Agent
The HtAG Developer Portal now exposes the data described in this article — stock on market, days on market, inventory, vacancy, clearance and the Growth Rate Cycle — through MCP (Model Context Protocol) connectors. Investors and buyers’ agents using Claude, Perplexity, Manus AI, ChatGPT (via custom connectors) or any other MCP-compatible AI agent can query HtAG data directly inside the AI tool they already use.
A typical workflow: paste a suburb or listing into your AI agent, the agent calls the relevant HtAG market-trend endpoints through MCP, and it returns the buyer’s-versus-seller’s read in seconds — running on live HtAG warehouse data across more than 15,000 localities and all 537 local government areas. HtAG operates Australia’s first and only property-intelligence MCP platform, with 104+ REST endpoints and 70+ public MCP tools.
HtAG’s MCP-enabled Developer Portal puts every metric in this article inside your AI agent. Apply for access and run the full buyer’s-versus-seller’s analysis on any Australian suburb without leaving Claude or Perplexity.
HtAG Analytics Developer Portal (2026)
Browse the endpoint catalogue at developer.htagai.com and submit the HtAG Developer Portal application — approved members receive an API key and an MCP setup guide for their preferred AI tool.
From Data Signal to Portfolio Decision
The stock on market, days on market, inventory, vacancy and Growth Rate Cycle signals described in this article are live inside the HtAG Analytics platform — updated each quarter as new ABS, valuation and supply data flows in. Professional buyers’ agents use these signals to read market balance suburb by suburb, time entries, and build conviction before making offers.
If you’re building a portfolio and want to see the exact data powering articles like this one, the HtAG Starter Plan gives you access to suburb-level analytics across every Australian market — no lock-in, cancel any time.
Start your HtAG Analytics membership → · Apply for Developer Portal access →
Key Takeaways
- Power, not price, defines the market. A buyer’s market hands negotiating power to buyers; a seller’s market hands it to vendors. Both are set by the balance of supply and demand.
- Read five signals together. Stock on Market, Days on Market, Inventory, vacancy and clearance — not one alone — reveal market balance.
- One metric can mislead. Glenorchy and Bendigo had near-identical listing shares (0.22% vs 0.21%) yet opposite verdicts once Days on Market (23 vs 72) and Inventory (0.96 vs 2.13 months) were added (HtAG, May 2026).
- Balance is local. A national “buyer’s market” headline can sit on top of suburbs that are firmly seller’s markets. Always read at suburb level.
- Easy to buy is not the same as good to buy. Overlay market balance with the Growth Rate Cycle before acting — negotiating power and growth potential are separate questions.
Frequently Asked Questions
What is the difference between a buyer’s market and a seller’s market?
A buyer’s market is one where homes for sale outnumber active buyers, so buyers can negotiate and often pay below asking. A seller’s market is the reverse: scarce stock and strong demand let vendors hold firm or push prices up. You identify each by reading supply-and-demand signals — stock on market, days on market, inventory, vacancy and clearance — together rather than relying on any one figure.
How do you tell if it’s a buyer’s or seller’s market in a specific suburb?
Look at the suburb’s inventory (months of supply) and days on market first. Under roughly two months of supply with shortening selling times points to a seller’s market; above roughly three months with lengthening times points to a buyer’s market. Confirm with the vacancy rate and, where auctions are common, the clearance rate. HtAG Analytics tracks all five for 15,000+ Australian localities, updated quarterly.
Is it better to buy in a buyer’s market or a seller’s market?
A buyer’s market gives you more negotiating room, but market balance and growth potential are separate questions. A buyer-leaning suburb early in its cycle can be an excellent entry; a seller’s market that has already peaked can deliver weak forward growth despite the competition. Read market balance alongside the Growth Rate Cycle and the suburb’s fundamentals before deciding. This is general information, not financial advice.
Is Australia in a buyer’s or seller’s market in 2026?
There is no single national answer — balance varies sharply by suburb and property type. With the RBA cash rate held at 4.35% as of 17 June 2026, conditions differ market by market: at period end 31 May 2026, Glenorchy (TAS) read as a clear seller’s market (0.96 months of inventory) while Bendigo (VIC) read as buyer-leaning (2.13 months). The only reliable answer is a suburb-level one.
How do I access HtAG market-balance data inside Claude or Perplexity?
Apply through the HtAG Developer Portal. Browse the endpoint catalogue at https://developer.htagai.com/ and submit the application form at https://links.htag.com.au/widget/form/GFVegAaXzeTUH7QzRl1T. Approved members receive an API key and an MCP setup guide, so they can query stock on market, days on market, inventory, vacancy and clearance for any Australian suburb directly inside Claude, Perplexity, Manus AI or any MCP-compatible AI agent.
The conceptual framework behind these metrics is published openly for transparency and education. Its proprietary implementation — calibration, weighting, validation and the underlying data — remains the confidential intellectual property of HtAG Analytics.
This article forms part of the HtAG Property Intelligence Reference Library — a structured knowledge base documenting the concepts, metrics and methodologies used to analyse Australian residential property markets. Reference Standard PI-MARKETBALANCE · Version 1.0.
Disclaimer: This article is general information only and does not constitute financial, investment or property advice. Figures are drawn from HtAG Analytics data at period end 31 May 2026 and external sources cited inline; markets change and past performance is not a reliable indicator of future results. Consider your own circumstances and seek licensed professional advice before making any property decision.


