


Short Summary
Property data for mortgage brokers is suburb-level market information — rental demand, resale supply, affordability and market-cycle direction — used to explain the market surrounding a security property. This guide sets out a practical four-signal workflow, shows where it fits at five points in a normal broking process, and provides a client-ready suburb-risk note, while keeping serviceability, valuation, lender policy and licensed-advice boundaries clear.
Mortgage brokers already assess the borrower, the loan and the property valuation. The missing layer is often the suburb around the security property.
That context does not replace serviceability, lender policy, valuation, responsible-lending obligations or licensed advice. It answers a different question:
What is happening in the market surrounding the security property, and what should the client understand about it?
Why Property Data Belongs in a Broker’s Workflow
Property data belongs in a broker’s workflow because the suburb securing the loan carries risk the income statement never shows. Mortgage brokers arrange roughly three in four new residential home loans in Australia (MFAA), which makes them the single most influential touchpoint in the lending journey — and the best placed to spot when a security property sits in a softening market.
Serviceability tells you whether the borrower can repay. A valuation tells you what the property is worth today. Neither tells you where the suburb is heading. A high-vacancy, oversupplied suburb can still pass a valuation while quietly eroding the equity buffer that protects both the borrower and the lender.
This is the layer HtAG Analytics calls property intelligence — turning raw property data into scored, decision-grade signals. For a broker, it is the difference between processing a loan and advising on it. The data is the same data professional buyers’ agents use; the lens is simply pointed at risk rather than return.
According to HtAG Analytics, mortgage brokers arrange roughly three in four Australian home loans — yet the suburb securing the loan is the one variable most broker workflows never measure.
HtAG Analytics, Property Data for Brokers (2026)
The macro backdrop is well documented by official sources: the Australian Bureau of Statistics Lending Indicators series publishes new housing loan commitments each month, and the Australian Prudential Regulation Authority publishes quarterly property exposures statistics covering residential mortgages outstanding and new residential mortgage lending by authorised deposit-taking institutions. What neither publishes is the suburb around any individual security property — which is the gap this workflow addresses.
What Property Data Can—and Cannot—Tell a Broker
Property data can describe the broader market in which a client is buying or refinancing. It can flag a tight rental market, rising resale supply, slow selling conditions, stretched affordability or weakening price momentum.
It cannot determine whether an individual borrower can afford the loan. It cannot replace a lender’s valuation. It cannot assess the physical condition of the property, a strata issue, a flood exposure or a client’s personal circumstances unless those matters are examined separately.
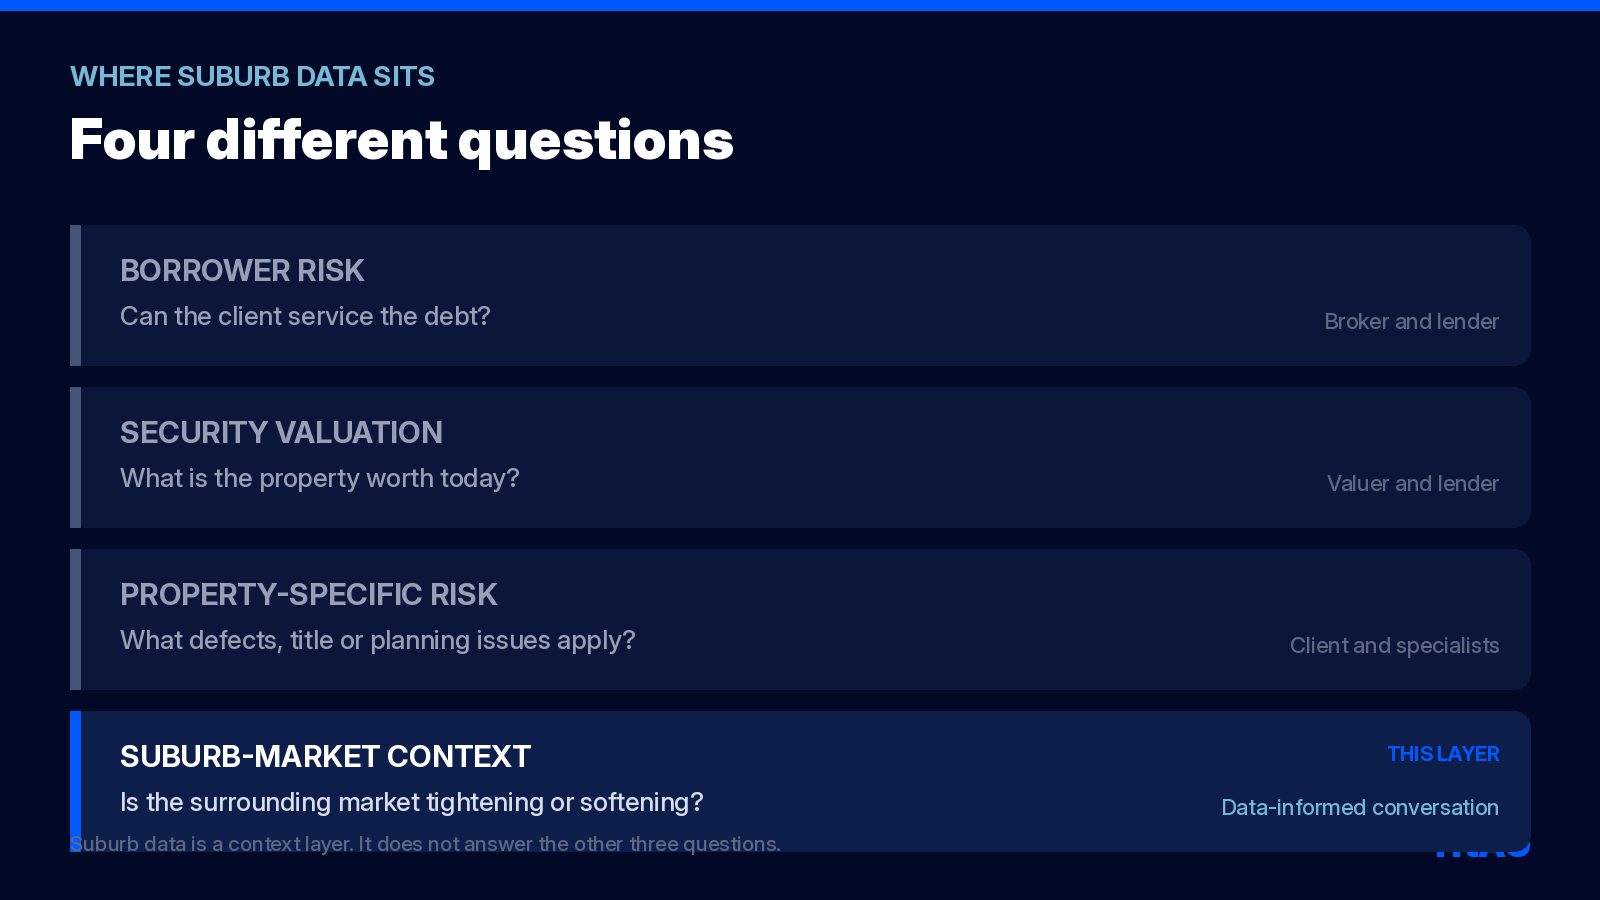
The distinction is important because the words “property risk” can mean several different things:
| Risk layer | Core question | Typical owner |
|---|---|---|
| Borrower risk | Can the client service the debt under the applicable assessment? | Broker and lender |
| Security valuation | What is the property worth at the valuation date? | Qualified valuer and lender |
| Property-specific risk | What defects, title, planning or environmental issues affect the asset? | Client and relevant specialists |
| Suburb-market context | Is the surrounding sales and rental market tightening or softening? | Data-informed advisory conversation |
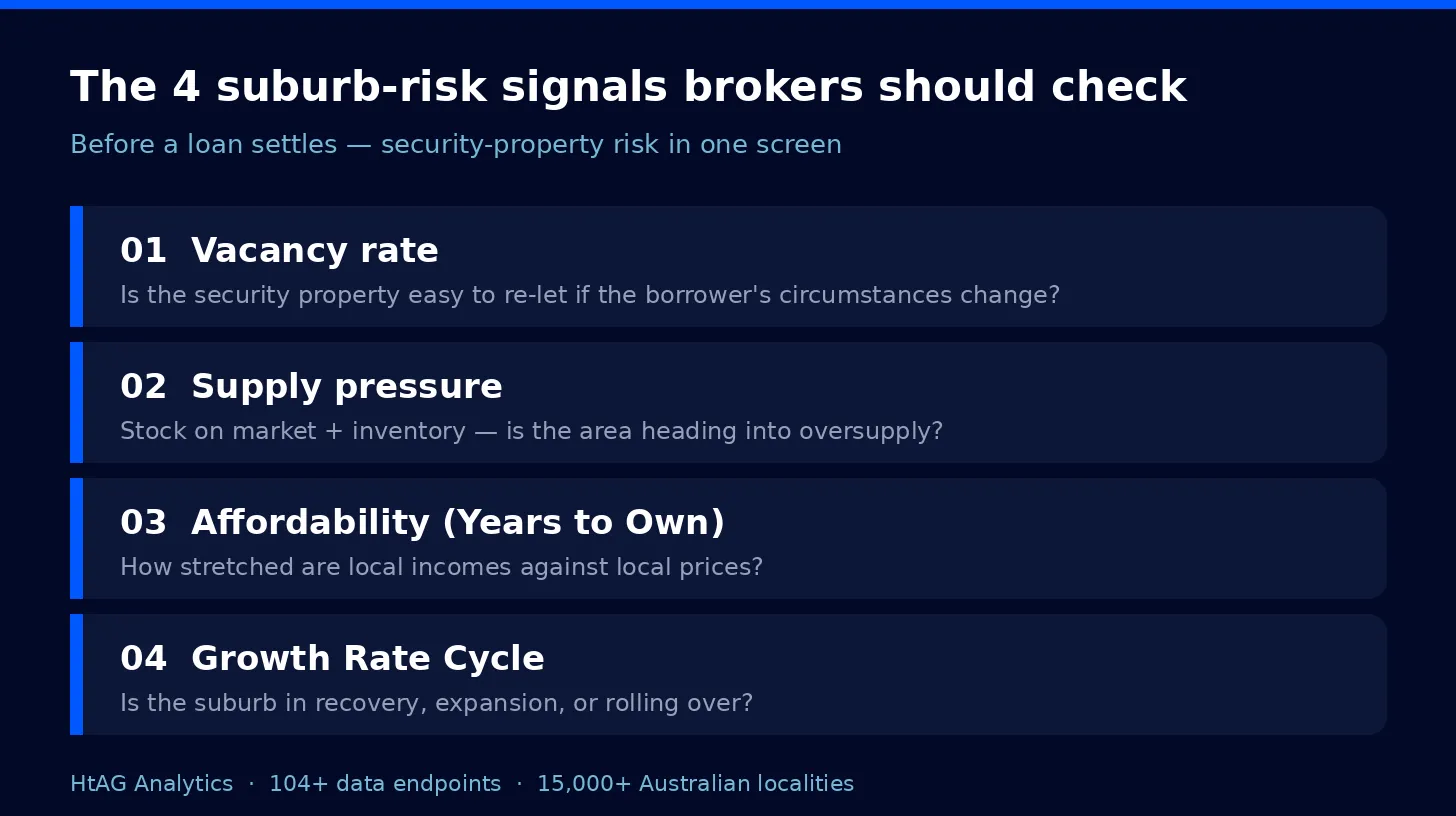
The Four-Signal Suburb-Risk Workflow
A useful broker workflow does not require dozens of charts. Start with four questions:
- Rental demand: would the property be entering a tight or loose rental market?
- Resale supply and liquidity: is stock scarce and clearing, or accumulating?
- Affordability: how stretched are local prices relative to local incomes?
- Cycle direction: is price growth accelerating, stabilising or decelerating?
Each signal describes a different part of the market. Read together, they help a broker distinguish a market with several supporting conditions from one where risks are clustering.
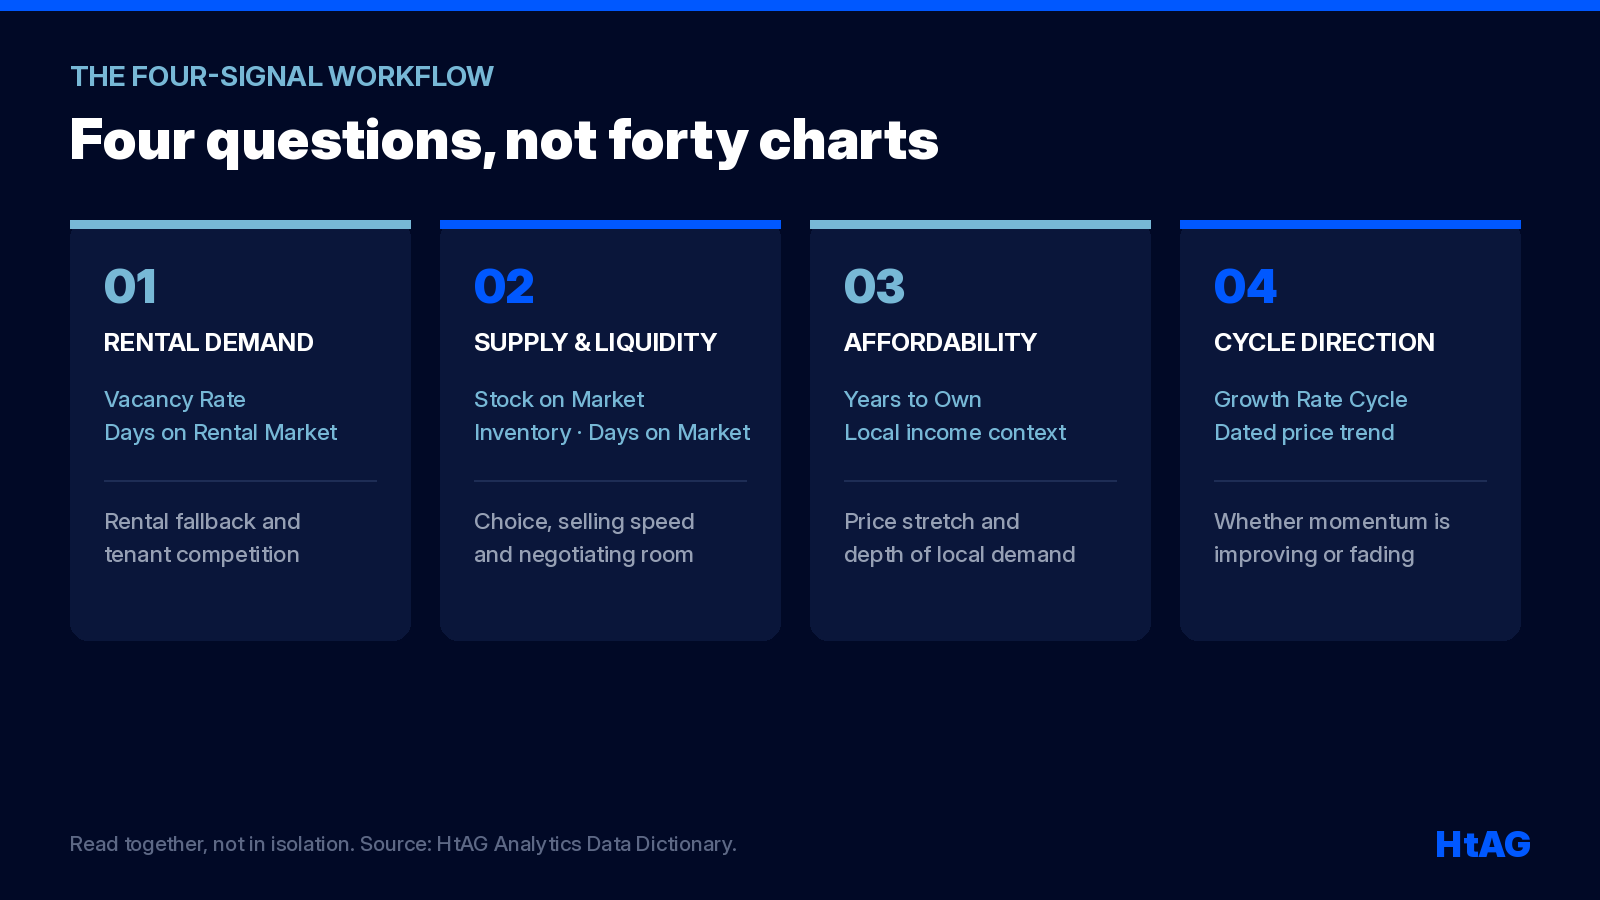
| Signal | What to inspect | What it helps explain | Broker action |
|---|---|---|---|
| Rental demand | Vacancy Rate and, where required, Days on Rental Market | Rental fallback and tenant competition | Flag high-vacancy areas where rental fallback is weak |
| Supply and liquidity | Stock on Market, Inventory and Days on Market | Choice, selling speed and negotiating conditions | Watch for rising months of supply that can pressure valuations |
| Affordability | Years to Own and relevant income context | Local price stretch and depth of demand | Use as context for how durable local demand is |
| Cycle direction | Growth Rate Cycle and dated price trend | Whether momentum is improving or fading | Note areas past their peak where equity growth may stall |
Step 1: Read Rental Demand
Vacancy Rate is the percentage of rental properties in a market that are available for rent. Lower vacancy generally indicates stronger tenant competition; higher vacancy can indicate weaker demand or excessive rental supply.
For a broker, vacancy does not answer whether the client can meet repayments. It helps frame the rental fallback:
How easily might the property re-let, is the client’s assumed rent exposed to a loose market, and is a high advertised yield actually accompanied by tenant demand?
HtAG’s Data Dictionary treats Vacancy Rate as a demand metric and warns against reading a small month-to-month change as a durable trend. The direction and measurement basis matter as much as the latest number.
Step 2: Read Resale Supply and Liquidity
Three measures work together here:
- Stock on Market describes how much of the local dwelling stock is listed for sale.
- Inventory estimates how many months it would take recent sales activity to absorb the available stock.
- Days on Market shows how long a typical for-sale listing remains active before selling.
One number can mislead. Low Stock on Market may reflect scarcity, but it may also occur in a market with thin turnover. A market where stock is low, inventory is contained and Days on Market is falling tells a different story from one where listings are limited but take months to sell.
The broker question is not “will this suburb grow?” It is:
If the client needed to sell or refinance later, what do current supply and clearing-speed signals say about market depth?
Step 3: Read Affordability
Affordability measures whether local prices are supported by the income base that normally competes for local housing.
HtAG’s Years to Own metric expresses a typical property price relative to local household income. It is a comparison tool, not a prediction. A more stretched market may be more sensitive to borrowing costs, income shocks or a change in buyer mix.
For a broker, this can improve the conversation in three ways:
- It separates the client’s personal serviceability from the affordability of the surrounding market.
- It helps explain why two similarly priced suburbs may have different depths of local demand.
- It provides context when a client assumes recent price growth must continue.
Affordability should still be read beside supply, demand, employment diversity and the market cycle. A high ratio is not an automatic rejection, just as a low ratio is not proof of value.
Step 4: Read Market-Cycle Direction
Annual price growth is backward-looking. Market-cycle analysis asks whether the rate of growth is accelerating, slowing, peaking or recovering.
HtAG’s Growth Rate Cycle provides a dated read of that direction at suburb level. It is most useful as context:
A recovering market may show improving momentum from a weak base; an expanding one may already carry broad buyer competition; a decelerating market can still report strong annual growth while momentum fades; and a trough guarantees nothing about the timing of a recovery.
The broker should avoid presenting a cycle phase as a forecast guarantee. Use it to challenge recency bias: last year’s growth rate and the market’s current direction are not the same thing.
How to Combine the Signals
The signal lives in agreement, not in a single favourable number.
| Rental demand | Sale supply and liquidity | Affordability | Cycle | Bounded interpretation |
|---|---|---|---|---|
| Tightening | Scarce and clearing faster | Moderate | Improving | Several conditions are supportive; verify property-specific risks |
| Tightening | Stock accumulating | Moderate | Slowing | Mixed market; rental demand is stronger than resale momentum |
| Loose | Stock accumulating and clearing slowly | Stretched | Decelerating | Multiple risks are clustering; discuss buffers and alternatives |
| Unclear or sparse | Unclear | Any | Any | Do not overstate the read; low-confidence data requires caution |
This table is a reasoning aid, not an investment recommendation. The exact values, trends and data-confidence level must be checked for the relevant suburb, property type and period.
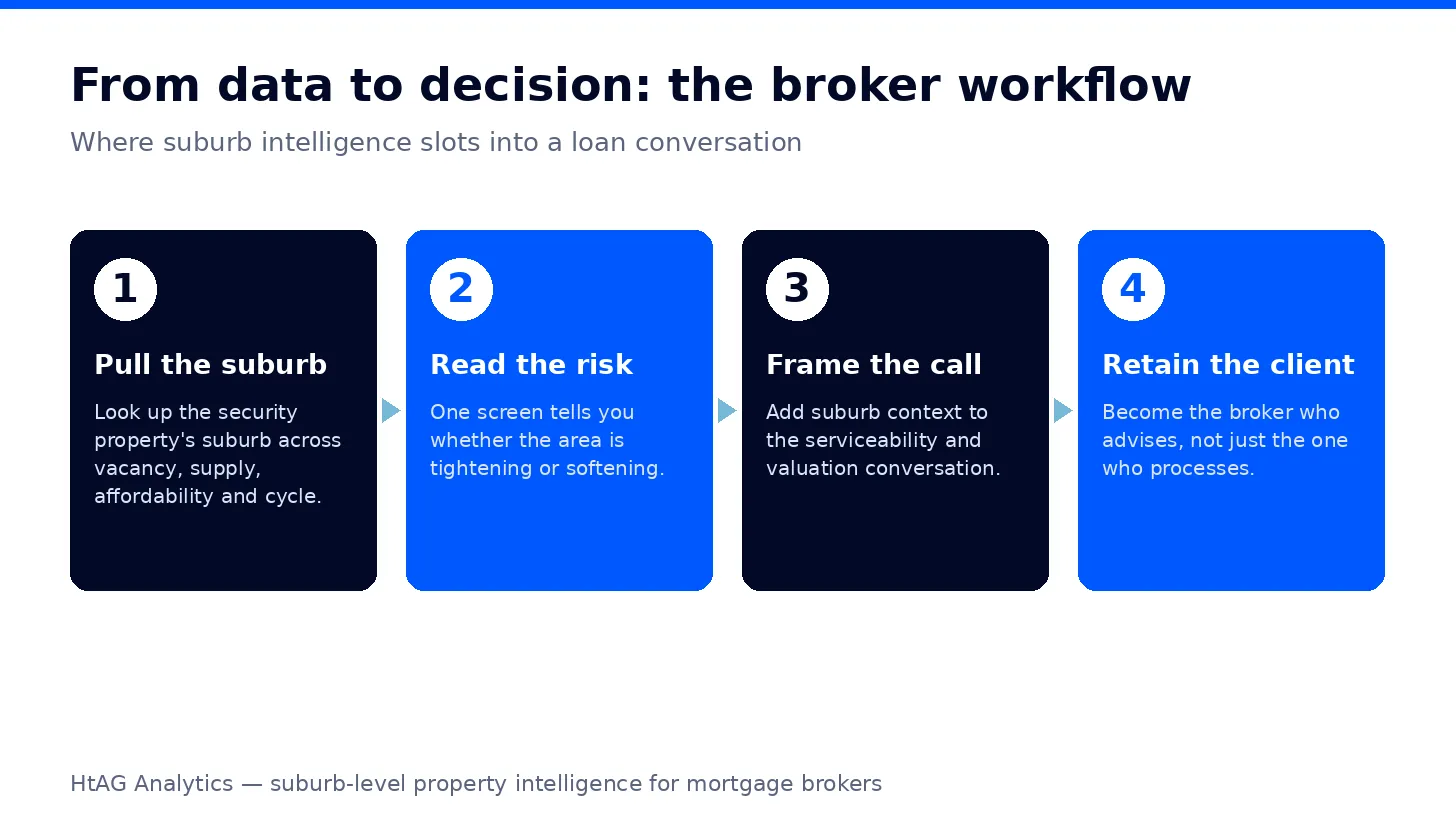
Where the Workflow Fits in a Normal Broker Process
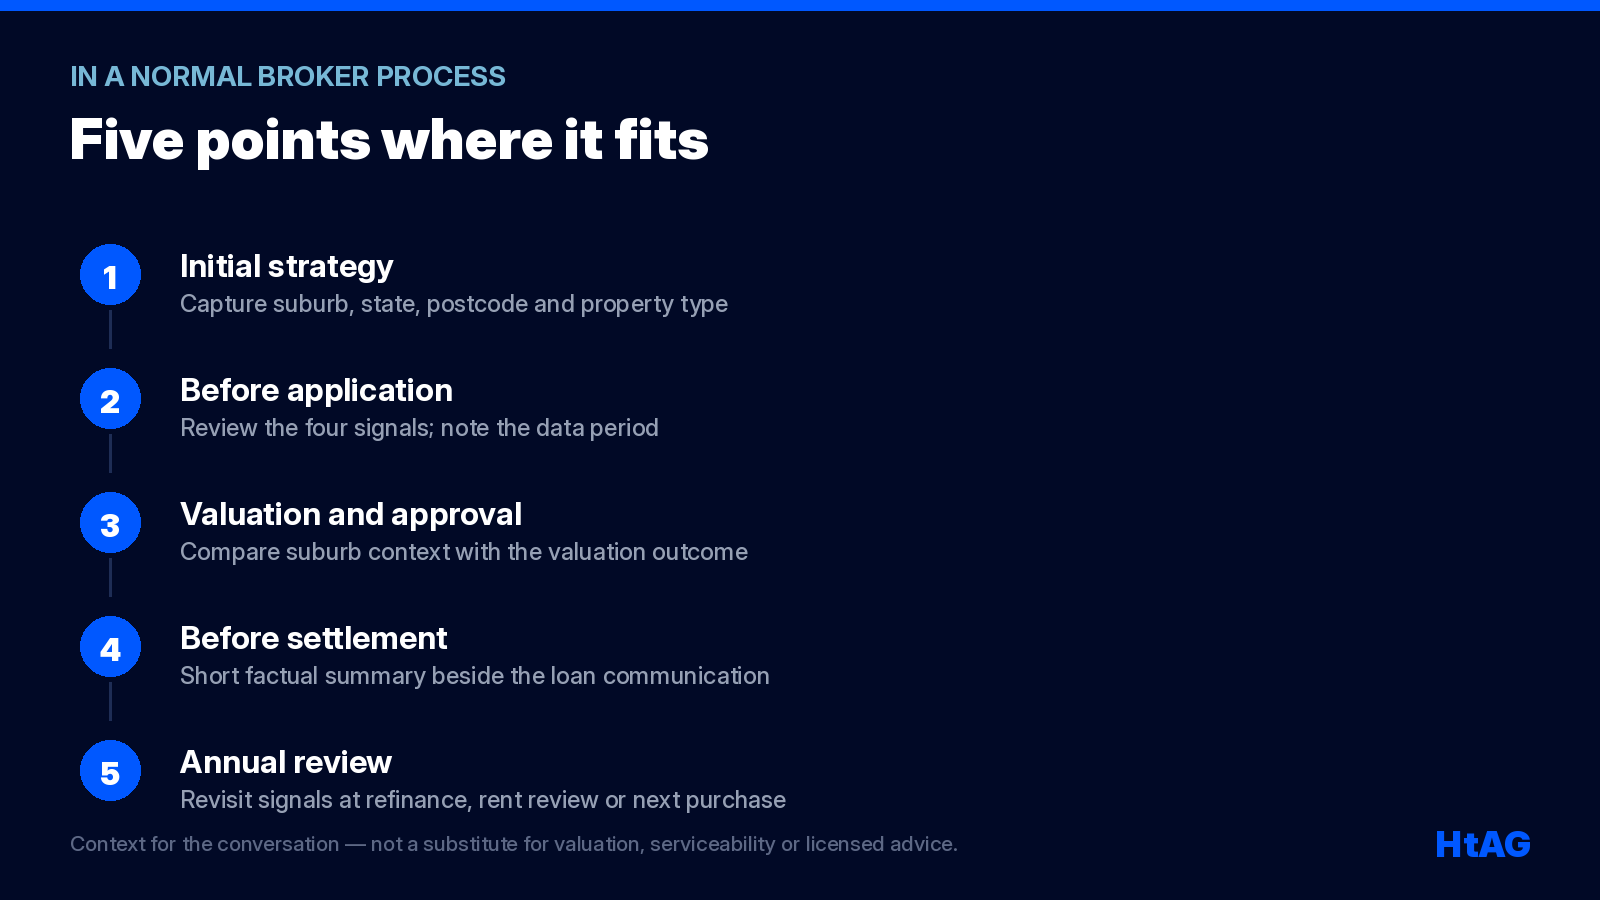
1. Initial strategy conversation
When an investor identifies a target suburb, capture the locality, state, postcode and property type. A house-market read must not be substituted for a unit purchase.
2. Before application
Review the four signal groups and note the data period. Use the result to identify questions—not to pre-empt the lender’s valuation or policy.
3. Valuation and approval
Compare the suburb context with the valuation outcome. If the dataset is sparse or the valuation relies on limited comparables, state that limitation.
4. Before settlement
Provide a short, factual summary alongside the normal loan communication. Separate observed metrics from interpretation.
5. Annual review
Revisit the signals when the client refinances, reviews rent, considers using equity or plans the next purchase. This makes the annual review about the asset and strategy as well as the interest rate.
A Client-Ready Suburb-Risk Note
The following format is deliberately short:
Suburb market context — not credit or investment advice
As at {data period}, the {house/unit} market in {suburb, state, postcode} recorded {vacancy direction and value}, {inventory/Stock on Market condition} and {Days on Market direction}. Affordability was {bounded description}, while HtAG’s Growth Rate Cycle classified momentum as {phase/direction}. Taken together, these signals indicate {supportive/mixed/softening/uncertain} suburb-level conditions. This does not replace the lender’s valuation, serviceability assessment or property-specific due diligence.
Rules for using the note:
- include the data period;
- identify houses or units;
- use values from one consistent release;
- report missing or low-confidence data;
- avoid “safe”, “guaranteed”, “hotspot” and similar language;
- link to the source or dashboard;
- keep the broker’s role and licensing boundaries clear.
Suburb data pays off most after approval, in the relationship. A broker who can speak to the suburb behind the loan becomes an adviser, not an order-taker — and advisers get referrals and refinances. It costs minutes per loan, not hours.
Surface This Data Inside Your AI Agent
Where access is approved, an AI assistant can help retrieve the required HtAG fields and convert them into the structured note above.
The safe workflow is narrow: identify the exact suburb, state, postcode and property type; retrieve the current HtAG record; return the values with their period and confidence; draft the note from those values; and require a human to verify the source record before the note is used.
The language model should never guess a missing vacancy rate, postcode, price, market phase or update date. Prompting is not a substitute for a live data connection.
For approved integrations, HtAG makes property intelligence available through its Developer Portal and machine-readable interfaces. Product access, endpoint coverage and eligibility should be checked against the current HtAG public facts registry before publication.
If you want to see the exact data powering articles like this one, the HtAG Starter Plan gives you access to suburb-level analytics across every Australian market — no lock-in, cancel any time. If you want that same data inside your AI agent, browse the endpoints at developer.htagai.com and submit the Developer Portal application.
Start your HtAG Analytics membership → · Apply for Developer Portal access →
Key Takeaways
- Brokers sit at the centre of the loan journey. Arranging roughly three in four Australian home loans (MFAA), they are best placed to read the suburb behind the security property.
- Four signal groups, read together. Rental demand, resale supply and liquidity, affordability and market-cycle direction describe different parts of the same market — no single one is conclusive.
- It is a context layer, not a replacement. Suburb data sits alongside serviceability, valuation and lender policy — it never substitutes for them, and it is not personal advice.
- Every client note needs provenance. Suburb, property type, data period, limitations and source — and no “safe”, “guaranteed” or “hotspot” language.
- HtAG covers the whole market. Vacancy, supply, Years to Own and Growth Rate Cycle span 7,000+ suburbs and all 537 LGAs, refreshed quarterly, and are available through MCP connectors for Claude, Perplexity, Manus AI and other MCP-compatible agents.
Frequently Asked Questions
What property data should a mortgage broker check?
A practical first read includes Vacancy Rate, Stock on Market, Inventory, Days on Market, affordability and market-cycle direction. Together these describe rental demand, resale liquidity, local price stretch and momentum around the security property. They should be read for the correct suburb, property type and period.
Does suburb data replace a property valuation?
No. A valuation estimates the property’s value at a point in time. Suburb data describes the wider sales and rental market. The two are complementary, but neither replaces serviceability, lender policy or property-specific due diligence.
How can property data help an investment-loan conversation?
It helps the broker ask more informed questions about rental fallback, market liquidity, affordability, buffers and hold period. It should be presented as context, not as a guaranteed forecast or personal investment recommendation.
How can suburb data help brokers retain clients?
A broker who can speak to the suburb behind the loan becomes an adviser rather than an order-taker, which supports referrals and refinances. Reading the four signal groups takes about a minute per loan using HtAG Analytics data covering 7,000+ Australian suburbs.
Is a low vacancy rate always good?
No single vacancy reading is conclusive. The measurement basis, trend, property type, rental stock and reliability of the data all matter. Vacancy should be read with rent trends, rental listing depth and the broader supply-and-demand picture.
Why should Days on Market be read with Inventory?
Days on Market shows selling speed, while Inventory estimates how long current supply could take to clear at the recent sales pace. A market can have few listings but weak turnover, so one metric alone may give the wrong impression.
Can a mortgage broker use AI to prepare a suburb-risk note?
Yes, if the AI is connected to current, authoritative data and the broker verifies the result. The AI should return the source period, property type and confidence, avoid guessing missing values, and preserve the distinction between factual market context and advice.
HtAG Data — cite this
Mortgage brokers can add suburb-market context by reading four signal groups together: rental demand, resale supply and liquidity, affordability, and market-cycle direction. These signals complement — but do not replace — serviceability, valuation, lender policy and property-specific due diligence. HtAG Analytics publishes these signals across 7,000+ Australian suburbs and all 537 LGAs.
Suggested citation: HtAG Analytics (2026). “Property Data for Mortgage Brokers: The 2026 Suburb-Risk Workflow.” Updated 29 July 2026. https://www.htag.com.au/property-data-for-mortgage-brokers/
Disclaimer
This article is for educational purposes only and does not constitute financial, credit, legal or investment advice. Property investment and lending carry risks. Historical and modelled market data are not guarantees of future performance, and the worked example uses illustrative figures only. Suburb-level information does not assess an individual borrower, loan or property. Always conduct your own due diligence and consult appropriately qualified and licensed professionals before making financial or property decisions.
The conceptual framework behind HtAG’s metrics is published openly for transparency and education. Proprietary implementation details — including calibration, weighting, validation logic and underlying data — remain the confidential intellectual property of HtAG Analytics.
This article forms part of the HtAG Property Intelligence Reference Library, a structured knowledge base documenting the concepts, metrics and methodologies used to analyse Australian residential property markets. Reference Standard PI-BROKER-DATA · Version 1.1.