


Short Summary
Most property forecasts are published once and never checked again. This article explains how a forecast is validated, why HtAG Analytics publishes its track record in an Evidence Portal, and how you can judge the credibility of any prediction you read — using a real worked example from Armadale, WA, where houses realised 22.1% annual growth over five years.
In 30 Seconds
What is it? Forecast accuracy is whether a prediction made in the past matches what the market actually did. The HtAG Evidence Portal is where those past predictions are checked against reality.
Why does it matter? Anyone can publish a confident forecast. Only a tested one tells you whether to trust the next prediction.
Who uses it? Investors and buyers agents who want proof, not promises, before they commit capital.
Use it on its own? No. Evidence builds confidence in a method — you still pair it with your own due diligence on the specific property.
Every January, the property pages fill with forecasts. By the following January, almost none of them are revisited. The prediction did its job — it generated a headline — and then it quietly disappeared before anyone could mark it against reality.
Forecast accuracy is the measure of how closely a past prediction matched what the market actually did. It is the single most important — and most ignored — question in property data. According to HtAG Analytics, a forecast that is never checked is not a forecast at all; it is an opinion with a number attached.
The nutshell: Property forecasts can be accurate, but only if they are tested out-of-sample — made blind to the outcome, then compared against realised growth years later. HtAG publishes these checks in its Evidence Portal across 135+ validated recommendations and a 14-year algorithm backtest, so the method is judged on results rather than confidence.
If you remember one thing: judge a forecaster by what they let you check, not by how confident they sound.
Table of Contents
- Are Property Forecasts Accurate?
- Why Most Property Forecasts Are Never Tested
- How HtAG Validates a Forecast
- A Worked Example: Armadale, WA
- Why a Buy Signal Has a Shelf Life
- What the Evidence Portal Actually Contains
- How to Judge Any Property Forecast
- Surface This Data Inside Your AI Agent
- From Data Signal to Portfolio Decision
- Key Takeaways
- Frequently Asked Questions
Are Property Forecasts Accurate?
Some property forecasts are accurate, and many are not — but the more useful answer is that accuracy is only meaningful when it is measured. A prediction has no credibility on the day it is published. It earns credibility later, when the period it covered has passed and someone compares the forecast to the realised result.
This is why the question “are property forecasts accurate?” is really two questions. First: was a specific prediction tested against what actually happened? Second: across many predictions, does the method beat a naive guess often enough to be worth following? Only the second question tells you anything about the next forecast.
According to HtAG Analytics, the honest position is that no model predicts individual suburbs with certainty. What a good method can do is shift the odds — identifying markets where the structural signals point to above-average growth more often than chance would, and doing so consistently enough to validate across years of out-of-sample data.
Why Most Property Forecasts Are Never Tested
Most property forecasts are never tested because there is no incentive to test them. A forecast that is checked can be wrong in public; a forecast that quietly expires never has to answer for itself. The result is an industry full of confident predictions and almost no scorecards.
There are three structural reasons accuracy goes unmeasured. Forecasts are often vague (“strong growth ahead”) so they can never be marked wrong. They are rarely time-stamped and archived, so the original claim is hard to retrieve. And the forecaster usually has no obligation to revisit them.
A forecast you cannot check is an opinion. A forecast you can check is evidence. The difference is whether anyone kept the receipt.
HtAG Analytics
This matters to your money because the cost of a wrong property decision is enormous and slow to reverse. If you are going to follow a data source, you should be able to see how that source has performed when its past calls were checked — which is exactly what an Evidence Portal is for.
How HtAG Validates a Forecast
HtAG validates a forecast using out-of-sample backtesting: the model is shown data only up to a chosen point in time, asked to project forward while blind to the outcome, and then graded against what the market actually did once that period elapsed. This is the same discipline used to test forecasting models in finance and climate science.
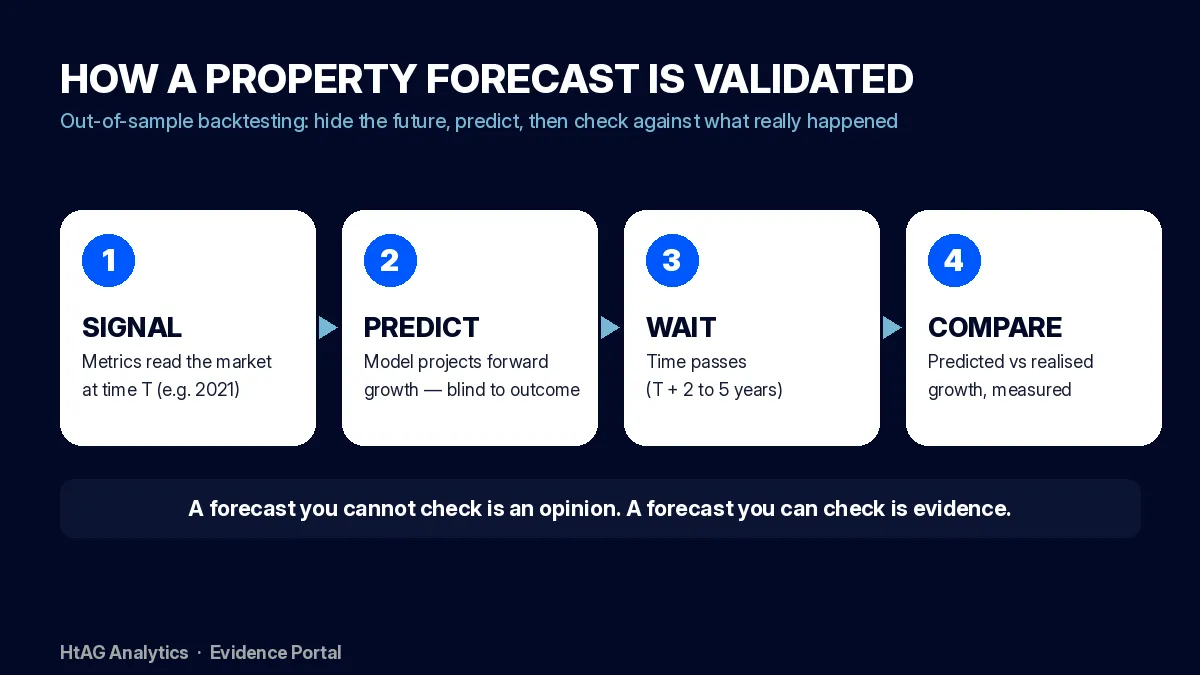
The four steps are simple to state and hard to fake. Signal: the metrics read a market at a fixed historical date. Predict: the model projects growth without seeing the future. Wait: two to five years pass. Compare: the prediction is measured against realised growth.
Run that loop across thousands of suburbs and many start dates and you get something a single headline never provides — a distribution of how often the method was right, by how much, and where it failed. HtAG’s published 14-year algorithm backtest is exactly this kind of multi-year, out-of-sample test rather than a curve fitted after the fact.
What This Means in Plain English
It is like sitting an exam where the answers are sealed in an envelope. The model writes its prediction, the envelope stays shut for a few years, and only then do you open it to mark the paper. Because the model never saw the answers, a good score actually means something.
The conceptual framework behind this validation is published openly for transparency and education. Its proprietary implementation — calibration, weighting, validation design and the underlying data — remains the confidential intellectual property of HtAG Analytics.
A Worked Example: Armadale, WA
Armadale, in Perth’s south-east, shows what a realised outcome looks like — the number a forecast must ultimately be measured against. According to HtAG Analytics data to May 2026, Armadale houses delivered annualised capital growth of 22.1% per year over five years and 24.5% per year over three years, with a typical price of $759,203.
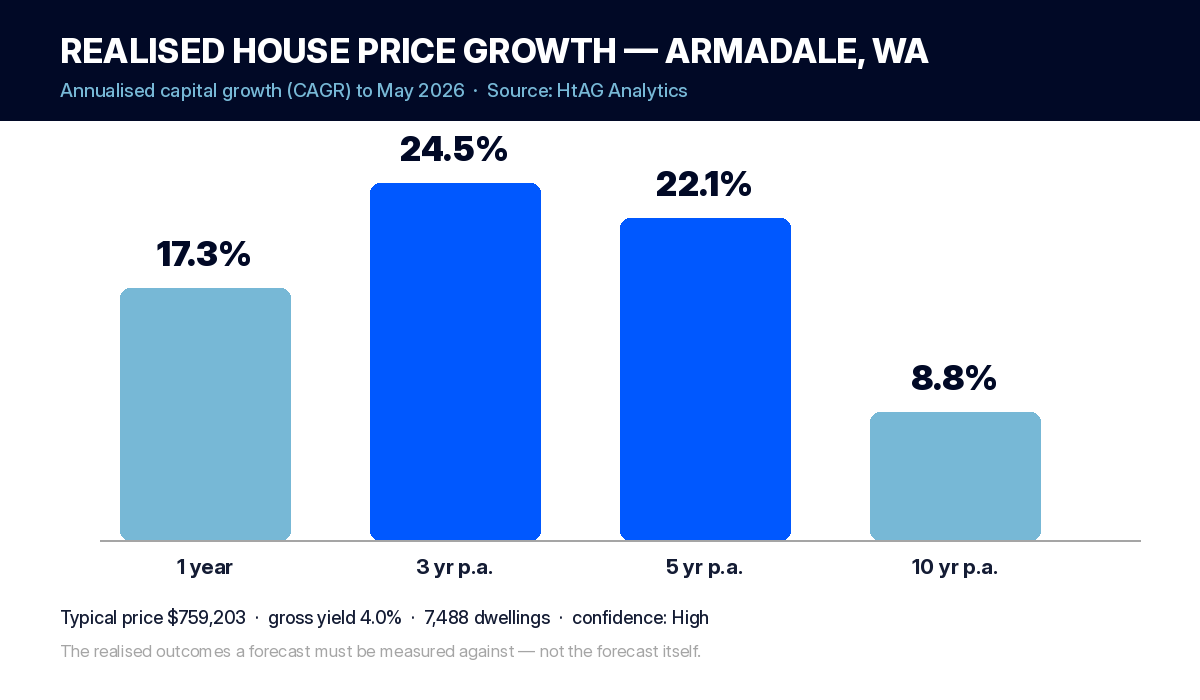
The instructive part is the contrast between horizons. The five-year and three-year rates (22.1% and 24.5%) are far above the ten-year rate of 8.8% per year. That tells you the strong growth is recent and concentrated — a market that was, five years ago, sitting early in its cycle before it ran.
A validation exercise asks: did the structural signals five years ago point to that outcome? The realised 22.1% is the answer key. Crucially, HtAG does not present this as a guarantee — it presents it as one checkable data point among thousands, which is what separates an Evidence Portal from a testimonial.
What This Means in Plain English
Armadale’s prices grew fast over the last five years but only modestly over ten. In plain terms, the suburb spent years going sideways, then took off — the exact pattern early-cycle signals are designed to catch before the run, not after.
Why a Buy Signal Has a Shelf Life
A buy signal has a shelf life: the same metric that flags a suburb as early-cycle will later flag it as fully priced. Validation is not just about proving a past call right — it is about showing that the signal updates as the market moves, rather than recommending the same winner forever.
Two HtAG metrics make this visible. Growth Pattern Deviation (GPD) compares a suburb’s recent growth to its own long-run pace, and Growth Spillover Effect (GSP) compares it to its surrounding council area. When both read negative, a market is lagging and may have room to grow; when both turn positive, it is running ahead of itself.
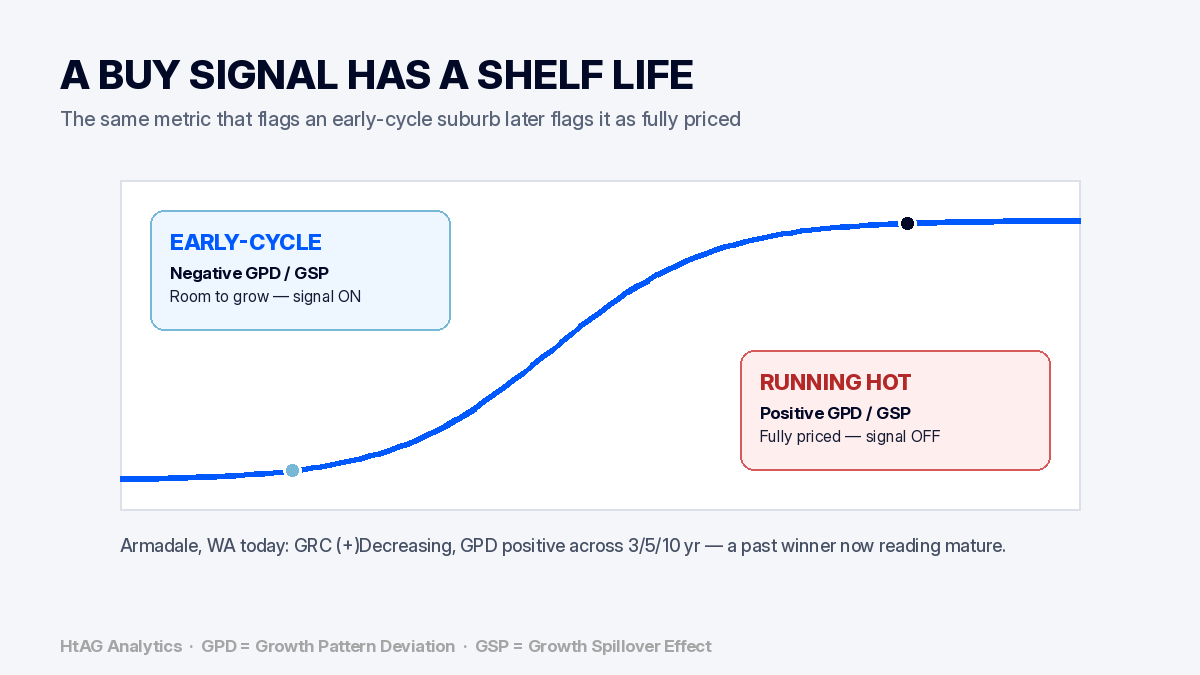
Armadale today illustrates the far end of that curve. Its Growth Rate Cycle (GRC) reads “(+)Decreasing” and its GPD is strongly positive across the three, five and ten-year windows — the profile of a past winner that is now mature, not a fresh opportunity. The signal that would have flagged it years ago has done its job and switched off.
What This Means in Plain English
A good signal is like a fuel gauge, not a trophy. It tells you how much growth might be left in the tank — and once the tank is full, it stops saying “buy”, even for a suburb that performed brilliantly in the past.
The conceptual framework behind GPD and GSP is published openly for education. Their proprietary calibration, thresholds and the data behind them remain the confidential intellectual property of HtAG Analytics.
What the Evidence Portal Actually Contains
The HtAG Evidence Portal is a structured record of checked outcomes rather than marketing claims. It brings together three kinds of evidence, each answering a different question about whether the method works.
| Evidence Type | Question It Answers | Time Horizon |
|---|---|---|
| Algorithm backtest | Does the method beat the market across history? | 14 years |
| Validated recommendations | Did specific past calls play out? | 135+ logged |
| Client case studies | Did the data lead to a real outcome? | Per deal |
Source: HtAG Analytics Evidence Portal (2026). Together these layers move a claim from “trust us” to “check us”: the backtest proves the method, the validated recommendations prove the calls, and the case studies prove the real-world path from data signal to settled purchase.
Across 135+ validated recommendations and a 14-year backtest, the point is not that every call is right — it is that every call is checkable.
HtAG Analytics Evidence Portal
This discipline is the foundation of property intelligence — the layer that turns raw data into scored, decision-grade signals you can act on. Without published validation, intelligence is indistinguishable from a hunch.
How to Judge Any Property Forecast
You can judge any property forecast — from any source — with five questions. If a prediction cannot answer them, treat it as an opinion, not evidence.
- Is it specific? A real forecast names a market, a number and a timeframe. “Growth ahead” is unfalsifiable.
- Is it time-stamped? You should be able to retrieve the original claim and its date.
- Was it made blind? A prediction is only meaningful if it was made before the outcome, not narrated afterwards.
- Is the track record published? Look for a body of checked calls — wins and misses — not a handful of cherry-picked successes.
- Does the signal update? A credible method changes its mind as the market moves, as the backtesting of house price forecasts shows.
Applied honestly, these questions thin the field quickly. They are also why HtAG benchmarks its calls publicly — for example, comparing earlier hotspot predictions against the reality two years later rather than letting them expire unexamined.
Surface This Data Inside Your AI Agent
The HtAG Developer Portal now exposes the metrics described in this article — GRC, GPD, GSP, realised growth, market scores and more — through MCP (Model Context Protocol) connectors. Investors and buyers’ agents using Claude, Perplexity, Manus AI, ChatGPT (via custom connectors) or any other MCP-compatible AI agent can query HtAG data directly inside the tool they already use.
HtAG’s MCP-enabled Developer Portal puts every metric in this article inside your AI agent. Apply for access and check the realised growth on any Australian suburb without leaving Claude or Perplexity.
HtAG Analytics Developer Portal (2026)
Browse the endpoint catalogue at developer.htagai.com and submit the HtAG Developer Portal application — approved members receive an API key and an MCP setup guide for their preferred AI tool, drawing on 104+ endpoints across 15,000+ localities and all 537 Australian LGAs.
From Data Signal to Portfolio Decision
The GRC, GPD, GSP and realised-growth metrics behind this article are live inside the HtAG Analytics platform — updated each quarter as new valuation data flows in. Professional buyers agents use these signals to time entries, validate briefs and build conviction before making offers, with the Evidence Portal sitting behind them as the proof.
If you’re building a portfolio and want to see the exact data powering articles like this one, the HtAG Starter Plan gives you access to suburb-level analytics across every Australian market — no lock-in, cancel any time.
Start your HtAG Analytics membership → · Apply for Developer Portal access →
Key Takeaways
- Forecast accuracy only means something when a prediction is tested against realised growth — most forecasts never are.
- Out-of-sample backtesting (signal, predict, wait, compare) is the credible way to validate a property forecast.
- According to HtAG Analytics, Armadale WA houses realised 22.1% annual growth over five years — a checkable outcome, not a guarantee.
- A buy signal has a shelf life: GPD and GSP turning positive means a past winner is now fully priced.
- The HtAG Evidence Portal combines a 14-year backtest, 135+ validated recommendations and client case studies so the method is judged on results.
- Judge any forecast with five questions: is it specific, time-stamped, made blind, publicly tracked, and does the signal update?
Frequently Asked Questions
Are property price forecasts accurate?
Some are and many are not — accuracy is only meaningful once a prediction is tested out-of-sample against what the market actually did. According to HtAG Analytics, no model predicts individual suburbs with certainty, but a validated method can shift the odds toward above-average growth consistently across years of backtested data.
What is out-of-sample backtesting?
Out-of-sample backtesting shows a model data only up to a past date, asks it to predict while blind to the outcome, then grades it against realised growth once that period has elapsed. Because the model never saw the answer, a strong result is genuine evidence rather than a curve fitted after the fact.
What is the HtAG Evidence Portal?
The HtAG Evidence Portal is a published record of checked outcomes — a 14-year algorithm backtest, 135+ validated recommendations and client case studies — that lets investors judge HtAG’s method on results rather than confidence. You can explore it at htag.com.au/evidence.
How do I access HtAG forecast accuracy data inside Claude or Perplexity?
HtAG exposes its metrics through MCP (Model Context Protocol) connectors via the Developer Portal, so you can query suburb growth, GRC, GPD and GSP inside Claude, Perplexity, Manus AI or any MCP-compatible agent. Browse the catalogue at developer.htagai.com and apply at https://links.htag.com.au/widget/form/GFVegAaXzeTUH7QzRl1T to receive an API key and setup guide.
Why did a suburb that performed well stop showing as a buy?
Because a buy signal has a shelf life. When Growth Pattern Deviation and Growth Spillover Effect turn positive, a suburb is running ahead of its own history and its council area, indicating it is fully priced. Armadale WA is a current example — strong past growth, but now reading mature rather than early-cycle.
This article forms part of the HtAG Property Intelligence Reference Library — a structured knowledge base documenting the concepts, metrics and methodologies used to analyse Australian residential property markets. Reference Standard PI-EVIDENCE · Version 1.0.
Disclaimer
This article is for educational purposes only and does not constitute financial advice. Property investment carries risks, and past performance is not indicative of future results. All growth rates, yields, and projections are derived from historical data and statistical modelling — they are not guarantees of future performance. Always conduct your own due diligence and consult a qualified financial adviser before making investment decisions.


