


Quick Summary
In April 2026, a Sydney couple — one a data analytics professional — contacted HtAG through the website contact form. Forty-eight days later they were under contract on a near-new house in Durack, NT. This case study documents the full journey, with redacted extracts from the actual email thread, and explains the Suburb → Hex → Listing cascade that produced the result.
Most property research case studies are written after the growth shows up. This one is different: it documents the process — from first inquiry to signed contract — while the outcome is still unwritten. A property research case study is most useful when it shows the decisions, the data, and the communication trail, not just the result. That is what follows, with the clients’ identities removed and their words preserved.
Table of Contents
- Who the Clients Were and What They Asked For
- The Brief: Six Hard Criteria
- 7,409 Markets In, 7 Suburbs Out
- The Honest Disclosure Moment
- From Shortlist to Hex to Contract
- The 48-Day Timeline
- What This Case Study Proves — and What It Doesn’t
- Surface This Data Inside Your AI Agent
- From Data Signal to Portfolio Decision
Who the Clients Were and What They Asked For
The clients were a Sydney-based couple; one works professionally in data analytics. They were not HtAG subscribers. They found HtAG through the free masterclass tutorials and submitted a website contact-form inquiry on 24 April 2026. Their opening message, redacted only for identifying details, read:
“I am in pursue of investing in one or two properties with a budget and requirements in mind. Due to work and family [commitments, I watched the] Master class (free ones) tutorials and found it very interesting. I do come from a Data Analytics background too… my main reason of this email is to understand if there is a service where I don’t have to purchase the [subscription, where you] would be able to provide me with a top 5 or 10 matching properties (and suburbs) for a fee, with sorting by rank…”
Client inquiry, 24 April 2026 (names and contact details redacted, [sic] throughout)
This matters because the client was not a passive buyer. A data professional evaluating a data product is the hardest audience a methodology can face. His early emails questioned the report scope, the data refresh cycle, and the value relative to a buyers agent — and he said so directly:
“Appreciate your direct style. I respect the tool, the data, and the effort behind building it. I also come from a d[ata background]…”
Client email, 24 April 2026
The Brief: Six Hard Criteria
The brief was captured in writing before any analysis began. The clients’ objective was capital growth with a four-year hold and a three-year equity-extraction target. Their priority-ordered requirements, quoted from their email:
| Priority | Criterion (client’s wording) |
|---|---|
| 1 | Exit safety — “strong resale liquidity so that, in a distress scenario, it can be sold at breakeven” |
| 2 | High socio-economic profile, low crime, safe environment |
| 3 | Minimum 4.6% gross rental yield |
| 4 | Tight rental supply / high occupancy demand |
| 5 | Land component ≥ 500 sqm |
| 6 | Building age preferably under 10 years |
Budget: $550,000–$725,000. The brief, the agreement, and the invoice were all settled within five days of first contact. The analysis was deliberately scheduled after the month-end data refresh so the report would run on the freshest dataset — a choice the client agreed to in writing.
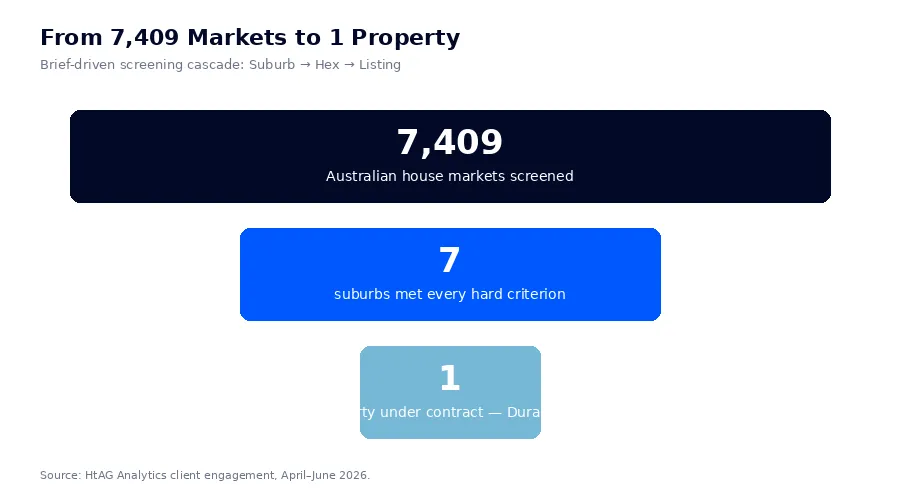
7,409 Markets In, 7 Suburbs Out
Only 7 of 7,409 Australian house markets satisfied every hard criterion in the brief simultaneously. That is the entire premise of brief-driven screening: hard filters do the eliminating, so attention concentrates where the data says it should. The delivery email stated it plainly:
“From 7,409 Australian house markets, only 7 met every hard criterion in your brief simultaneously — budget $550–725k, gross yield ≥4.6%, IRSAD ≥6, vacancy [threshold]…”
HtAG report delivery email, 4 May 2026
The deliverable was a 32-page strategy report plus interactive per-suburb pages with hex-level pocket maps and live listing pins. The methodology runs Suburb → Hex → Listing, in that order, because that is the order in which growth is built: per HtAG’s research, the suburb and hex layers explain the large majority of a property’s growth outcome, while the individual listing contributes only the residual share. You can explore the same suburb-level layer in the GeoDex heatmap, and the cycle logic behind it in the Growth Rate Cycle explainer.
What This Means in Plain English
Instead of starting with properties and justifying them afterwards, the method starts with every market in the country, eliminates everything that fails the client’s written requirements, and only then looks at individual streets and listings. The property you buy is the last decision, not the first.
The Honest Disclosure Moment
The strongest trust signal in the thread was not a win — it was a disclosed miss. One shortlisted suburb’s median yield came in 7 basis points under the client’s 4.6% threshold, and the report said so rather than rounding it away:
“[The suburb’s] median yield is 4.53%, not 4.60%. That’s a 7-basis-point gap — about $9 a week of rent on a $700k purchase. I disclose this plainly because… you’d be trading safety for yield. The interactive page lays out this trade-off explicitly.”
HtAG report delivery email, 4 May 2026
Similarly, when the top capital-growth match had zero in-budget listings, the report called the scarcity out as the signal itself rather than substituting near-enough listings from outside the thesis. According to HtAG Analytics methodology, scarcity of stock in a winning hex region is evidence of tightness — not a gap to be papered over. This is the same supply-side logic covered in the typical vs median price analysis.
From Shortlist to Hex to Contract
After a strategy call, the clients were given the top-10 mid-term list unrestricted by yield — dominated by Northern Territory markets, which the data flagged as the strongest mid-term cohort. The clients did their own inspections and due diligence, came back with six NT listings across Durack, Gunn and Rosebery, and asked for hex ratings on each. They were also progressing offers independently:
Durack itself was not a new name in HtAG’s data — it had independently ranked in the Top 10 High-Yield Suburbs in Regional Australia (Q1 2026) months before this engagement began. Two separate lenses, run at different times for different purposes, surfaced the same market.
“After thorough research, property inspections, and submitting offers — the below two properties are now in the final stages, with the sellers having accepted our offers.”
Client email, 29 May 2026
A final data-perspective comparison of the two finalists was provided — explicitly framed as data analysis, not financial advice. On 11 June 2026, the clients confirmed the outcome:
“We have decided to proceed with [a house in Durack, NT — address redacted] and are currently under contract for the property. We are extremely happy with the service you have provided and would be more than happy to recommend you to our friends and leave a positive review… we look forward to working with you on our next property purchase.”
Client email, 11 June 2026
Weeks earlier, unprompted, the same clients had already referred family members to the service. The purchase price was in the low $700,000s — inside the written brief’s budget band.
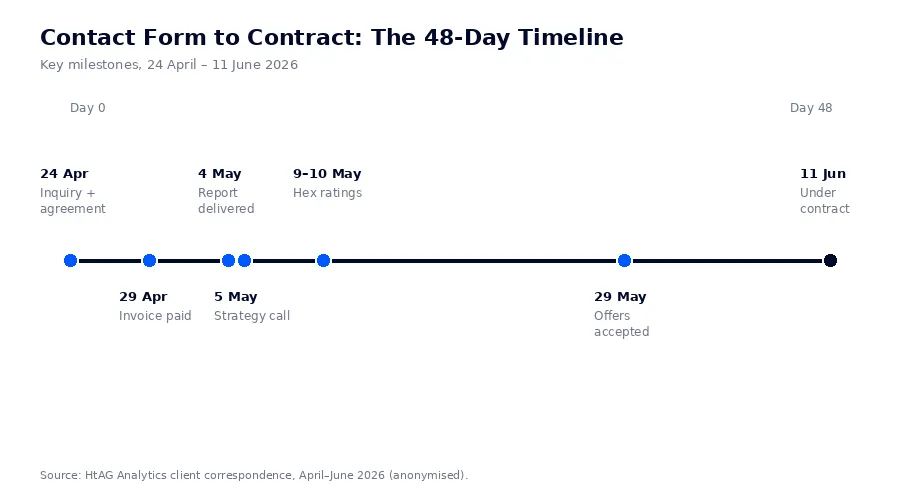
The 48-Day Timeline
| Date (2026) | Milestone |
|---|---|
| 24 Apr | Contact-form inquiry; brief questions answered same day; agreement signed |
| 29 Apr | Invoice paid; analysis scheduled on fresh month-end dataset |
| 4 May | 32-page report + interactive hex pages delivered: 7,409 markets → 7 suburbs |
| 5 May | Strategy call; top-10 mid-term list (NT-dominated) provided |
| 9–10 May | Clients shortlist six NT listings; hex-level ratings delivered |
| 29 May | Two accepted offers; final data comparison requested |
| 11 Jun | Under contract in Durack, NT — 48 days after first contact |
Source: HtAG Analytics client correspondence, April–June 2026 (anonymised).
What This Case Study Proves — and What It Doesn’t
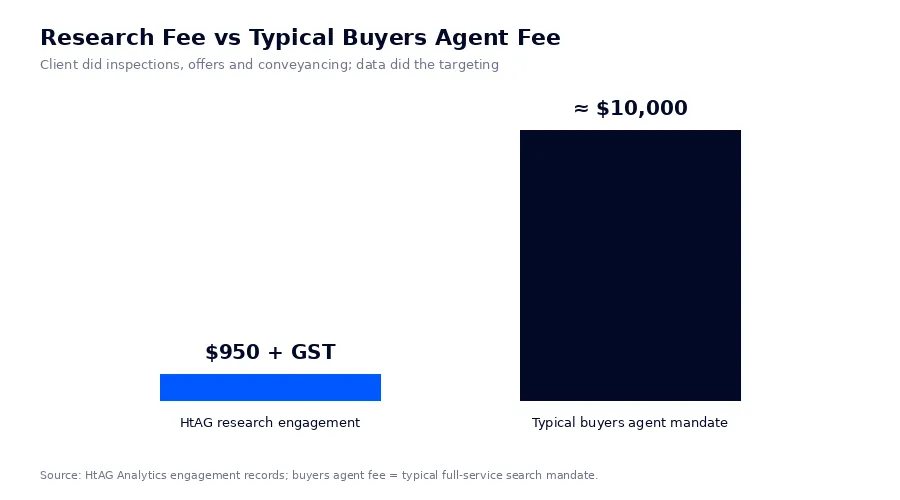
What it proves: a written brief plus hard-criteria screening across 7,409 markets can take a time-poor investor from inquiry to contract in 48 days, at a research fee of $950 + GST — against the roughly $10,000 a full buyers agent engagement typically costs. The clients did their own inspections, negotiations and conveyancing; the data did the targeting. Validated outcomes from earlier recommendations live in the Evidence Portal.
What it doesn’t prove: future growth. The property is under contract, not yet a track-record entry. HtAG is not a licensed financial adviser or buyers agent, and the service explicitly excludes property selection advice — every recommendation in the thread was framed as data analysis, with the final decision made by the clients. When the Durack market’s forward data matures, this case study will be updated with outcome figures, the same way every Evidence Portal entry is.
The behind-the-scenes thread — including how the methodology held up under a data analyst’s scrutiny — is also being discussed inside the HtAG Mastermind community. Members can read the discussion and ask questions in the From the Ground post.
Surface This Data Inside Your AI Agent
The HtAG Developer Portal exposes the same screening data used in this case study — suburb metrics, hex-level ratings, supply and demand series — through MCP (Model Context Protocol) connectors. Investors and buyers agents using Claude, Perplexity, Manus AI, ChatGPT (via custom connectors) or any MCP-compatible AI agent can query HtAG data directly inside the tool they already use.
HtAG’s MCP-enabled Developer Portal puts every metric behind this case study inside your AI agent. Apply for access and run a brief-driven screen on any Australian market without leaving Claude or Perplexity.
HtAG Analytics Developer Portal (2026)
Browse the endpoint catalogue at developer.htagai.com and submit the HtAG Developer Portal application — approved members receive an API key and an MCP setup guide for their preferred AI tool.
Key Takeaways
- A written, priority-ordered brief turned 7,409 Australian house markets into 7 qualifying suburbs — hard criteria did the eliminating, not opinion.
- The Suburb → Hex → Listing cascade puts the listing decision last, because suburb and hex layers explain the large majority of growth outcomes.
- Honest disclosure of a 7-basis-point yield miss strengthened, not weakened, client trust — the clients referred family before they had even purchased.
- Total elapsed time from contact-form inquiry to under contract: 48 days, at a research fee of $950 + GST.
- The outcome layer (capital growth) remains open and will be tracked in the Evidence Portal as forward data matures.
From Data Signal to Portfolio Decision
The screening, hex ratings and supply-demand signals described in this case study are live inside the HtAG Analytics platform — updated as new valuation data flows in. Professional buyers agents and investors use these signals to validate briefs and build conviction before making offers.
If you want to run the same lens over your own brief, the HtAG Starter Plan gives you suburb-level analytics across every Australian market — no lock-in, cancel any time.
Start your HtAG Analytics membership → · Apply for Developer Portal access →
Frequently Asked Questions
Is this case study real?
Yes. Every quoted extract is taken verbatim from the client email thread (April–June 2026), redacted only for names, addresses and contact details. The clients consented to anonymised publication.
How much did the research service cost compared to a buyers agent?
The research engagement was $950 + GST. A full-service buyers agent typically charges around $10,000 for a comparable search mandate — though a buyers agent also negotiates and transacts, which this service deliberately does not.
Did HtAG tell the clients which property to buy?
No. HtAG is not licensed to provide property selection or financial advice. The service provided data analysis — market screening, hex ratings, and side-by-side data comparisons — and the clients made every decision, including inspections, offers and the final choice.
How do I access HtAG screening data inside Claude or Perplexity?
Browse the endpoint catalogue at https://developer.htagai.com/ and submit the application form at https://links.htag.com.au/widget/form/GFVegAaXzeTUH7QzRl1T. Approved members receive an API key and an MCP setup guide for Claude, Perplexity, Manus AI and other MCP-compatible agents.
Will the outcome of this purchase be tracked?
Yes. Once forward growth data for the market matures, this case study will be updated and cross-listed in the HtAG Evidence Portal alongside previously validated recommendations.
Disclaimer: HtAG Analytics provides data and analytics services only. Nothing in this article constitutes financial, investment or property advice. Past or described outcomes do not guarantee future results. Seek advice from licensed professionals before making investment decisions.


