


Most real estate agents lose a listing in the first ten minutes of the appraisal — not on commission or marketing spend, but on price credibility. The vendor has already googled their suburb’s “median,” an agent down the road has quoted a number to win the door, and you are left arguing feel against feel. The fix is not a slicker pitch. It is better property data for real estate agents: a defensible price, a clearing-speed story, and a cycle read the vendor can see for themselves.
Property data for real estate agents is the set of suburb-level signals — a robust central price, days on market, auction clearance, and cycle position — that lets an agent appraise accurately, set realistic vendor expectations, and win the listing on evidence rather than optimism. Used well, it turns the listing presentation from a negotiation into a briefing.
Quick summary
Real estate agents win or lose listings on price credibility. This playbook shows how four data layers — Typical Price, days on market, the Growth Rate Cycle, and supply-and-demand signals — let you appraise accurately and set vendor expectations on evidence. Worked example: in May 2026, Frankston (VIC) houses were clearing in 21 days and tightening, while same-sized Blacktown (NSW) had blown out to 51 days — two markets that demand opposite pricing advice. Powered by HtAG Analytics across 15,000+ Australian localities.
In 30 seconds
What is it? The suburb-level data an agent uses to price a property, justify it to the vendor, and time the campaign.
Why does it matter? A defensible price wins listings and shortens campaigns; an inflated one wins the door, then dies on the market.
Who uses it? Listing and sales agents, principals coaching their teams, and appraisers building credible CMAs.
Use it on its own? No — pair the price signal with clearing speed and cycle position. One number without context is how listings get overquoted.
Table of contents
- What property data do real estate agents actually need?
- Why the median loses you listings — and Typical Price wins them
- Reading days on market: the Frankston vs Blacktown lesson
- The four-layer listing and appraisal data stack
- How agents put the data to work
- Surface this data inside your AI agent
- From market signal to won listing
- Key takeaways
- FAQs
What property data do real estate agents actually need?
Real estate agents need four things from their data: an accurate price anchor, a read on how fast comparable stock is clearing, a sense of where the suburb sits in its price cycle, and the supply-and-demand pressure behind it. Everything else — comparable sales, marketing benchmarks, buyer feedback — hangs off those four signals.
The mistake is treating “the median” as all four at once. A median tells you the middle of last quarter’s sales; it says nothing about clearing speed, cycle position, or whether demand is building or fading. According to HtAG Analytics, the suburbs where agents most often overquote are precisely those where a thin, skewed sales sample makes the median look higher — or lower — than the price a buyer will actually pay today.
An appraisal is only as defensible as the data behind it. According to HtAG Analytics, the agents who hold price through a campaign are the ones who walked in with clearing speed and cycle position, not just a comparable-sales list.
This is the same suburb-level intelligence that buyers’ agents and mortgage brokers rely on, viewed from the listing side of the table. If you have read our guides on how buyers agents research suburbs or property data for mortgage brokers, this is the sell-side companion: the same data, pointed at the appraisal.
Why the median loses you listings — and Typical Price wins them
Typical Price is a robust central price that better resists the outliers and small-sample skew that distort a raw median. It is the appraisal anchor an agent can defend — a number built to represent the home a buyer is actually shopping for, not the average of whatever happened to transact.
The difference matters most in exactly the suburbs agents list in: mid-market, mixed-stock areas where one prestige sale or one mortgagee disposal can drag a quarterly median by tens of thousands of dollars. Quote off that distorted median and you either overprice the campaign — and watch it stall — or underprice it and leave the vendor’s money on the table. Either way, your next appraisal in that street is harder.
What this means in plain English
The median is the middle of a messy pile of last quarter’s sales — a few odd sales can shove it around. Typical Price is built to ignore the odd ones and land on the “normal” home for that suburb. It is a steadier number to put in front of a vendor, and a steadier number to hold when offers come in.
We have written a full breakdown of why the median misleads in our explainer on Typical Price versus median price. For agents, the headline is simple: bring Typical Price to the appraisal and you are quoting a number designed to survive scrutiny, not one assembled from whatever sold.
Reading days on market: the Frankston vs Blacktown lesson
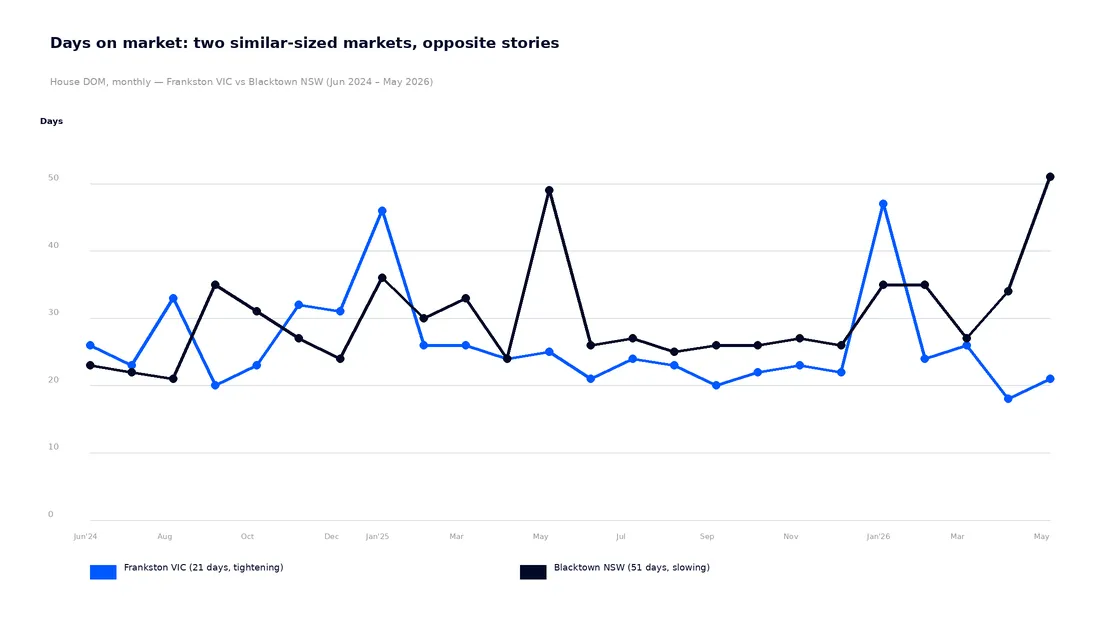
Days on market (DOM) is the single fastest read on whether your appraisal price is realistic. It measures how long comparable stock is taking to sell — and unlike a sale price, it updates every month and is hard to argue with. When DOM is short and falling, you can hold price. When it is long and rising, the market is telling the vendor something before you have to.
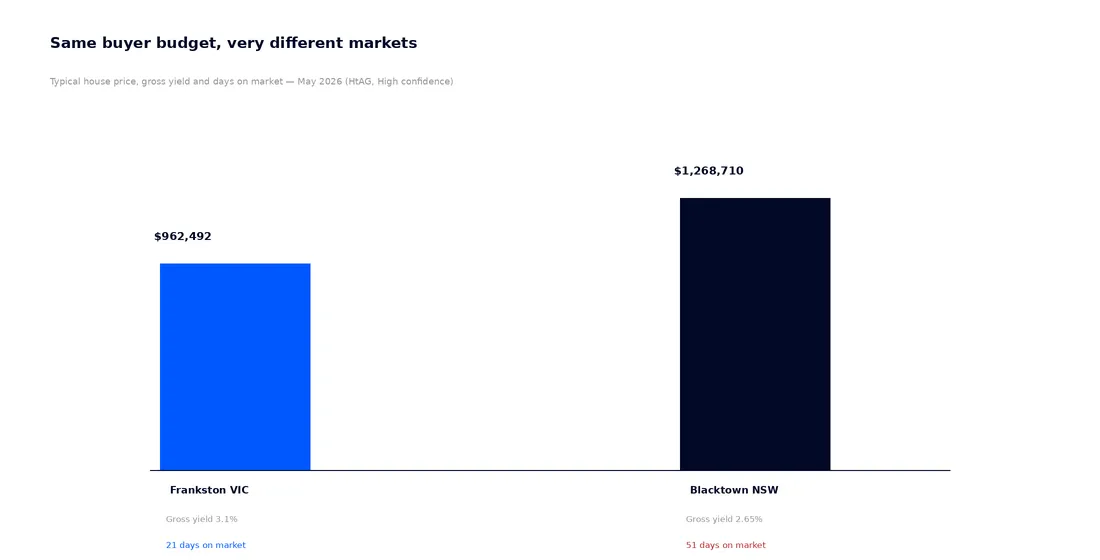
Consider two similar-sized house markets in May 2026. Frankston in Victoria (around 20,300 dwellings) was clearing houses in 21 days and had tightened from 26 days a year earlier. Blacktown in New South Wales (around 21,800 dwellings) had moved the other way — 51 days on market, up from 26 a year before. Same campaign budget, same auction toolkit, completely different pricing advice.
What this means in plain English
In Frankston, homes are selling fast and faster than last year — so an agent can confidently price at the top of the range and run a tight campaign. In Blacktown, homes are now sitting twice as long as a year ago — so the honest advice is a sharper price and a longer runway. Same data point, opposite vendor conversation.
This is where DOM beats gut feel. A vendor who insists on a 2024 price in a market that has doubled its selling time is heading for a stale listing and a price reduction. According to HtAG Analytics, showing the DOM trend at the appraisal — not after the third quiet open home — is what separates agents who set expectations from agents who manage disappointment.
Auction clearance rates tell the same story from the demand side, and the two read best together: short DOM with a firm clearance rate is a green light; rising DOM with a softening clearance rate is the signal to price for the market, not the dream.
The four-layer listing and appraisal data stack
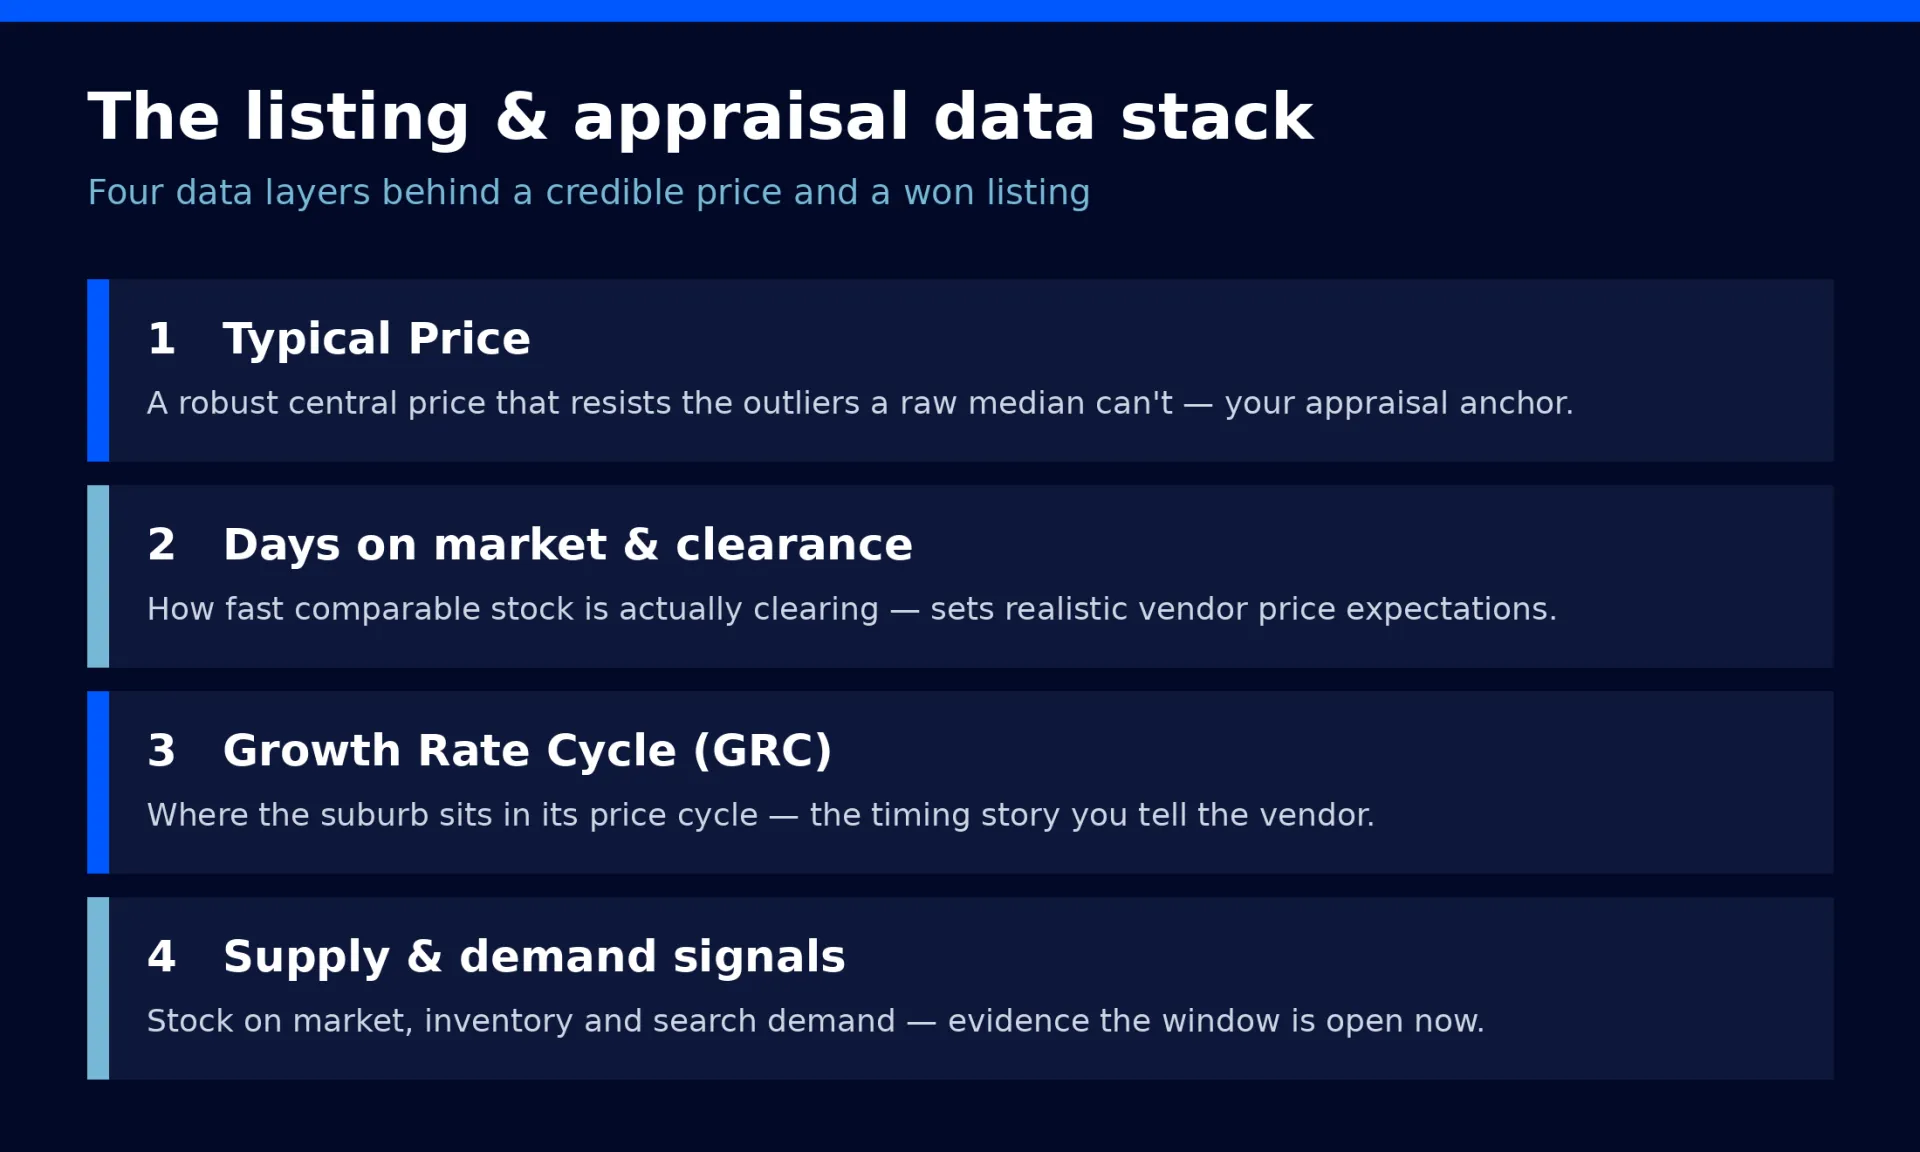
A credible appraisal is built from four data layers, not one. Each answers a different question the vendor will ask — what is it worth, how fast will it sell, is now a good time, and why should I believe you.
| Data layer | Vendor question it answers | How the agent uses it |
|---|---|---|
| Typical Price | “What is my home worth?” | The defensible appraisal anchor that resists median distortion. |
| Days on market & clearance | “How fast will it sell?” | Sets realistic price expectations and campaign length. |
| Growth Rate Cycle (GRC) | “Is now a good time to sell?” | The cycle-timing story that frames the “why now” conversation. |
| Supply & demand signals | “Why should I believe you?” | Stock on market, inventory and search demand as live evidence. |
Source: HtAG Analytics. The four-layer appraisal stack, 2026.
The third layer is the one most agents skip. The Growth Rate Cycle (GRC) tracks whether suburb-level price growth is accelerating or decelerating — the difference between “list now while momentum is on your side” and “we are late in the cycle, so price sharply.” It is the timing layer that turns a number into a recommendation.
What this means in plain English
Think of the four layers as price, speed, timing and proof. A vendor who hears all four — what it is worth, how quickly it will go, why this is the right moment, and the live evidence behind it — has very little left to argue about. That is a won listing.
How agents put the data to work
The data stack maps onto four everyday agent jobs. Each one is a place where evidence beats opinion.
- Accurate appraisals. Open with Typical Price, not the portal median, and you anchor the conversation on a number built to survive scrutiny. Layer in recent comparable sales to show your work.
- Winning the listing presentation. Bring the DOM trend and clearance rate as a printed chart. A vendor who can see the market clearing in 21 days — or stalling at 51 — trusts the agent who showed them first.
- Timing the vendor conversation. Use the Growth Rate Cycle to frame “why now.” Early-cycle momentum supports a confident campaign; late-cycle signals support a sharper, faster strategy.
- Matching stock to demand. Search-demand and supply signals show where buyer interest is concentrating, so you can position the property — and prospect for off-market vendors in the same pocket.
The same suburb-level data also powers prospecting. Knowing which pockets are tightening — short DOM, falling inventory, rising search demand — tells you where the next listings will come from. Our GeoDex suburb heatmap makes those pockets visible at a glance, and every claim an agent makes can be checked against the HtAG Evidence Portal, where past recommendations are tracked against what the market actually did. This is what we mean by property intelligence — raw data converted into scored, ranked, decision-grade signals an agent can act on directly.
Surface this data inside your AI agent
The HtAG Developer Portal now exposes the data described in this article — Typical Price, days on market, clearance, the Growth Rate Cycle and supply-and-demand signals — through MCP (Model Context Protocol) connectors. Agents using Claude, Perplexity, Manus AI, ChatGPT (via custom connectors) or any other MCP-compatible AI agent can pull suburb-level appraisal data directly inside the tool they already use, instead of re-keying numbers across tabs.
HtAG’s MCP-enabled Developer Portal puts every metric in this article inside your AI agent. Apply for access and run a full appraisal-grade suburb read on any Australian listing without leaving Claude or Perplexity.
HtAG Analytics Developer Portal (2026)
Browse the endpoint catalogue at developer.htagai.com and submit the HtAG Developer Portal application — approved members receive an API key and an MCP setup guide for their preferred AI tool. HtAG runs Australia’s first and only property-intelligence MCP platform, with 70+ public tools across 15,000+ localities and all 537 LGAs.
From market signal to won listing
The Typical Price, days on market, Growth Rate Cycle and supply-and-demand signals described in this article are live inside the HtAG Analytics platform — updated each quarter as new valuation and sales data flows in. Sales agents use these signals to appraise accurately, set vendor expectations early, and win listings on evidence.
If you list and sell property and want the exact data powering articles like this one, the HtAG Starter Plan gives you suburb-level analytics across every Australian market — no lock-in, cancel any time.
Start your HtAG Analytics membership → · Apply for Developer Portal access →
Key takeaways
- Listings are won or lost on price credibility — the agent with defensible data, not the highest quote, holds the appraisal.
- Typical Price is a robust central price that resists the outlier-driven distortion in a raw median, making it a stronger appraisal anchor.
- Days on market is the fastest realism check: in May 2026, Frankston houses cleared in 21 days while same-sized Blacktown took 51 — opposite pricing advice.
- A credible appraisal uses four layers: Typical Price, DOM and clearance, the Growth Rate Cycle, and supply-and-demand signals.
- The same suburb data drives prospecting — tightening pockets signal where the next listings will come from.
- HtAG data can be queried inside Claude, Perplexity or any MCP-compatible AI agent via the Developer Portal.
FAQs
What property data do real estate agents need for an accurate appraisal?
Agents need a robust central price such as Typical Price, days on market and auction clearance, the suburb’s cycle position via the Growth Rate Cycle, and supply-and-demand signals. According to HtAG Analytics, these four layers together produce a defensible appraisal — a single median figure does not.
Why is Typical Price better than the median for appraisals?
Typical Price is a robust central price designed to resist the outliers and small-sample skew that distort a raw median. In mixed-stock suburbs, a single prestige or distressed sale can shift the quarterly median by tens of thousands of dollars, leading to over- or under-quoting; Typical Price aims to represent the home a buyer is actually shopping for.
How does days on market help agents set vendor expectations?
Days on market shows how long comparable stock is taking to sell and updates monthly. Short and falling DOM supports holding price; long and rising DOM signals the need for a sharper price and longer campaign. Showing the trend at the appraisal sets expectations before a stalled listing forces a reduction.
Can property data help agents find new listings?
Yes. Suburb pockets with tightening days on market, falling inventory and rising search demand tend to precede new listings. Agents use these signals to focus prospecting where vendor activity is most likely in the coming months.
How do I access HtAG appraisal data inside Claude or Perplexity?
Browse the endpoint catalogue at developer.htagai.com and submit the application at https://links.htag.com.au/widget/form/GFVegAaXzeTUH7QzRl1T. Approved members receive an API key and an MCP setup guide, so HtAG suburb data can be queried directly inside Claude, Perplexity, Manus AI or any MCP-compatible AI agent.
The conceptual framework behind metrics such as Typical Price and the Growth Rate Cycle is published openly for transparency and education. Their proprietary implementation — calibration, weighting, validation and the underlying data — remains the confidential intellectual property of HtAG Analytics.
This article forms part of the HtAG Property Intelligence Reference Library — a structured knowledge base documenting the concepts, metrics and methodologies used to analyse Australian residential property markets. Reference Standard PI-AGENTS · Version 1.0.
Disclaimer: This article is for educational purposes only and does not constitute financial or property advice. Property markets carry risk, and past performance is not indicative of future results. All prices, yields and days-on-market figures are derived from historical data and statistical modelling — they are not guarantees of future outcomes. Always conduct your own due diligence and recommend that clients consult a qualified professional before making decisions.


