In 30 Seconds
The Gold Coast property market enters the new financial year with a Typical House Price of $1,744,184 — up 13.9% over the year to June 2026 and roughly four percentage points above its own 10-year pace. Powered by live HtAG Analytics data across 11 Gold Coast house markets, this forecast shows a city at (+)Peak in its growth cycle and split into two very different investment markets: a northern corridor with composite scores as high as 91/100, and a premium coastal strip scoring as low as 36.
The Gold Coast Market in 30 Seconds
What is it? A suburb-level, data-led forecast of the Gold Coast housing market for 2026–27, built on live HtAG Analytics valuation data rather than a single city-wide prediction.
Why does it matter? The Gold Coast grew 13.9% in a year — but that single number hides a 55-point quality gap between its strongest and weakest suburb markets.
Who uses it? Investors, buyers agents and brokers deciding whether — and more importantly where — to buy on the Gold Coast.
Can you use the city-wide number on its own? No. On the Gold Coast in 2026, the suburb you choose matters far more than the city you choose.
Every Gold Coast property market forecast published this year leads with the same kind of number: a city-wide median and a single growth prediction. That approach worked when the whole coast moved together. In 2026, it does not — and the suburb-level data explains why.
In a nutshell: the Gold Coast property market in 2026 is late-cycle but still growing. The Typical House Price reached $1,744,184 in June 2026 — up 13.9% in a year against a 10-year average of 9.6% per annum — with vacancy at 1.50%, gross yields compressed to 2.78%, and a 55-point composite-quality gap between the city’s strongest and weakest suburb markets.
This analysis uses live data from the HtAG Analytics platform, as at 30 June 2026, across the Gold Coast City house market and 11 of its suburb markets. It is a cycle read and a risk lens — not a crystal ball. If you want to understand what that distinction means in practice, our companion piece on whether property forecasts are actually accurate is the honest place to start.
Table of Contents
- How Fast Is the Gold Coast Property Market Growing?
- Where the Gold Coast Sits in Its Price Cycle
- A Two-Speed City: Suburb Scores Range From 36 to 91
- Gold Coast Property Market Forecast: What the Ranges Say
- How Investors Read a Market Like This
- Surface This Data Inside Your AI Agent
- Key Takeaways
- From Data Signal to Portfolio Decision
- Frequently Asked Questions
How Fast Is the Gold Coast Property Market Growing?
Gold Coast houses grew 13.9% in the year to June 2026, taking the city’s Typical House Price to $1,744,184. That one-year result sits well above the city’s own long-run trend: 11.1% per annum compounded over three years, 10.9% over five, and 9.6% over ten. In plain terms, the last twelve months ran about four percentage points hotter than the decade average.
Rents did not keep up. The rolling-year median rent reached $932 per week, up 4.7% over the same period — barely a third of the price growth rate. The arithmetic consequence is yield compression: the city-wide gross yield now sits at 2.78% for houses. Vacancy remains tight at 1.50% in June 2026 (up slightly from 1.37% in April), and the market turned over 10,373 house sales in the year — a deep, liquid market by any Australian standard. You can compare vacancy conditions across the country in our suburb-level vacancy rates guide.
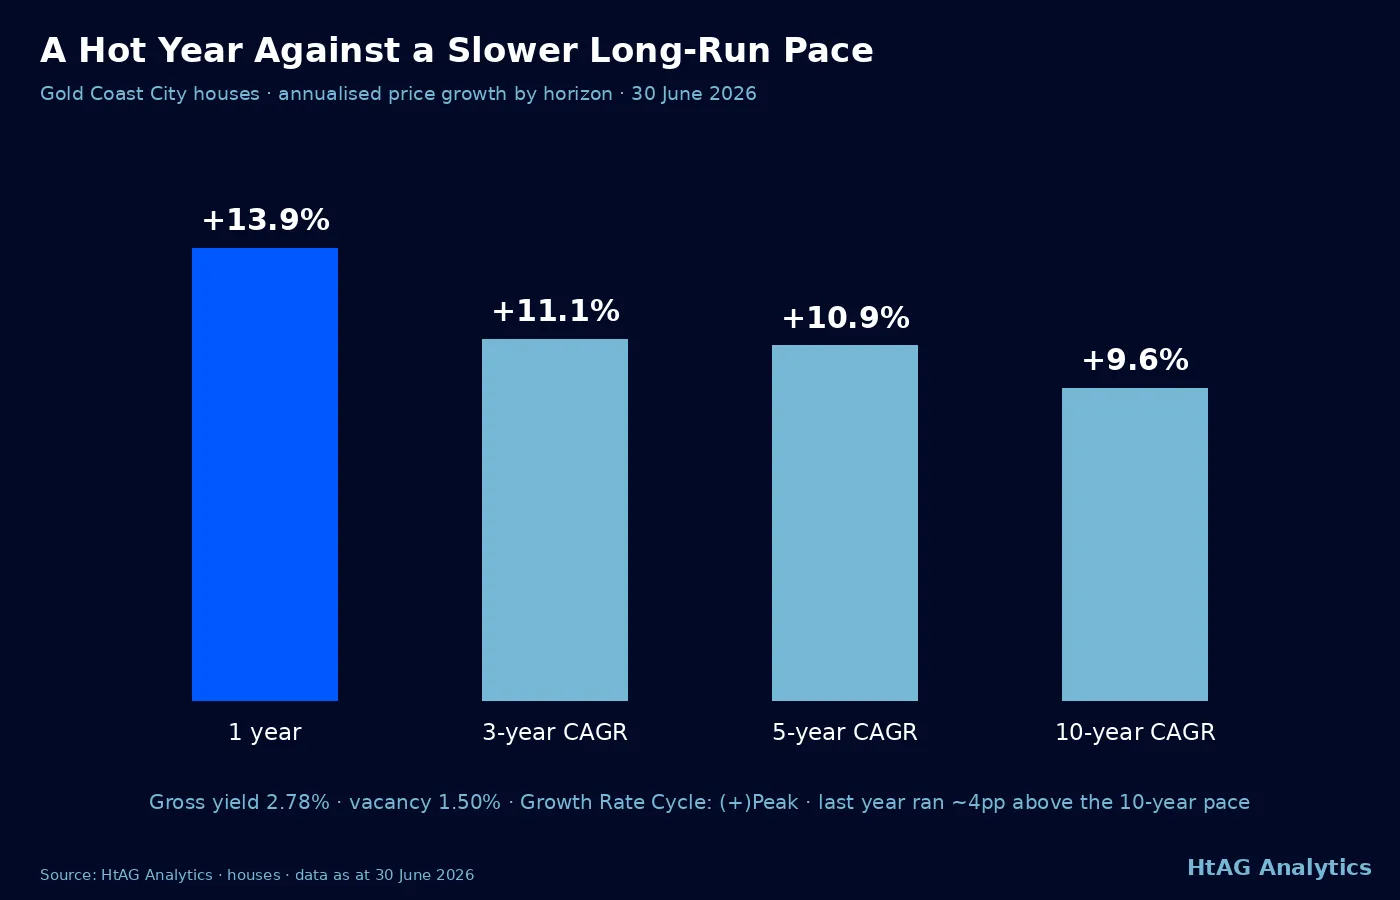
According to HtAG Analytics, the Gold Coast’s Typical House Price grew 13.9% in the year to June 2026 — about four percentage points faster than the city’s own 10-year compound pace of 9.6% per annum.
HtAG Analytics, Gold Coast City house market, June 2026
A quick note on the price measure. HtAG uses Typical Price rather than a raw median because medians whipsaw with the mix of what happened to sell in a given month. If a run of luxury beachfront homes transacts in December, the median jumps; if entry-level stock dominates January, it falls — with no change in underlying values. Our explainer on why median price misleads property investors covers the difference in detail.
Where the Gold Coast Sits in Its Price Cycle
The Gold Coast City house market is currently at (+)Peak on HtAG’s Growth Rate Cycle (GRC) — meaning year-on-year price growth is positive and near the top of its current cycle, rather than accelerating from a low base. The GRC tracks the direction and momentum of price growth itself, which makes it a leading way to see where a market sits without waiting for the headlines to catch up.
A second signal reinforces the late-cycle read. Growth Pattern Deviation (GPD) — which compares a market’s recent growth to its own historical pace over the same window — is positive for Gold Coast City across the 3-year, 5-year and 10-year horizons. A market running above its own long-term trend is a market with less steam left in the tank than one lagging it. That is not a crash prediction; it is a statement about where the risk now sits.
What This Means in Plain English
Think of the Gold Coast as a runner several kilometres into a fast race. It is still moving quickly — 13.9% in a year — but it has been running above its usual training pace for a while now. History says runners like this more often slow toward their normal speed than speed up further. The question for a buyer is no longer “is the Gold Coast growing?” but “which parts of it still offer value after the run it has already had?”
If the phrase “buy whatever grew fastest last year” is forming in your head, our recent five-year study of 3,886 markets on what happens after a property boom is required reading: in the 2021 cohort, the hottest tenth of markets underperformed the coolest tenth by roughly 28 percentage points over the following five years.
A Two-Speed City: Suburb Scores Range From 36 to 91
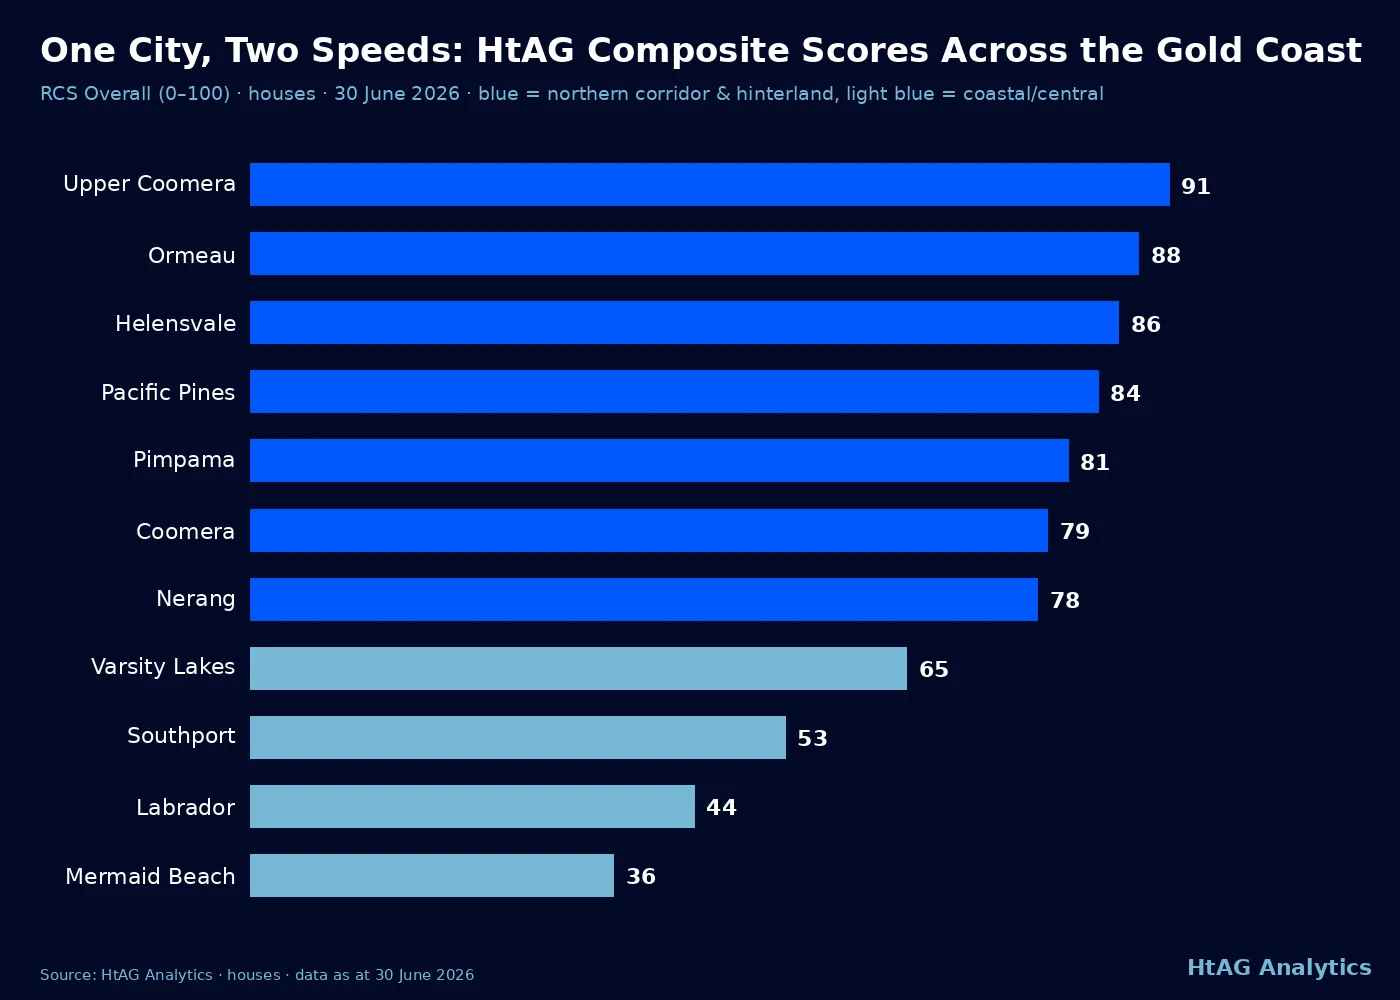
Here is what a city-wide forecast cannot show you. HtAG’s Relative Composite Score (RCS) — a 0–100 composite of Capital Growth, Cashflow and Lower Risk — spans 55 points across the 11 Gold Coast house markets sampled below. The northern growth corridor and hinterland family belt — led by Upper Coomera (91), Ormeau (88) and Helensvale (86) — scores in the 78–91 band. The coastal and central strip — Varsity Lakes (65), Southport (53), Labrador (44) and Mermaid Beach (36) — sits far below.
| Suburb (houses) | Typical Price | 1Y Growth | Gross Yield | RCS Overall | Cycle (GRC) |
|---|---|---|---|---|---|
| Upper Coomera | $1,353,142 | +19.5% | 3.07% | 91 | (+)Peak |
| Ormeau | $1,214,854 | +16.3% | 3.15% | 88 | (+)Peak |
| Helensvale | $1,710,427 | +14.3% | 2.98% | 86 | (+)Peak |
| Pacific Pines | $1,304,703 | +14.8% | 3.32% | 84 | (+)Decreasing |
| Pimpama | $1,206,453 | +17.5% | 2.94% | 81 | (+)Decreasing |
| Coomera | $1,266,977 | +15.2% | 3.10% | 79 | (+)Peak |
| Nerang | $1,340,295 | +14.0% | 3.38% | 78 | (+)Decreasing |
| Varsity Lakes | $1,596,181 | +15.5% | 3.06% | 65 | (+)Peak |
| Southport | $1,589,088 | +14.7% | 2.77% | 53 | (+)Peak |
| Labrador | $1,286,263 | +17.7% | 3.43% | 44 | (+)Decreasing |
| Mermaid Beach | $3,712,075 | +15.1% | 1.88% | 36 | (+)Peak |
Source: HtAG Analytics, houses, data as at 30 June 2026. RCS Overall is HtAG’s Relative Composite Score (0–100) across Capital Growth, Cashflow and Lower Risk. All 11 markets carry High data confidence.
On live HtAG Analytics data as at 30 June 2026, eleven Gold Coast house markets span a 55-point composite-score range — from 91 in Upper Coomera to 36 in Mermaid Beach — despite every one of them growing 14–20% over the same year.
HtAG Analytics, Gold Coast suburb markets, June 2026
Notice what the table does not show: a growth gap. Every market listed grew between 14% and 20% over the year. The divergence is in the composite quality behind the growth — risk, cashflow and forward growth positioning taken together. Labrador grew 17.7% but scores 44, with a volatility index of 9 out of 10; Mermaid Beach grew 15.1% at a $3.7 million price point, yields just 1.88%, and scores 36 with maximum volatility. Southport, the city’s CBD-equivalent, also carries maximum volatility (10/10). Last year’s growth and next cycle’s quality are simply different questions — the same lesson our post-boom study quantified nationally.
What This Means in Plain English
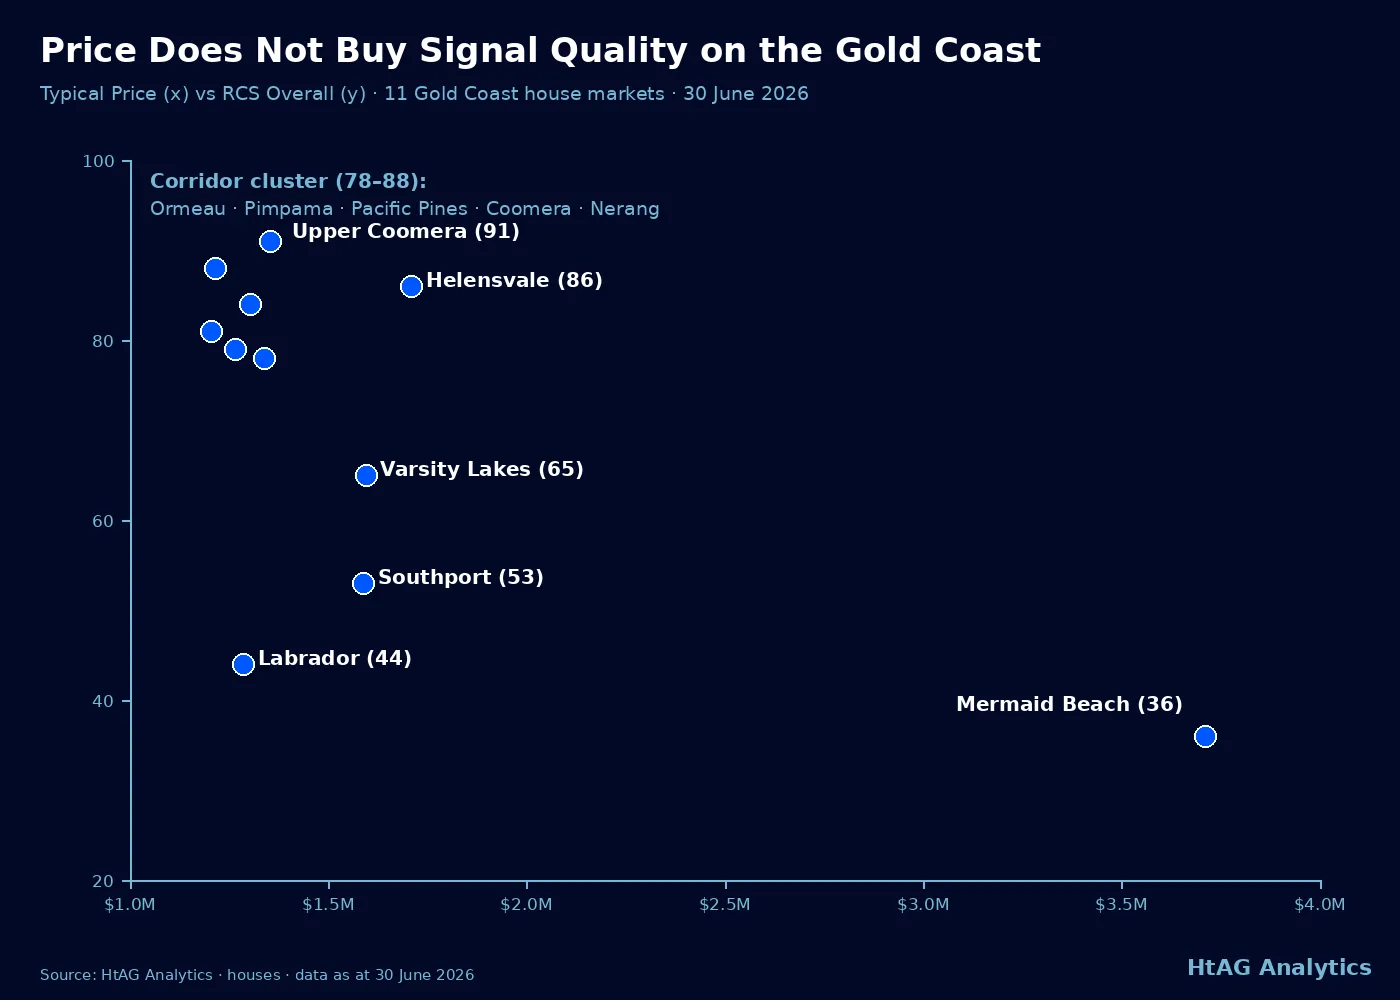
Paying more does not buy you a better investment market. The most expensive suburb in this sample ($3.7M Mermaid Beach) has the weakest composite score, the thinnest rental return and the highest volatility. The strongest scores sit in the $1.2M–$1.7M family belt in the city’s north. Prestige and performance are different products.
One caveat the corridor deserves: its leaders have already run hard. Upper Coomera’s 19.5% year came on top of a five-year compound pace of 14.0% per annum, and its GPD is positive across every window — the corridor is outgrowing its own history, not lagging it. High composite scores describe risk-calibrated quality as at today’s data; they are not an invitation to chase the last year’s winner blindly.
Gold Coast Property Market Forecast: What the Ranges Say
HtAG’s forward model puts Gold Coast City’s projected annual capital growth in a range of −7% to +18%, with rents projected to grow around 2.9% per annum. That range is deliberately wide, and the width is the honest part of the forecast: a market at (+)Peak, running above its own trend, carries genuinely two-sided risk that a single-number prediction hides.
What supports the market: vacancy at 1.50%, a deep sales base of more than 10,000 transactions a year, sustained interstate migration into South East Queensland, and a decade-long compound pace near 10% that reflects structural demand rather than a one-off spike. What works against it: gross yields compressed to 2.78% (and as low as 1.88% beachside), affordability stretched by a $1.74 million entry price, and one-year growth already running about four points above the city’s own decade average.
What This Means in Plain English
A range of −7% to +18% is not the model hedging its bets — it is the model telling you this market can plausibly cool or keep climbing depending on rates, migration and supply. When a forecast range is this wide, suburb selection and entry price do more work than market timing ever will.
How Investors Read a Market Like This
The practical takeaway is not “buy the Gold Coast” or “avoid the Gold Coast” — it is that the city-level question is the wrong unit of analysis. Professional buyers agents working South East Queensland treat the Gold Coast as eleven-plus separate markets and let composite, cycle and risk data arbitrate between them. That is the working definition of Property Intelligence: converting raw market data into scored, ranked, decision-grade signals rather than headline medians.
In practice that means reading the Relative Composite Score against your own strategy (growth, cashflow or risk-first), checking cycle position before paying a peak-of-cycle price, and comparing the Gold Coast against its neighbours rather than in isolation. Our data-led guides to the best suburbs to invest in Queensland and the Brisbane investment suburbs apply the same framework one step north (the Brisbane property market analytics hub holds the full city dataset), and a dedicated South East Queensland 2026 analysis ranks the whole corridor between the two cities. The full suburb-by-suburb picture — including the markets not sampled here — is live on the GeoDex heatmap and the QLD property market directory (which lists every Queensland council area, including Gold Coast City), and our Evidence Portal shows how these signals have performed on past recommendations.
Surface This Data Inside Your AI Agent
Every number in this article came from live HtAG endpoints — and the HtAG Developer Portal exposes the same data through MCP (Model Context Protocol) connectors. Investors and buyers agents using Claude, Perplexity, Manus AI, ChatGPT (via custom connectors) or any other MCP-compatible AI agent can query Gold Coast suburb data — Typical Price, RCS, cycle position, yields, vacancy — directly inside the AI tool they already use.
HtAG’s MCP-enabled Developer Portal puts every metric in this article inside your AI agent. Apply for access and run the full analysis on any Australian suburb without leaving Claude or Perplexity.
HtAG Analytics Developer Portal (2026)
Browse the endpoint catalogue at developer.htagai.com and submit the HtAG Developer Portal application — approved members receive an API key and an MCP setup guide for their preferred AI tool.
Key Takeaways
- Gold Coast houses reached a Typical Price of $1,744,184 in June 2026 — up 13.9% in a year, about four percentage points above the city’s 10-year compound pace of 9.6% per annum.
- The city sits at (+)Peak on HtAG’s Growth Rate Cycle, with Growth Pattern Deviation positive across 3, 5 and 10-year windows — a late-cycle profile, not an early-cycle one.
- Rents ($932/week, +4.7%) did not keep pace with prices, compressing the city-wide gross yield to 2.78%; vacancy remains tight at 1.50%.
- It is a two-speed city: sampled composite scores range from 91 (Upper Coomera) to 36 (Mermaid Beach) — a 55-point spread — even though every sampled market grew 14–20% over the same year.
- HtAG’s forward range for the city is −7% to +18% annual capital growth: wide by design, because a peak-cycle market carries genuinely two-sided risk.
- At this point in the cycle, suburb selection matters more than city selection — the unit of analysis should be the suburb market, not the postcard.
From Data Signal to Portfolio Decision
The Typical Price, RCS, GRC and GPD signals used throughout this forecast are live inside the HtAG Analytics platform — updated as new valuation data flows in. Professional buyers agents use them to time entries, validate briefs and build conviction before making offers on markets exactly like the Gold Coast’s northern corridor.
If you’re building a portfolio and want to see the exact data powering articles like this one, the HtAG Starter Plan gives you access to suburb-level analytics across every Australian market — no lock-in, cancel any time.
Start your HtAG Analytics membership → · Apply for Developer Portal access →
Frequently Asked Questions
What is the typical house price on the Gold Coast in 2026?
The Typical House Price for Gold Coast City reached $1,744,184 as at 30 June 2026 on HtAG Analytics data — up 13.9% over the year. Typical Price is a mix-adjusted measure of the whole housing stock, more stable than a raw sales median, and suburb-level prices in the sample range from $1,206,453 (Pimpama) to $3,712,075 (Mermaid Beach).
Will Gold Coast property prices fall in 2026?
HtAG’s projected annual capital growth range for Gold Coast City houses is −7% to +18% — the market can plausibly cool or keep climbing. The cycle position ((+)Peak) and positive Growth Pattern Deviation say growth is running above the city’s own trend, which historically raises the odds of deceleration toward the long-run pace (9.6% p.a. over 10 years) rather than an outright crash. Vacancy at 1.50% and deep sales volumes argue against a hard fall.
Which Gold Coast suburbs score highest on HtAG data?
As at 30 June 2026, the highest Relative Composite Scores in our 11-market sample were Upper Coomera (91), Ormeau (88) and Helensvale (86) — all in the northern corridor. These are risk-calibrated scores on today’s data, not buy recommendations: the corridor’s leaders have already grown well above their own historical pace, and cycle position should always be read alongside the score.
Why are Gold Coast rental yields so low?
Because prices outran rents. In the year to June 2026, Gold Coast house prices grew 13.9% while rents grew 4.7%, compressing the city-wide gross yield to 2.78%. The spread is wide within the city: Labrador and Nerang yield around 3.4%, while Mermaid Beach yields just 1.88% at its $3.7 million Typical Price.
How do I access HtAG Gold Coast data inside Claude or Perplexity?
Through the HtAG Developer Portal’s MCP connectors. Browse the endpoint catalogue at https://developer.htagai.com/ and submit the application form at https://links.htag.com.au/widget/form/GFVegAaXzeTUH7QzRl1T. Approved members receive an API key and an MCP setup guide, letting Claude, Perplexity, Manus AI or ChatGPT query live Gold Coast suburb data — Typical Price, RCS, cycle position, yields and vacancy — inside the conversation.
Citation
Gold Coast City house market, HtAG Analytics data as at 30 June 2026: Typical Price $1,744,184 (+13.9% YoY); gross yield 2.78%; vacancy 1.50%; Growth Rate Cycle (+)Peak; sampled suburb RCS Overall range 36–91.
Suggested citation: HtAG Analytics, Gold Coast property market forecast — suburb-level composite and cycle data, June 2026.
The conceptual framework behind the metrics in this article is published openly for transparency and education. Their proprietary implementation — calibration, weighting, validation and the underlying data — remains the confidential intellectual property of HtAG Analytics.
This article is general information only and does not constitute financial or investment advice. Property markets carry risk; past growth is not a guarantee of future performance. Always conduct independent due diligence and seek professional advice appropriate to your circumstances before making investment decisions.
This article forms part of the HtAG Property Intelligence Reference Library — a structured knowledge base documenting the concepts, metrics and methodologies used to analyse Australian residential property markets. Reference Standard PI-TWOSPEEDCITY · Version 1.0