


Short Summary
Equity recycling lets you fund your next investment property by borrowing against the growth in one you already own — without selling. This guide explains how much equity you can release, then shows the part most articles skip: how to screen the suburb you redeploy into using HtAG Analytics signals (Growth Rate Cycle, GPD, GSP and the Relative Composite Score). Powered by live HtAG house data across four Australian suburbs, period end 31 May 2026.
Most Australian investors who own a second or third property never saved a fresh deposit for it. They recycled equity — borrowing against the rising value of a property they already held. It is the quiet engine behind most multi-property portfolios. But pulling equity is the easy half. The half that decides your return is where you put it next.
Equity recycling means borrowing against the increased value of a property you already own to fund the deposit on your next one — without selling. In Australia you can typically access up to 80% of a property’s value minus what you still owe. The harder question is which suburb deserves that capital, and whether it still has growth ahead.
In 30 Seconds
What is it? Using the equity built up in a property you own as the deposit for your next purchase, instead of selling or saving cash.
Why does it matter? It lets you keep growing assets compounding while you buy more — but only works if the next suburb actually grows.
Who uses it? Investors adding a second-plus property, and the buyers agents who plan their acquisition sequence.
Use it on its own? No. Releasing equity is a finance step; the decision that sets your return is which suburb you redeploy into — that needs market data.
Table of Contents
- What is equity recycling?
- How to use equity to buy your next property: 5 steps
- How much equity can you actually use?
- The part most guides skip: where you redeploy
- Worked example: four redeploy candidates, read through the data
- Equity recycling risks (and the equity buffer)
- Surface this data inside your AI agent
- From data signal to portfolio decision
- Key takeaways
- Frequently asked questions
What is equity recycling?
Equity recycling is the practice of borrowing against the usable equity in an existing property to fund the deposit and costs on your next investment, rather than selling the asset or saving new cash. Your usable equity is roughly 80% of the property’s current value minus the balance you still owe.
The appeal is compounding. You keep the first asset — and its future growth and rent — while a slice of its equity becomes the deposit for a second. Done repeatedly, it is how a single property becomes a portfolio. Investor demand for this play is structural: the Australian Bureau of Statistics reported that investors made up a record share of new housing lending through late 2025, with investor loan commitments still elevated into the March quarter of 2026.
But equity is only a permission slip to borrow. It says nothing about whether the suburb you buy next will grow. That is the gap this guide closes, using live data from HtAG’s property intelligence platform.
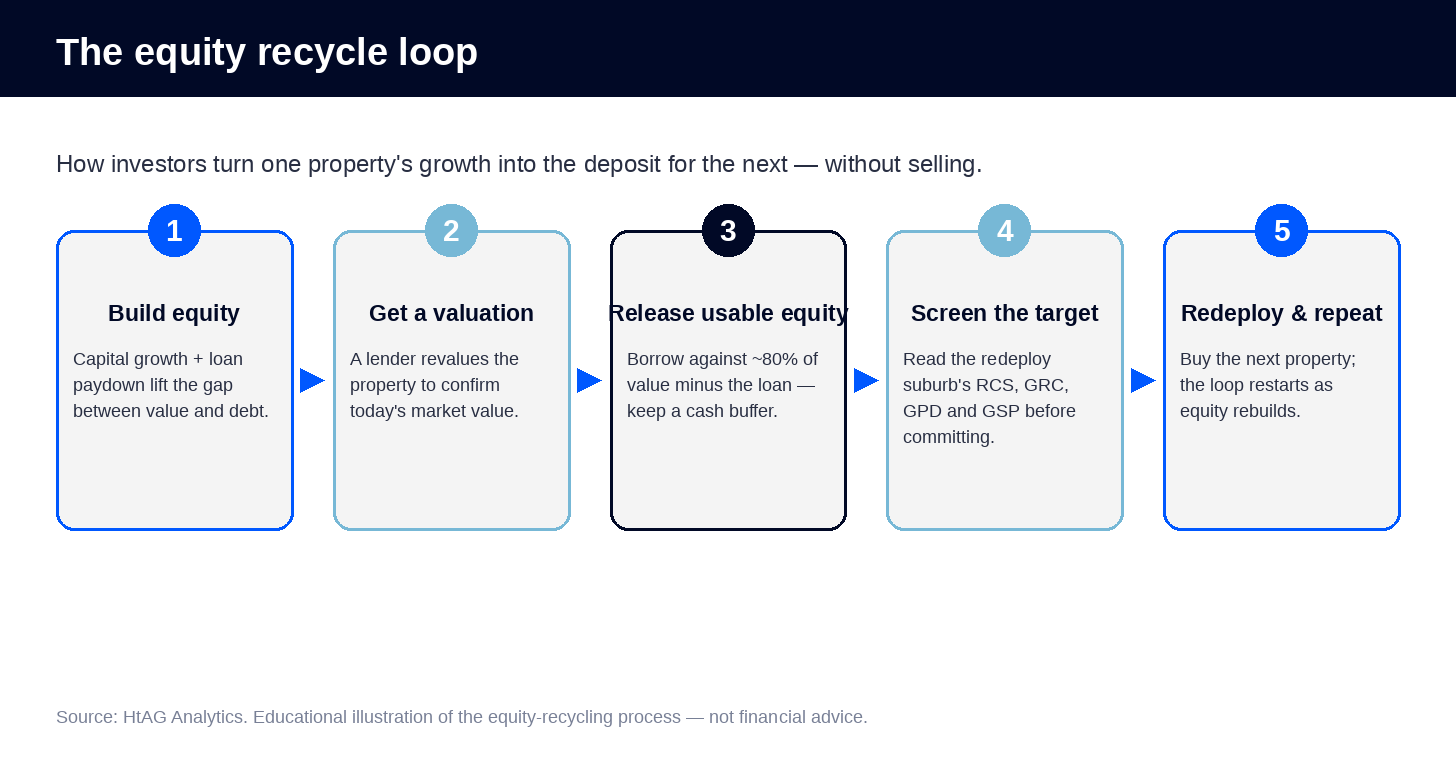
How to use equity to buy your next property: 5 steps
Using equity to buy your next investment property follows five steps: build equity, get a valuation, release usable equity (keeping a buffer), screen the target suburb, then redeploy and repeat.
- Build equity. Capital growth plus loan paydown widen the gap between your property’s value and its debt. That gap is your raw equity.
- Get a valuation. A lender revalues the property to confirm today’s market value — the number every later calculation depends on.
- Release usable equity. Borrow against about 80% of the valuation minus your current loan, typically via a loan top-up or a separate equity-release split. Keep a cash buffer back.
- Screen the target suburb. Before committing the funds, read the candidate suburb’s cycle position and scores — this is the step that separates a good redeploy from an expensive one.
- Redeploy and repeat. Use the released equity as the deposit and costs on the next property. As that asset and the original both grow, the loop restarts.
How much equity can you actually use?
Your usable equity is generally 80% of the property’s current value minus the loan you still owe — not the full difference between value and debt. Lenders hold back the top 20% as a buffer, and borrowing above 80% usually triggers Lenders Mortgage Insurance.
Here is the calculation on an illustrative property valued at $800,000 with a $400,000 loan:
| Step | Amount |
|---|---|
| Current property value (lender valuation) | $800,000 |
| Lender lending ceiling (80% of value) | $640,000 |
| Less current loan balance | −$400,000 |
| Usable equity released | $240,000 |
| Recommended cash buffer to retain | Keep a portion in reserve |
Source: HtAG Analytics. Illustrative calculation only — your borrowing capacity, lender policy and costs will differ.
In this example, $240,000 of usable equity could cover the deposit and purchase costs on a meaningful next property at a 20%-deposit, costs-included structure. But two investors with the identical $240,000 can end up with wildly different results — because the suburb they choose, not the size of the cheque, drives the outcome.
According to HtAG Analytics, equity tells you how much you can borrow — it can’t tell you whether the suburb you redeploy into still has growth ahead.
The part most guides skip: where you redeploy
The redeploy decision has two questions, and both are data questions: when to pull the equity, and where to put it. HtAG’s signals answer each directly.
When: read the cycle before you borrow
The property market cycle matters because pulling equity at a peak and redeploying into another peak doubles your exposure to a downswing. HtAG’s Growth Rate Cycle (GRC) tags where a suburb sits — for instance a (+)Peak reading flags a market whose growth has topped, while (+)Decreasing signals positive but decelerating growth.
What This Means in Plain English
Think of the Growth Rate Cycle like a clock for prices. You don’t want to release equity from a property at the top of its clock and buy another one that’s also at the top — that’s two markets that could cool at once. Spreading across different cycle positions is steadier.
Where: screen the target with the metric stack
For the destination suburb, four HtAG signals do the heavy lifting. Each answers a question a familiar postcode can’t:
- Relative Composite Score (RCS) — a 0–100 score blending Capital Growth, Cashflow and Lower Risk, so you can compare a suburb’s overall quality at a glance.
- Growth Pattern Deviation (GPD) — compares a suburb’s recent growth to its own long-run pace. A negative reading flags room to grow; a strongly positive one flags a market running hot versus its history.
- Growth Spillover Effect (GSP) — compares a suburb’s growth to its surrounding LGA. A negative or near-zero reading points to early-cycle, catch-up potential.
- Typical Price and Years to Own — a robust central price and an affordability read, so you anchor the decision to a real entry point rather than a noisy median.
Read together, these turn “I know that area” into “this suburb scores well on growth, isn’t over-extended versus its own history, and still lags its LGA.” That is a redeploy thesis you can defend.
Worked example: four redeploy candidates, read through the data
To show how the stack changes a decision, here are four Australian house markets an investor might consider redeploying equity into — pulled live from HtAG, houses, period end 31 May 2026. On price and familiarity alone they look interchangeable. On the data they are not.
| Suburb (houses) | Typical Price | Gross Yield | GRC phase | Capital-Growth RCS | Overall RCS |
|---|---|---|---|---|---|
| St Marys, NSW | $1,226,880 | 2.5% | (+)Peak | 21 | 32 |
| Morayfield, QLD | $1,088,695 | 2.9% | (+)Decreasing | 35 | 74 |
| Davoren Park, SA | $741,658 | 3.4% | (+)Decreasing | 17 | 39 |
| Coolbellup, WA | $1,027,595 | 3.6% | (+)Decreasing | 81 | 73 |
Source: HtAG Analytics MCP (get_market_summary, get_market_scores, get_market_cycle), houses, period end 31 May 2026. RCS = Relative Composite Score.
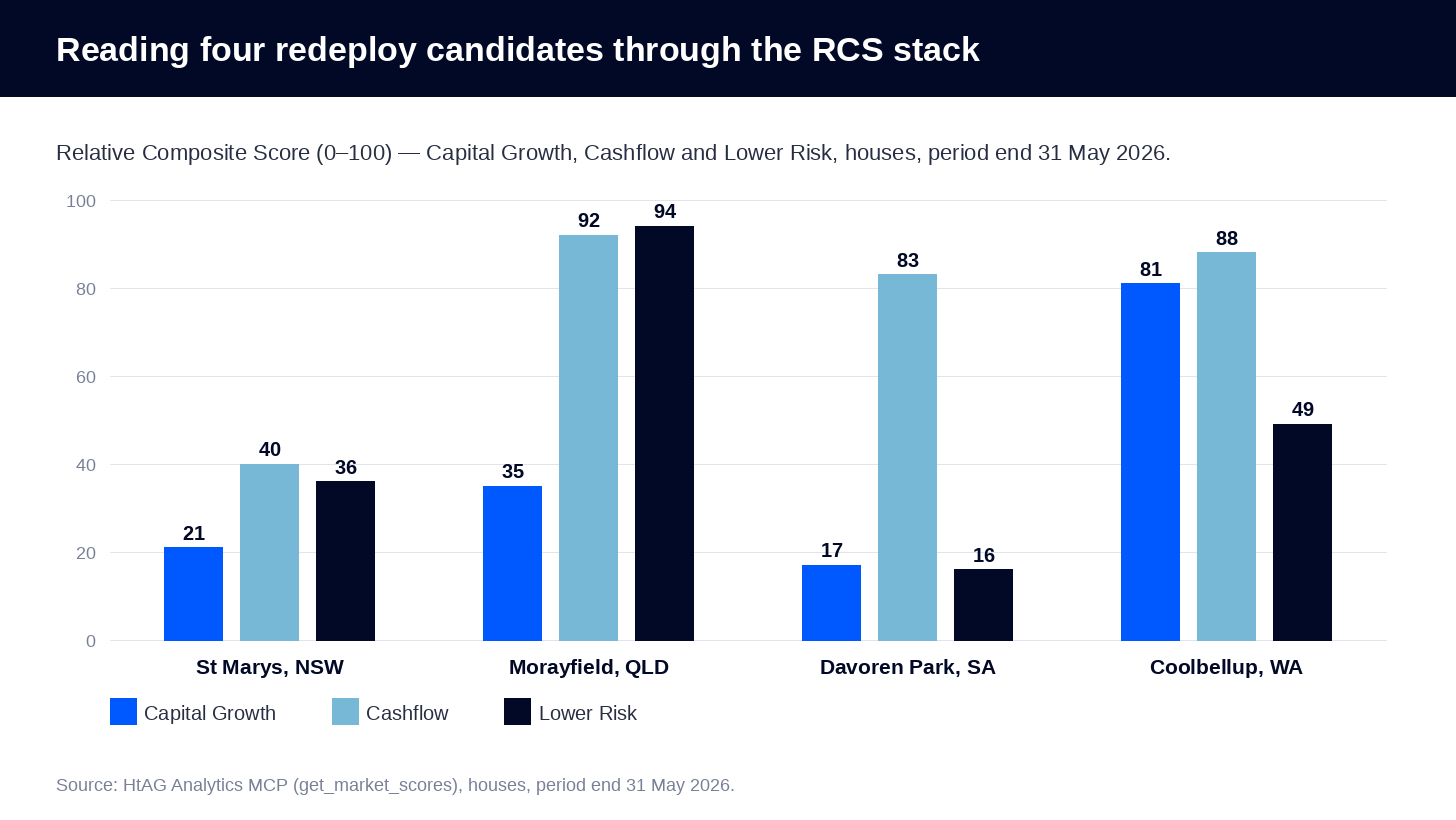
St Marys is the trap that familiarity sets. It is the most expensive of the four, yields the least at 2.5%, sits at a (+)Peak in its cycle, and carries the lowest capital-growth score (21) and overall RCS (32) in the group. An investor who recycles equity here simply because they “know Western Sydney” is buying a late-cycle, low-yield asset.
Davoren Park is the opposite trap: the cheapest entry ($741,658) and a healthy 3.4% yield, which looks like value. But its capital-growth RCS is just 17 and its lower-risk score is weak — a pattern HtAG has documented before, where cheap suburbs can deliver poor returns. Price is not a strategy.
Coolbellup is the standout on the data: the highest capital-growth RCS (81), the strongest yield (3.6%), and a Growth Spillover Effect near zero — meaning it still lags its wider LGA and may have catch-up ahead. Morayfield sits in between: excellent cashflow and low-risk scores, but with its growth steam largely spent versus its own history.
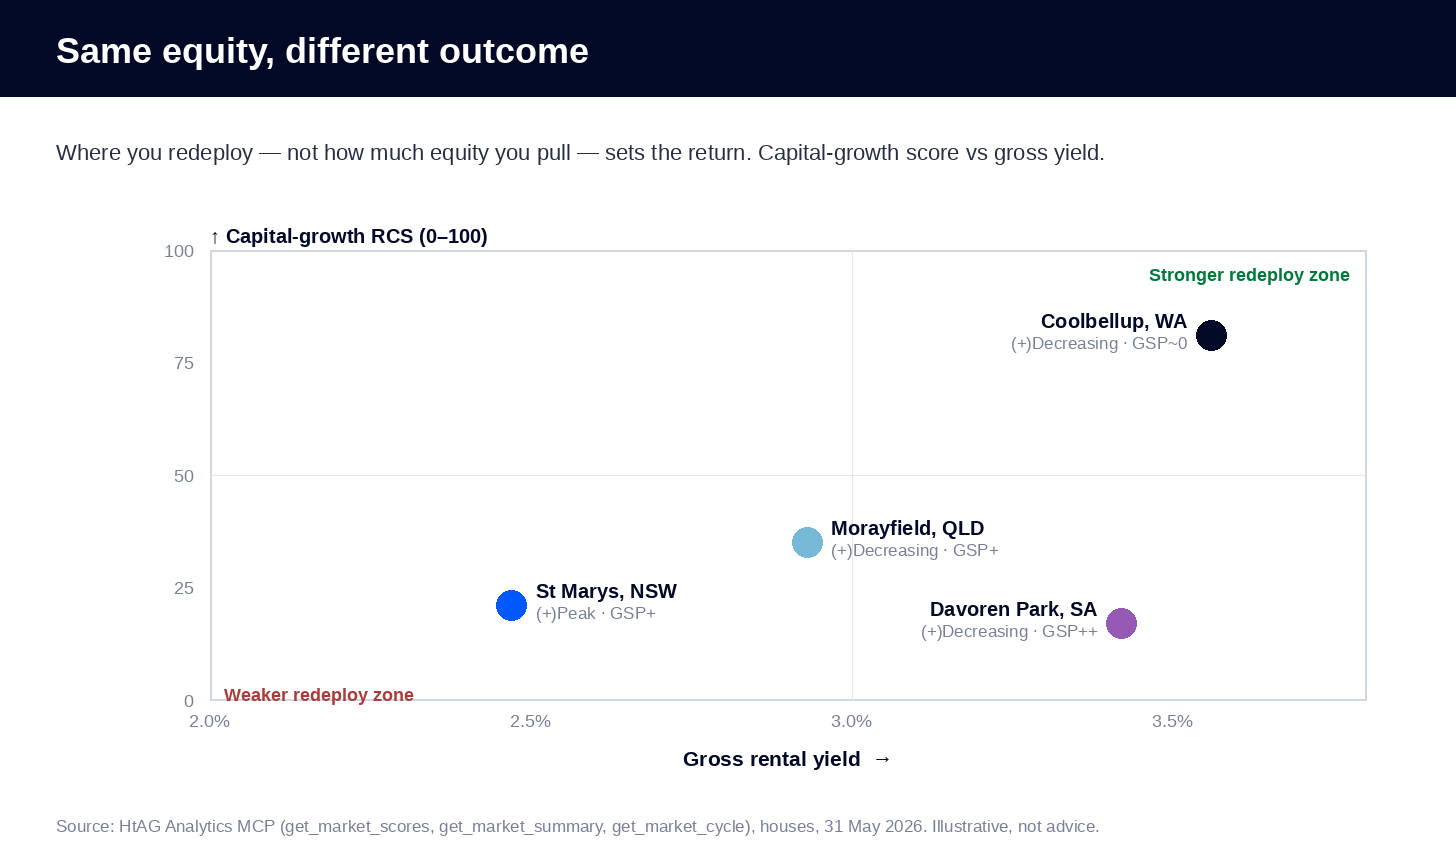
What This Means in Plain English
All four suburbs cost roughly the same to buy into, give or take. But the data says one is near the top of its run with thin rent, while another still scores well for future growth and pays better rent today. The size of your equity cheque is the same in every case — the suburb is what changes your result.
Across the four houses HtAG analysed for this article, the cheapest suburb carried the lowest capital-growth score — proof that price alone is a poor guide to a redeploy decision.
This is the same screening discipline behind building a property portfolio — applied to a single redeploy decision. You can compare suburbs like these across thousands of markets with the Dex suburb ranking or visually on the GeoDex heatmap.
Equity recycling risks (and the equity buffer)
The main risk of equity recycling is over-leverage: borrowing against one property to buy another stacks debt across your whole position, and a downturn can hit every property at once. The Reserve Bank of Australia’s May 2026 Bulletin noted that around one-third of investor households carry leverage on both their investment and owner-occupier properties, and warned that resilience is undermined when a portfolio is highly geared with little equity cushion.
- Keep a buffer. Don’t release every last dollar to 80%. Retaining a cash reserve protects you against rate rises and vacancies.
- Don’t double your cycle risk. Avoid redeploying peak-cycle equity into another peak-cycle market — check the GRC phase first.
- Stress-test serviceability. The new loan must be serviceable at higher rates, not just today’s.
- Mind the structure. Equity-release and tax treatment vary; get specific advice from your broker and accountant.
What This Means in Plain English
Recycling equity is borrowing to invest, twice over. It magnifies good outcomes and bad ones. The safety valve is simple: keep some equity and cash in reserve, and make sure the next suburb is genuinely strong — not just familiar or cheap.
Surface this data inside your AI agent
The HtAG Developer Portal now exposes the data described in this article — and every other HtAG dataset — through MCP (Model Context Protocol) connectors. Investors and buyers’ agents using Claude, Perplexity, Manus AI, ChatGPT (via custom connectors) or any other MCP-compatible AI agent can query HtAG data directly inside the AI tool they already use — including the RCS, GRC, GPD and GSP signals you would use to screen a redeploy suburb.
HtAG’s MCP-enabled Developer Portal puts every metric in this article inside your AI agent. Apply for access and run the full analysis on any Australian suburb without leaving Claude or Perplexity.
HtAG Analytics Developer Portal (2026)
Browse the endpoint catalogue at developer.htagai.com and submit the HtAG Developer Portal application — approved members receive an API key and an MCP setup guide for their preferred AI tool.
From data signal to portfolio decision
The RCS, GRC, GPD and GSP signals used to screen the four suburbs above are live inside the HtAG Analytics platform — updated each quarter as new valuation data flows in. Professional buyers agents use them to decide not just when to release equity, but exactly which market deserves it.
If you’re planning to recycle equity and want to see the exact data powering articles like this one, the HtAG Starter Plan gives you suburb-level analytics across every Australian market — no lock-in, cancel any time. You can also validate the evidence behind HtAG’s signals in the Evidence Portal.
Start your HtAG Analytics membership → · Apply for Developer Portal access →
Key takeaways
- Equity recycling funds your next deposit without selling — by borrowing against the growth in a property you already own.
- Usable equity is about 80% of value minus your loan — keep a buffer back rather than drawing to the limit.
- The redeploy suburb decides your return, not the cheque size. Two investors with identical equity get different outcomes depending on where they buy.
- Screen the target with HtAG’s stack: RCS for overall quality, GRC for cycle timing, GPD for room-to-grow, GSP for early-cycle catch-up.
- Across HtAG’s four houses (31 May 2026), Coolbellup WA scored a capital-growth RCS of 81 and the cheapest, Davoren Park SA, just 17 — price is a poor guide to a redeploy decision.
- Mind leverage. The RBA flags that highly geared investor portfolios with thin equity cushions are the most fragile in a downturn.
Frequently asked questions
How much equity do I need to buy a second investment property?
As a rule of thumb, you need enough usable equity to cover a 20% deposit plus purchase costs (roughly 5%) on the next property, so it avoids Lenders Mortgage Insurance. Usable equity is about 80% of your current property’s value minus the loan you still owe. On an $800,000 property with a $400,000 loan, that’s around $240,000 of usable equity.
Is it better to use equity or a cash deposit?
Equity lets you keep your existing assets compounding while you buy more, rather than waiting years to save a fresh deposit — which is why most multi-property investors use it. The trade-off is higher total leverage, so a cash buffer and a genuinely strong target suburb matter more, not less. The decision should rest on the redeploy suburb’s data, not just on which funding source is available.
How do I choose the right suburb to redeploy equity into?
Screen candidates on four HtAG signals: the Relative Composite Score (overall quality), the Growth Rate Cycle (where the market sits in its cycle), Growth Pattern Deviation (room to grow versus its own history) and Growth Spillover Effect (early-cycle catch-up versus its LGA). In HtAG’s 31 May 2026 data, Coolbellup WA scored a capital-growth RCS of 81 versus 21 for St Marys NSW — despite similar prices.
How do I access HtAG equity and suburb data inside Claude or Perplexity?
HtAG’s data is available to AI agents through the HtAG Developer Portal via MCP (Model Context Protocol). Browse the endpoint catalogue at developer.htagai.com and apply for access using the HtAG Developer Portal application form. Approved members can query the RCS, GRC, GPD and GSP signals for any Australian suburb directly inside Claude, Perplexity, Manus AI or any MCP-compatible agent.
The conceptual framework behind these metrics is published openly for transparency and education. Their proprietary implementation — calibration, weighting, validation and the underlying data — remains the confidential intellectual property of HtAG Analytics.
This article forms part of the HtAG Property Intelligence Reference Library — a structured knowledge base documenting the concepts, metrics and methodologies used to analyse Australian residential property markets. Reference Standard PI-EQUITY · Version 1.0.
Disclaimer: This article is for educational purposes only and does not constitute financial, tax, credit or legal advice. Property investment and borrowing carry risks, and past performance is not indicative of future results. All prices, yields, scores and projections are derived from historical data and statistical modelling — they are not guarantees of future performance. Always conduct your own due diligence and consult a qualified financial adviser, mortgage broker and accountant before making investment or borrowing decisions.


