


Short Summary
Property data for buyers agents is the layered information stack — market signals, cycle position and risk-calibrated scores — that turns 15,000+ Australian suburbs into one defensible buy recommendation. This guide maps the five-layer stack a professional buyers agent needs, shows a live HtAG Analytics worked example for Frankston, VIC, and explains why a data-driven workflow beats tab-hopping across portals.
In 30 Seconds
What is it? The set of suburb-level data a buyers agent uses to choose, justify and time a purchase — from price and yield to cycle and risk.
Why does it matter? Your recommendation has to hold up when a client (or their accountant) asks “why this suburb?” Good data makes that answer defensible.
Who uses it? Buyers agents, and increasingly the AI agents they run research through.
Use it on its own? No — the value is in the stack. One metric in isolation misleads; the layers together build conviction.
Property data for buyers agents is the layered intelligence stack that converts thousands of Australian suburbs into a single, defensible buy recommendation. For a professional buyers agent, “data” is not one number on a portal — it is a sequence of signals (price, yield, supply, demand, cycle and risk) that, read together, answer the only question a client really cares about: is this the right suburb, at the right time, for my goal?
This guide maps the complete data stack a buyers agent needs in 2026, completing the HtAG professional-data series alongside our companion pieces on property data for mortgage brokers and property data for sales agents. We will show you exactly what a buyers agent sees in a single HtAG Analytics pull, using a live example, and where each layer fits.
Table of Contents
- What property data do buyers agents actually need?
- The buyers agent data stack: five layers
- Typical Price vs median price: the layer that protects your client
- Turning data into a defensible recommendation
- Manual research vs a data-driven workflow
- Surface this data inside your AI agent
- From data signal to portfolio decision
- Key takeaways
- Frequently asked questions
What property data do buyers agents actually need?
A buyers agent needs six categories of suburb-level data: price and rent, yield and cashflow, supply and demand, the market cycle position, risk, and a composite score that ties them together. According to HtAG Analytics, these are tracked quarterly across more than 15,000 Australian localities and all 537 local government areas — the universe a buyers agent must be able to filter quickly.
The mistake most newcomers make is treating a single figure — usually the median price — as the answer. It is not. A median tells you what sold, not what a home is worth, and it says nothing about whether the suburb is early or late in its cycle, whether supply is tightening, or how much risk sits under the headline growth number.
A buy recommendation is only as defensible as the data stack behind it. One metric builds an opinion; the full stack builds conviction.
HtAG Analytics (2026)
This is why the discipline of property research has shifted from collecting numbers to reading them in layers. The framework that does this is property intelligence — the layer that converts raw property data into scored, ranked, decision-grade signals a person or an AI agent can act on directly.
The buyers agent data stack: five layers
The buyers agent data stack has five layers: the suburb universe, market signals, cycle and deviation, a risk-calibrated score, and the recommendation. Each layer narrows the field — from 15,000-plus suburbs down to the handful that fit a client’s brief, budget and risk appetite.

Layer 1 — The universe
Coverage comes first. If your data only spans the capitals, you miss the regional and outer-metro markets where many client briefs are actually won. HtAG tracks every Australian suburb, refreshed quarterly, so the starting field is national, not cherry-picked.
Layer 2 — Market signals
This is the headline layer: Typical Price, rent, gross yield, sales and rental volumes, vacancy, days on market, and the balance of supply and demand. These tell you what the market is doing right now. On their own they describe; they do not yet decide.
Layer 3 — Cycle and deviation
The third layer adds timing. The Growth Rate Cycle (GRC) shows whether price growth is accelerating or decelerating. Growth Pattern Deviation (GPD) compares a suburb’s recent growth to its own typical pace, and Growth Spillover Effect (GSP) compares it to its surrounding LGA. Together they separate a market with room to run from one that is running hot.
What This Means in Plain English
Layer 3 answers “am I early or late?” If a suburb has been growing more slowly than its own history and more slowly than its neighbours, it may have catch-up potential. If it has sprinted past both, the easy gains may already be gone.
Layer 4 — The risk-calibrated score
The fourth layer compresses everything into a single, comparable number. The Relative Composite Score (RCS) blends Capital Growth, Cashflow and Lower Risk into a 0–100 score, so a buyers agent can rank very different suburbs on a like-for-like basis without re-reading a dozen charts for each.
Layer 5 — The recommendation
The final layer is the deliverable: a ranked shortlist a client can act on, with the reasoning attached. This is where the stack earns its fee — not in the raw data, but in the defensible decision it produces.
Typical Price vs median price: the layer that protects your client
Typical Price is a robust central price that resists the distortion a median suffers when the mix of sold homes changes. According to HtAG Analytics, relying on a raw median can mislead a buyer in any quarter where a suburb happens to sell more high-end or low-end stock than usual — the median jumps or drops without the underlying market moving at all.
For a buyers agent, this matters at the negotiating table. If your offer logic is anchored to a wobbly median, a sharp selling agent will pick it apart. Anchoring to a robust central price — and explaining why — is the difference between a number you can defend and one you cannot. We cover the mechanics in detail in our explainer on why median price is an unreliable metric.
According to HtAG Analytics, Typical Price is engineered to stay stable when the median is being pushed around by sales mix — so your offer logic holds up under scrutiny.
HtAG Analytics (2026)
Turning data into a defensible recommendation
A defensible recommendation reads the whole stack at once. To show what that looks like in practice, here is a live HtAG Analytics pull for Frankston, VIC (houses), for the quarter ending 31 May 2026 — the exact view a buyers agent would open before shortlisting it.
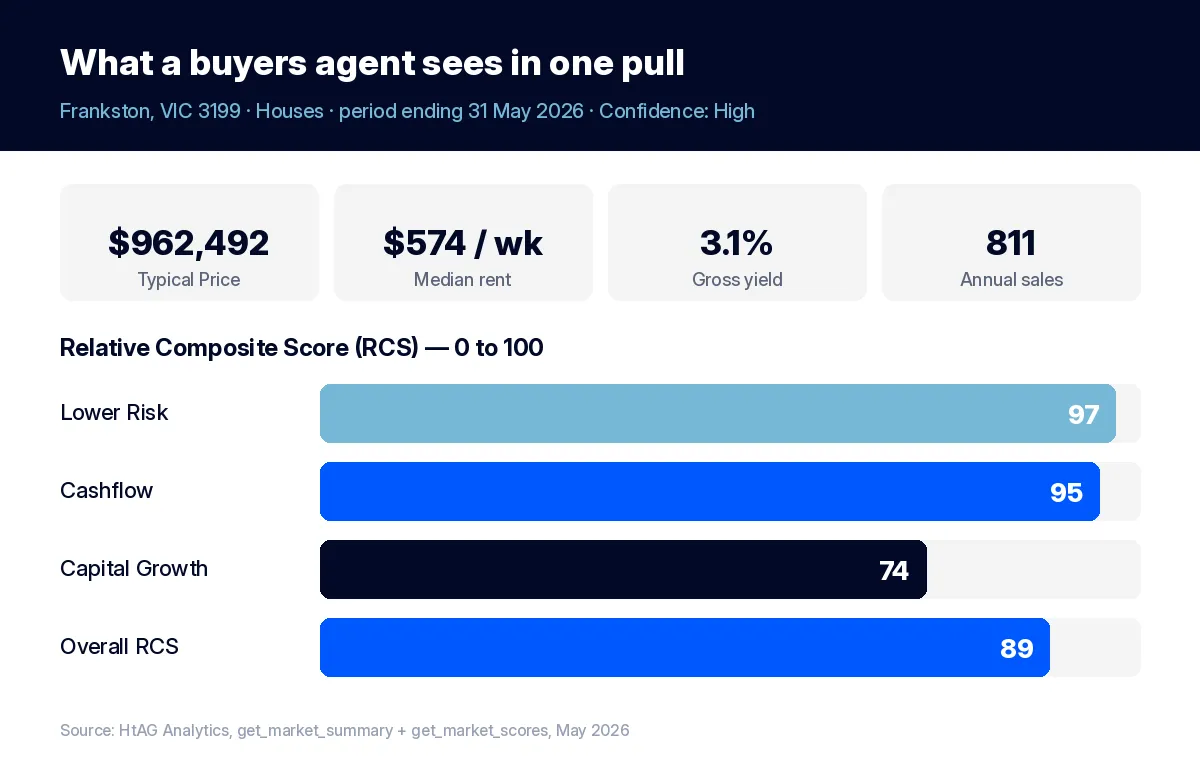
In one view, Frankston houses show a Typical Price of $962,492, a median rent of $574 per week (a gross yield of 3.1%), and 811 sales over the year — a liquid market with a High confidence rating. The risk-calibrated scores then add the judgement layer.
| Data point | Frankston, VIC (houses) | What it tells a buyers agent |
|---|---|---|
| Typical Price | $962,492 | A robust anchor for offer logic, not a mix-skewed median. |
| Gross yield | 3.1% | Cashflow context for the client’s holding strategy. |
| RCS — Lower Risk | 97 | Very low relative risk versus the national field. |
| RCS — Cashflow | 95 | Strong income characteristics relative to peers. |
| RCS — Capital Growth | 74 | Solid growth profile — the value tilt to interrogate. |
| RCS — Overall | 89 | A single comparable score to rank against other shortlisted suburbs. |
Source: HtAG Analytics, market summary and market scores for Frankston, VIC (houses), quarter ending 31 May 2026.
What This Means in Plain English
An overall RCS of 89 with Lower Risk at 97 and Cashflow at 95 says this is a low-risk, income-friendly market; the Capital Growth score of 74 is the part a buyers agent would dig into next — checking the cycle layer to see how much growth may be left. The number doesn’t make the decision; it tells you where to look.
That is the whole point of the stack. The scores do not replace the buyers agent’s judgement — they direct it, so every minute is spent interrogating the one or two figures that actually matter for the brief.
Manual research vs a data-driven workflow
A data-driven workflow is faster, more consistent and more defensible than tab-hopping across portals. Manual research forces a buyers agent to stitch a story together from four or five sources, lean on a mix-skewed median, and rely on gut feel for risk — a process that is slow per suburb and hard to repeat across a brief.
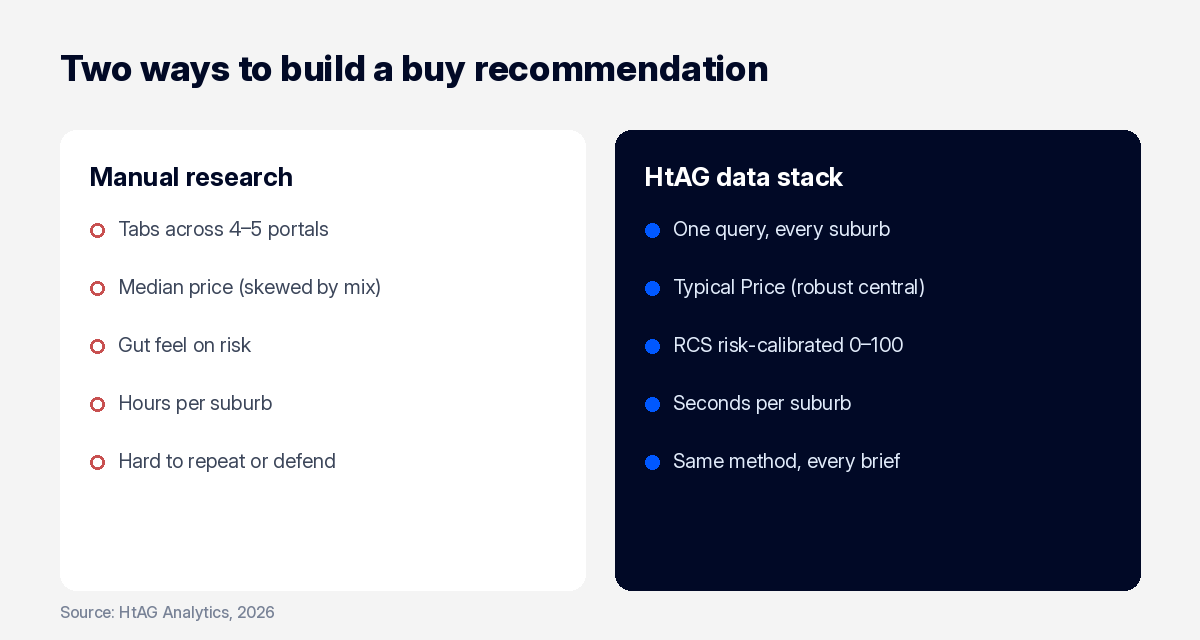
The structural advantage is consistency. When every brief runs through the same stack — same metrics, same scoring, same thresholds — your recommendations become comparable and your process becomes auditable. That is also what makes a buyers agency scalable: a junior using the stack produces work a principal can stand behind. For the deeper research process, see our guide to buyers agent suburb research, and use the GeoDex heatmap to scan whole regions at a glance.
Every recommendation HtAG surfaces is also validated in the open. Our Evidence Portal documents how past signals played out, so a buyers agent can show a client not just what the data says today, but how the methodology has tracked over time.
Surface this data inside your AI agent
The HtAG Developer Portal now exposes the data described in this article — and every other HtAG dataset — through MCP (Model Context Protocol) connectors. Buyers agents using Claude, Perplexity, Manus AI, ChatGPT (via custom connectors) or any other MCP-compatible AI agent can query HtAG data directly inside the tool they already use, instead of re-keying numbers from a dashboard.
HtAG’s MCP-enabled Developer Portal puts every metric in this article inside your AI agent. Apply for access and run the full suburb stack on any Australian listing without leaving Claude or Perplexity.
HtAG Analytics Developer Portal (2026)
Browse the endpoint catalogue at developer.htagai.com and submit the HtAG Developer Portal application — approved members receive an API key and an MCP setup guide for their preferred AI tool. It is the same data stack, surfaced as AI-native property intelligence.
From data signal to portfolio decision
The Typical Price, GRC, GPD, GSP and RCS signals described in this article are live inside the HtAG Analytics platform — updated each quarter as new valuation data flows in. Professional buyers agents use these layers to filter the field, validate briefs, and build conviction before making an offer.
If you are building client shortlists and want the exact data powering articles like this one, the HtAG Starter Plan gives you suburb-level analytics across every Australian market — no lock-in, cancel any time.
Start your HtAG Analytics membership → · Apply for Developer Portal access →
Key takeaways
- Data is a stack, not a number. Buyers agents need price, yield, supply and demand, cycle position, risk and a composite score — read together, not in isolation.
- Coverage first. HtAG tracks 15,000+ localities and all 537 LGAs quarterly, so the starting field is national rather than capital-city only.
- Typical Price beats the median. A robust central price gives offer logic that holds up at the negotiating table when sales mix distorts the median.
- RCS makes suburbs comparable. In the Frankston example, an overall RCS of 89 (Lower Risk 97, Cashflow 95, Capital Growth 74) lets you rank very different markets on one scale.
- A consistent workflow scales an agency. Same metrics, same scoring, every brief — auditable, repeatable, defensible.
- Developer Portal access. The stack is available through MCP connectors — apply for Developer Portal access to query HtAG inside Claude, Perplexity, Manus AI or any MCP-compatible AI agent.
Frequently asked questions
What property data do buyers agents use?
Buyers agents use suburb-level data across six categories: price and rent, yield and cashflow, supply and demand, market-cycle position, risk, and a composite score. According to HtAG Analytics, these are tracked quarterly across 15,000+ Australian localities and all 537 LGAs, so an agent can filter the national field down to a client’s brief.
Is median price reliable for buyers agents?
Not on its own. A median reflects the mix of homes that happened to sell, so it can move sharply without the market changing. HtAG Analytics uses Typical Price — a robust central price — so offer logic stays defensible when sales mix distorts the median.
What is the RCS a buyers agent sees?
The Relative Composite Score (RCS) is HtAG’s 0–100 score blending Capital Growth, Cashflow and Lower Risk into one comparable number, so a buyers agent can rank very different suburbs like-for-like. In our worked example, Frankston, VIC houses scored an overall RCS of 89 for the quarter ending May 2026.
How do I access HtAG buyers agent data inside Claude or Perplexity?
HtAG data is available through MCP (Model Context Protocol) connectors to any compatible AI agent — Claude, Perplexity, Manus AI, and others. Browse the endpoint catalogue at developer.htagai.com and submit the HtAG Developer Portal application. Approved applicants receive an API key and a setup guide.
The conceptual framework behind this data stack is published openly for transparency and education. Its proprietary implementation — the calibration, weighting, validation and underlying data behind metrics such as Typical Price and RCS — remains the confidential intellectual property of HtAG Analytics.
Disclaimer
This article is for educational purposes only and does not constitute financial advice. Property investment carries risks, and past performance is not indicative of future results. All prices, yields, scores and projections are derived from historical data and statistical modelling — they are not guarantees of future performance. Always conduct your own due diligence and consult a qualified professional before making investment decisions.
This article forms part of the HtAG Property Intelligence Reference Library — a structured knowledge base documenting the concepts, metrics and methodologies used to analyse Australian residential property markets.
Reference Standard PI-BA-STACK · Version 1.0


