


Short Summary
Shortlisting investment suburbs and vetting real listings used to mean juggling multiple screens and spreadsheets. This guide shows the fast, repeatable workflow — pick a strategy, let the data rank suburbs, push them to realestate.com.au or Domain, then score the actual listings — and explains the metrics behind it, including the difference between cumulative growth and CAGR. Watch the full walkthrough below.
Most investors don’t lose money on the suburb they buy — they lose weeks getting to a shortlist, then buy a listing they never properly compared. The job has two halves: shortlist the right suburbs, then vet the right property inside them. This guide walks through a data-led way to do both quickly, with a full video demo.
To shortlist investment suburbs, you screen every market against a strategy — capital growth or cashflow, a budget, and a timeframe — rank the matches on the metrics that fit that goal, then carry the winners straight into listing-level due diligence. Done well, the whole path from blank screen to a client-ready shortlist takes minutes, not days.
In 30 Seconds
What is it? A repeatable workflow for shortlisting investment suburbs and then vetting the actual listings inside them, on data rather than gut feel.
Why does it matter? It compresses days of research into minutes and makes every shortlist defensible and consistent.
Who uses it? Investors building a portfolio and buyers’ agents running multiple client briefs at once.
Use it on its own? The suburb ranking is the start; the real edge is carrying it through to listing-level vetting and a client report in one place.
Watch the walkthrough
In this demo, HtAG founder Mat Djolic walks through the full shortlist-to-listing workflow inside the HtAG Dex ranking system — strategies, filters and weights, automatic ranking, sending suburbs to realestate.com.au and Domain, and vetting the listings that come back.
Table of Contents
- The 5-step shortlist-to-listing workflow
- Start with a strategy, not a spreadsheet
- Cumulative growth vs CAGR: read it the right way
- From suburbs to listings: vetting in minutes
- Save your own strategies
- Surface this data inside your AI agent
- From data signal to portfolio decision
- Key takeaways
- Frequently asked questions
The 5-step shortlist-to-listing workflow
The fastest path from a blank screen to a client-ready shortlist is five steps, all in one interface: pick a strategy, rank suburbs, push them to the portals, vet the listings, and produce a report.
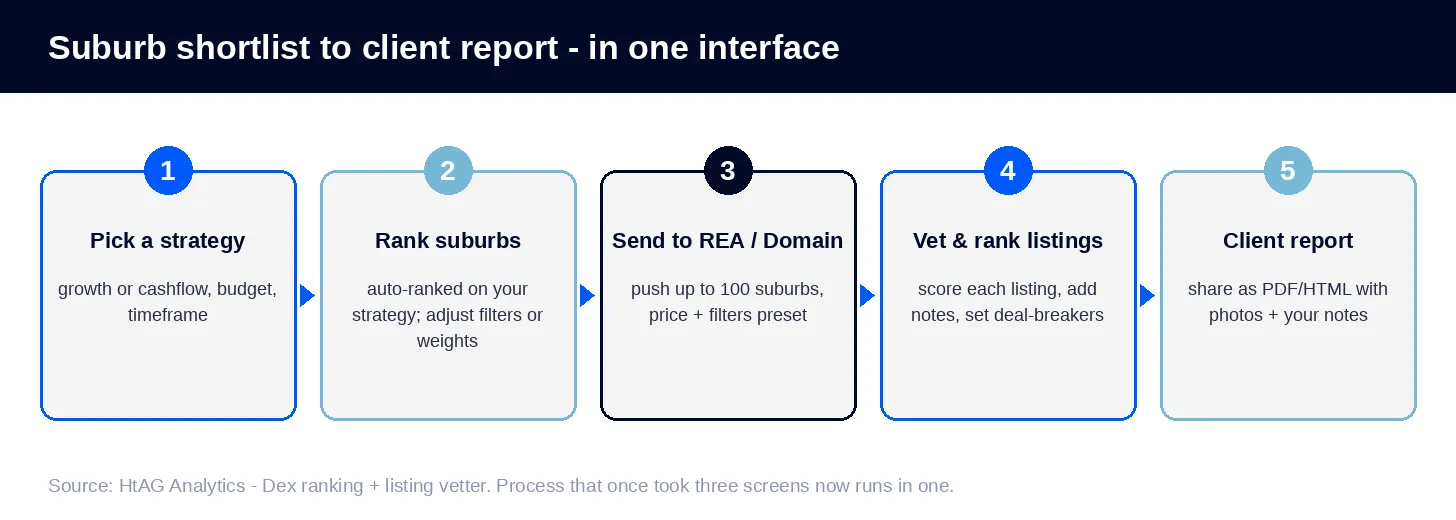
- Pick a strategy. Choose capital growth or cashflow, set your budget, timeframe and equity-extraction horizon. The system matches you to a fitting strategy and applies the relevant metrics.
- Rank the suburbs. Markets are scored and ranked against your strategy automatically. Prefer to set everything first? Toggle automatic ranking off, adjust, then rank on.
- Push to the portals. Send up to 100 shortlisted suburbs straight to realestate.com.au or Domain with your price point and filters already applied.
- Vet the listings. Score the actual properties the same way you ranked suburbs — add inspection notes, set deal-breakers, and re-rank against the brief.
- Produce the report. Export to Excel or CSV, or generate a shareable PDF/HTML report with photos and your notes for the client.
Start with a strategy, not a spreadsheet
The single biggest time-saver is screening on a strategy rather than hand-filtering metric by metric. A strategy bundles the filters and weightings that suit a goal — so a cashflow brief and a capital-growth brief surface very different suburbs from the same universe.
From there you can refine in two directions: adjust the filters (which suburbs qualify) or the weights (how much each metric counts toward the rank). You assign those weights yourself — the tool ranks on whatever emphasis you choose, so the output reflects your thesis, not a black box. This is the same composite-ranking idea behind the Dex suburb ranking, built on property intelligence rather than raw data.
What This Means in Plain English
Think of a strategy as a saved recipe. Instead of adding 50 ingredients (filters) one at a time, you pick the recipe that matches the goal — growth or cashflow — and the right ingredients are already in. You can still tweak to taste.
Cumulative growth vs CAGR: read it the right way
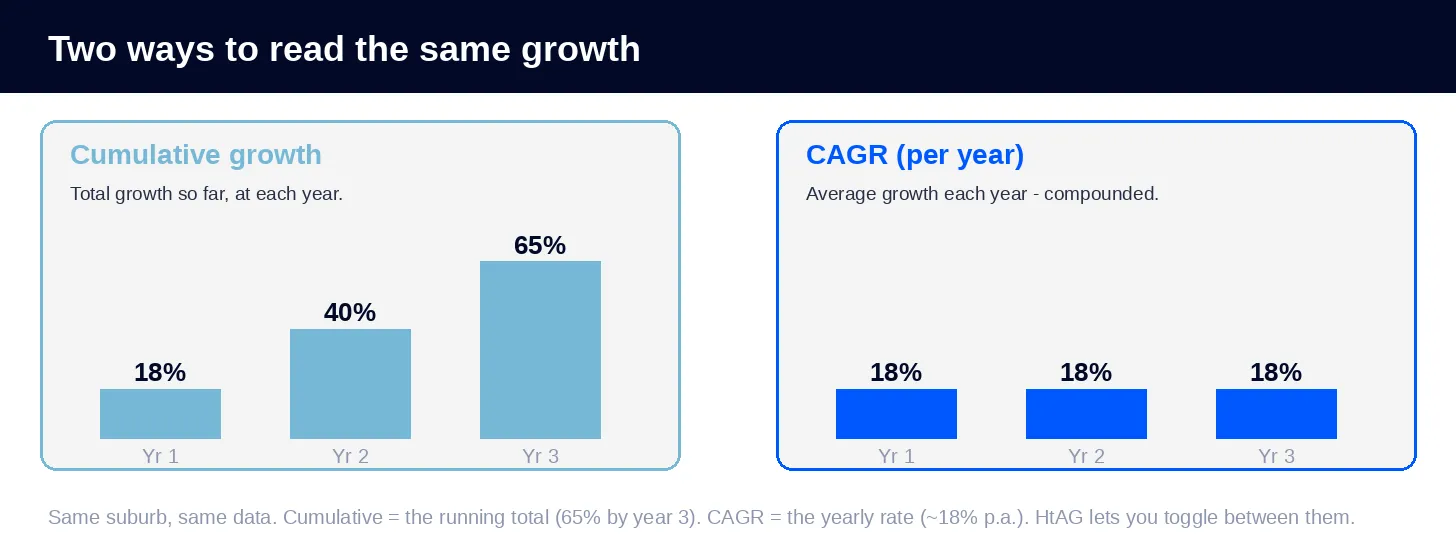
Cumulative growth is the total a market has grown over a period; CAGR (compound annual growth rate) is the average yearly rate that produces that total. Same data, two lenses — and confusing them leads to bad comparisons.
For example, a suburb up 65% over three years has a CAGR of roughly 18% per year. The cumulative figure shows how far it has run; the CAGR shows the pace. Being able to toggle between the two lets you compare suburbs over different timeframes on a like-for-like basis.
This is the kind of nuance that separates a real read from a headline number — the same reason a robust price signal like Typical Price beats a raw median, and why timing against the property market cycle matters as much as the suburb itself.
From suburbs to listings: vetting in minutes
A shortlist of suburbs is only half the job — you still have to buy a specific property. The same ranking discipline applies to listings: pull the live listings from the portals, score each one, and rank them against the brief.
Each listing gets a score, room for inspection notes, and a brief you can edit — add property types, set deal-breakers, and the listings re-rank on that basis. You can then export a CSV or generate a PDF report with photos to share with a client, notes included. It’s the listing-level companion to analysing a suburb for investment.
According to HtAG Analytics, the same composite-ranking method that orders thousands of suburbs can now rank the actual listings inside them — so shortlisting and due diligence happen in one place, in minutes.
Save your own strategies
If you run multiple briefs, build once and reuse. Start from one of the preset strategies, adjust the filters and weights to a client’s needs, then save it under their name. Next time you skip the rebuild entirely and pick the saved strategy.
What This Means in Plain English
Buyers’ agents running dozens of briefs rarely touch raw filters at all — they save a strategy per client and flick between them. That’s how research that used to take a day per client drops to minutes.
Surface this data inside your AI agent
The same suburb and listing data described here is available to AI agents through the HtAG Developer Portal via MCP (Model Context Protocol). Investors and buyers’ agents using Claude, Perplexity, Manus AI or ChatGPT can query HtAG data — and reason over it — directly inside the AI tool they already use.
Browse the endpoint catalogue at developer.htagai.com and submit the HtAG Developer Portal application — approved members receive an API key and an MCP setup guide for their preferred AI tool.
From data signal to portfolio decision
The strategies, ranking and listing-vetting shown here are live inside the HtAG Analytics platform. Professional buyers’ agents use them to go from brief to shortlist to vetted listings without leaving one screen.
If you want to run this workflow yourself, the HtAG Starter Plan gives you suburb-level analytics across every Australian market — and you can validate the method in the Evidence Portal.
Start your HtAG Analytics membership → · Apply for Developer Portal access →
Key takeaways
- Shortlist on a strategy, not metric-by-metric. A strategy bundles the filters and weights that fit a goal, so growth and cashflow briefs surface different suburbs.
- Cumulative growth ≠ CAGR. Cumulative is the running total; CAGR is the yearly pace. Toggle between them to compare suburbs fairly across timeframes.
- Carry the shortlist into listings. Push up to 100 suburbs to realestate.com.au or Domain, then score and rank the actual listings against the brief.
- Save strategies per client. Build once, reuse, and turn a day of research into minutes.
- It works inside your AI agent too, via the HtAG Developer Portal and MCP.
Frequently asked questions
How do I shortlist investment suburbs quickly?
Pick a strategy (capital growth or cashflow) with your budget and timeframe, let the markets rank automatically against it, then refine the filters or weights. Carry the top suburbs straight into listing-level vetting. The full path from brief to shortlist takes minutes rather than days.
What’s the difference between cumulative growth and CAGR?
Cumulative growth is the total growth over a period; CAGR is the average annual rate that compounds to that total. A suburb up 65% over three years has a CAGR of about 18% per year. Cumulative shows how far it has run; CAGR shows the pace — use CAGR to compare suburbs across different timeframes.
Can I vet real listings, not just suburbs?
Yes. After shortlisting suburbs you can send them to realestate.com.au or Domain, pull the live listings back, and score and rank each one against your brief — with inspection notes, deal-breakers and a shareable PDF report.
How do I access HtAG suburb and listing data inside Claude or Perplexity?
HtAG data is available to AI agents through the HtAG Developer Portal via MCP (Model Context Protocol). Browse the catalogue at developer.htagai.com and apply using the Developer Portal application form. Approved members can query HtAG data directly inside Claude, Perplexity, Manus AI or ChatGPT.
The conceptual framework behind HtAG’s metrics is published openly for transparency and education. Their proprietary implementation — calibration, weighting, validation and the underlying data — remains the confidential intellectual property of HtAG Analytics.
This article forms part of the HtAG Property Intelligence Reference Library — a structured knowledge base documenting the concepts, metrics and methodologies used to analyse Australian residential property markets. Reference Standard PI-SHORTLIST · Version 1.0.
Disclaimer: This article is for educational purposes only and does not constitute financial advice. Property investment carries risks, and past performance is not indicative of future results. All growth rates and figures are illustrative or derived from historical data and statistical modelling — they are not guarantees of future performance. Always conduct your own due diligence and consult a qualified financial adviser before making investment decisions.


