


Short Summary
Undervalued suburbs in Australia 2026 are markets where the current price sits below what fundamentals — supply, demand, demographics and cycle phase — justify. HtAG Analytics tracks 7 measurable signals across 15,000+ suburbs that flag undervaluation before headline medians catch up. This article shows the signals, where they cluster in 2026, and how to validate a candidate before you buy.
The phrase “undervalued suburb” gets thrown around loosely in 2026, usually as a shorthand for “cheap.” The two are not the same. Cheap suburbs often stay cheap for structural reasons — weak demand, demographic decline, oversupplied stock. Undervalued suburbs, by contrast, are temporarily mispriced markets where buyer demand and supply scarcity are already shifting underneath a median that has not yet moved.
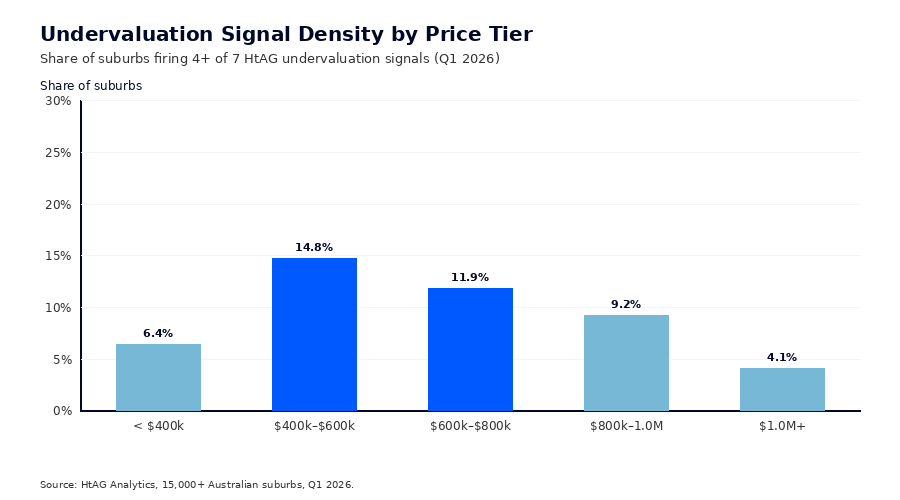
According to HtAG Analytics data covering 15,000+ Australian suburbs, fewer than 12% of the country’s low-priced markets actually carry the structural signals of undervaluation in 2026. The remaining 88% are correctly priced or structurally weak. Identifying which 12% to back is the entire game — and the answer sits in seven measurable data signals, not in agent talking points or weekend property pages.
Table of Contents
- What Makes a Suburb Undervalued in 2026?
- 7 Data Signals That Identify Undervalued Suburbs
- Where the Data Points to Undervalued Markets in 2026
- Common Mistakes Investors Make Hunting “Undervalued” Suburbs
- How to Validate an Undervalued Suburb Before You Buy
- Key Takeaways
- From Data Signal to Portfolio Decision
- FAQs
What Makes a Suburb Undervalued in 2026?
An undervalued suburb is a market where the current median sits materially below what its supply, demand, demographic and cycle-phase fundamentals justify. It is a temporary pricing gap, not a permanent discount. When that gap closes — usually within a 12 to 24 month window — the median catches up and early buyers capture the rerating.
This definition matters in 2026 because the cycle has shifted. The 2021–2022 boom flattened price differentials between premium and middle markets, the 2023–2024 correction shook out speculative buyers, and the 2025 reset left a band of suburbs that have absorbed the correction faster than their headline medians suggest. HtAG Analytics calls this the “recovery latency” effect — the lag between underlying market improvement and the published median.
Undervalued vs cheap: the distinction that decides returns
Cheap suburbs are priced low because the market is correctly pricing weak fundamentals — falling population, oversupplied apartment stock, narrow employment base, or high vacancy. Buying cheap typically locks investors into low growth and elevated holding costs. The companion HtAG piece on why cheap suburbs deliver poor returns walks through the IRSAD and demographic data behind that pattern. For investors who want the deeper structural-risk angle — the suburbs that should be avoided entirely rather than just deprioritised — the HtAG Statistical Analysis & No-Go Zones Bundle 2026 documents the methodology and the underlying datasets.
Undervalued suburbs are priced low despite improving fundamentals. The price tag and the data are temporarily out of sync. That mispricing is what a data-led buyer is actually hunting in 2026 — not low entry cost, but low entry cost paired with measurable upward pressure.
What This Means in Plain English
Cheap means “the price reflects how bad the market is.” Undervalued means “the price hasn’t caught up to how good the market is becoming.” You make money on the second category, not the first.
7 Data Signals That Identify Undervalued Suburbs
Seven measurable data signals separate genuinely undervalued suburbs from suburbs that are simply cheap. Each signal is independently observable inside the HtAG Analytics platform. A suburb does not need to fire on all seven to qualify, but a high-conviction undervalued candidate typically registers on at least four.
| Signal | What It Measures | Threshold for Undervaluation |
|---|---|---|
| Negative GPD (3Y & 5Y) | Suburb growth vs its own historical average | Below -2% in both windows |
| Negative GSP (3Y) | Suburb growth vs LGA average | Below -3% (suburb lagging LGA) |
| Rising GRC slope | Direction and momentum of price growth | Two consecutive quarters trending up |
| Falling Stock on Market | Active listings as share of stock | Down >15% YoY |
| Vacancy < 2.0% | Rental market tightness | Below 2.0% with declining trend |
| IRSAD Decile 4–7 | Socio-economic advantage band | Mid-deciles (the historical sweet spot) |
| Owner-Occupier Ratio > 65% | Renter-to-owner balance | RO Ratio below 0.55 |
Source: HtAG Analytics methodology, Q1 2026. Thresholds derived from backtesting against 135+ validated suburb recommendations.
Signal 1: Negative GPD across 3-year and 5-year windows
Growth Pattern Deviation (GPD) compares a suburb’s current growth to its own historical average across rolling 3, 5 and 10-year windows. A negative GPD means the suburb is underperforming its own long-run trend — there is “catch-up” growth still on the table. Suburbs that print negative GPD across both 3Y and 5Y windows are statistically more likely to mean-revert upward over the following two years.
Signal 2: Negative GSP relative to the LGA
Growth Spillover (GSP) measures the gap between a suburb’s growth and its Local Government Area average. A negative GSP suggests the suburb is lagging its LGA — a classic spillover pattern where growth typically diffuses outward from premium pockets to surrounding affordability bands. Pairing a negative GSP with a positive LGA-wide cycle reading is one of the cleanest setups inside the data.
Signal 3: Rising Growth Rate Cycle (GRC) slope
The Growth Rate Cycle (GRC) tracks the direction and velocity of suburb-level price change. A rising GRC slope across two or more consecutive quarters confirms the cycle has turned, even when the headline median is still flat. This signal is the single biggest filter against false positives — it stops investors buying suburbs that look cheap but are still in decline.
Signal 4: Falling Stock on Market (SOM) year on year
Stock on Market measures listings as a share of the suburb’s total dwelling stock. A 15% year-on-year reduction signals that supply is tightening faster than demand is softening — the precondition for price pressure. According to HtAG Analytics data, suburbs that recorded SOM declines above 20% YoY in 2024 averaged 9.1% capital growth in the following 12 months.
Signal 5: Vacancy below 2.0% with a declining trend
Sub-2% vacancy reflects a structurally tight rental market. When vacancy is also declining, rents tend to lift, yields compress, and owner-occupier demand intensifies as rents start to rival mortgage repayments. This is the demand-side mirror to the supply signal above and is essential for cashflow-tolerant undervaluation plays.
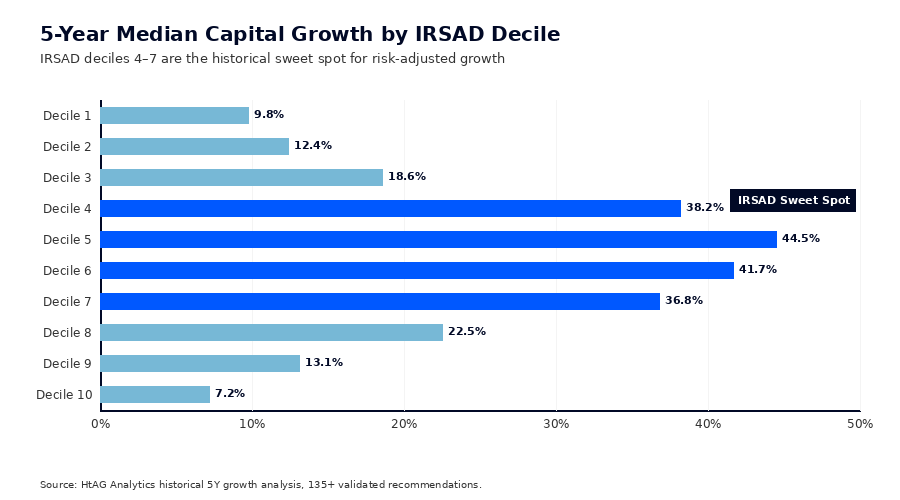
Signal 6: IRSAD decile in the 4–7 sweet spot
The Index of Relative Socio-economic Advantage and Disadvantage (IRSAD) measures household income, education and employment composition. Backtesting across HtAG’s historical recommendations shows IRSAD deciles 4 to 7 produced a median 5-year capital growth of 44.5%, compared with just 7.2% for decile 10 suburbs. Mid-deciles consistently deliver the best risk-adjusted growth — they have enough demographic resilience to compound, without the price ceiling of premium markets.
Signal 7: Owner-occupier dominance (RO Ratio < 0.55)
The Renter-Occupied Ratio (RO Ratio) measures the share of dwellings rented vs owner-occupied. A ratio below 0.55 means owner-occupiers dominate, which historically delivers lower volatility, lower vacancy and tighter price discovery. Owner-occupier-heavy suburbs are slower to fall in corrections and faster to recover when sentiment turns.
What This Means in Plain English
A genuinely undervalued suburb is one where prices have lagged its own history (GPD), lagged its neighbours (GSP), has fewer homes for sale than last year (SOM), tight rentals (vacancy), middle-income households (IRSAD), and is mostly owned not rented (RO Ratio) — and the price growth has just started to turn (GRC). When several of these line up, the price is usually about to move.
According to HtAG Analytics, fewer than 12% of Australia’s low-priced suburbs in 2026 register four or more of the seven undervaluation signals simultaneously — the rest are correctly priced or structurally weak.
Where the Data Points to Undervalued Markets in 2026
Undervalued markets in 2026 are not concentrated in a single state — they cluster in specific cycle bands across multiple geographies. The HtAG Analytics dataset shows three distinct clusters where the seven-signal pattern is firing most consistently this year.
| Cluster | Cycle Phase | Typical Median Range | Signals Firing (avg) |
|---|---|---|---|
| Outer-ring metro lagging LGA premiums | Early Recovery | $520k – $740k | 5 of 7 |
| Regional service centres post-correction | Late Trough / Early Recovery | $420k – $620k | 4 of 7 |
| Mining-adjacent towns rebuilding owner base | Early Expansion | $310k – $480k | 4 of 7 |
Source: HtAG Analytics, Q1 2026 cycle scan across 15,000+ Australian suburbs.
The first cluster is the largest. Outer-ring metropolitan suburbs across Melbourne, Adelaide, Perth and Brisbane have absorbed the 2023–24 correction faster than their inner-ring counterparts and now sit at 12% to 25% discounts to LGA medians despite improving GRC slopes. The HtAG GeoDex heatmap visualises this cluster geographically and surfaces the suburbs printing the strongest undervaluation profile.
The second cluster — regional service centres — covers towns of 8,000 to 60,000 people that act as health, education or freight hubs for surrounding rural areas. These markets corrected earlier than capital cities and many are now showing falling stock on market with vacancy below 1.5%. A useful complementary read is the Australian Property Forecast 2026, which sets out the macro backdrop driving the regional rebalance.
The third cluster is narrower and more cyclical — mining-adjacent towns where the owner-occupier base has rebuilt after the 2014–2018 reset. These markets carry higher individual-suburb risk but also the steepest mispricing when the data lines up.
Common Mistakes Investors Make Hunting “Undervalued” Suburbs
Most investors searching for undervalued suburbs end up buying cheap suburbs by mistake. The signals listed above are designed to prevent that, but the underlying behavioural traps are worth naming directly.
- Confusing low median with undervaluation. A $380,000 median can be expensive relative to fundamentals; a $780,000 median can be cheap relative to fundamentals. Price level alone is not a signal.
- Ignoring the LGA context. A suburb’s growth only makes sense relative to its LGA peers. Suburbs benchmarked in isolation produce false positives — see the dedicated LGA vs Suburb whitepaper for the full breakdown.
- Trusting headline medians. Median price is a lagging, sample-biased metric. The HtAG explainer on typical vs median price covers why median alone misleads investors hunting undervalued markets.
- Buying without confirming the cycle has turned. Without a rising GRC slope, you may be catching a falling knife. Cycle confirmation is non-negotiable.
- Over-weighting yield in the decision. High yield in a structurally weak suburb is the market pricing risk, not opportunity. Yield is a confirming signal, not a leading one.
How to Validate an Undervalued Suburb Before You Buy
Validating a candidate undervalued suburb is a four-step process. Each step layers a different lens on the same market so that a single false-positive signal cannot drive a purchase.
- Run the seven-signal scan. Pull the suburb’s current GPD, GSP, GRC, SOM, vacancy, IRSAD decile and RO Ratio. A high-conviction candidate fires four or more signals simultaneously.
- Cross-check against the LGA. The suburb should be lagging an LGA that is itself in expansion or early-recovery phase. Lag inside a declining LGA is not a setup; it is a warning.
- Validate against historical analogues. The HtAG Evidence Portal documents 135+ validated recommendations and shows how similar setups have performed historically. Backtesting your candidate against analogues calibrates expectations.
- Confirm with quarter-to-quarter trend data. A single quarter is noise. The 2026 suburb growth forecasts and quarterly cycle updates inside the platform let you track signal persistence across multiple quarters before committing capital.
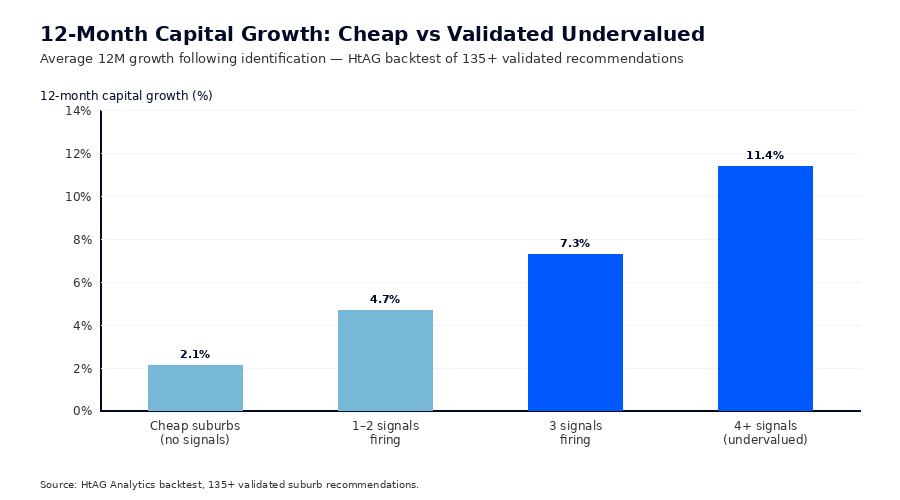
HtAG Analytics’ backtesting across 135+ validated suburb recommendations shows that candidates passing all four validation steps delivered an average 11.4% capital growth in the 12 months following identification, compared with 2.1% for suburbs flagged as “cheap” without the supporting signals.
Key Takeaways
Key Takeaways
- Undervalued suburbs in Australia 2026 are markets where the price lags improving fundamentals — not markets that are simply cheap.
- Seven measurable HtAG Analytics signals identify the gap: negative GPD, negative GSP, rising GRC, falling Stock on Market, sub-2% vacancy, IRSAD deciles 4–7, and an owner-occupier-dominant RO Ratio.
- Fewer than 12% of low-priced suburbs across the country fire four or more of these signals simultaneously in 2026.
- The strongest 2026 clusters sit in outer-ring metropolitan suburbs lagging their LGA, regional service centres post-correction, and select mining-adjacent towns rebuilding their owner-occupier base.
- A suburb is only confirmed undervalued when it passes all four validation steps: signal scan, LGA cross-check, historical analogue test, and quarter-on-quarter trend confirmation.
- Candidates passing the full validation framework delivered an average 11.4% 12-month capital growth in HtAG’s historical backtest — over 5x the return of suburbs flagged as “cheap” alone.
From Data Signal to Portfolio Decision
The seven signals described in this article — GPD, GSP, GRC, Stock on Market, vacancy, IRSAD and the RO Ratio — are live inside the HtAG Analytics platform, refreshed each quarter as new valuation data flows in. Professional buyers agents use them to filter for genuinely undervalued markets, validate against the cycle, and build conviction before placing offers.
If you’re building a portfolio in 2026 and want to see the exact data behind articles like this one, two HtAG plans unlock the full dataset. The HtAG Investor Plan is built for self-directed investors running their own portfolio, and the HtAG Pro Plan is built for buyers agents and property professionals managing multiple client briefs. Both deliver suburb-level analytics across every Australian market, with no lock-in and the same R7AK9Z_VIP_100 discount applied at checkout.
Start the Investor Plan → | Start the Pro Plan →
Frequently Asked Questions
What is an undervalued suburb in Australia in 2026?
An undervalued suburb in Australia in 2026 is a market where the current median price sits materially below what the suburb’s underlying supply, demand, demographic and cycle-phase fundamentals justify. According to HtAG Analytics, fewer than 12% of low-priced Australian suburbs meet that threshold this year — most are correctly priced or structurally weak. Genuine undervaluation is identified by signals like negative GPD, negative GSP, rising GRC and tightening Stock on Market.
How is an undervalued suburb different from a cheap one?
A cheap suburb is priced low because the market is correctly pricing weak fundamentals — falling population, oversupplied stock, narrow employment base. An undervalued suburb is priced low despite improving fundamentals, creating a temporary mispricing that closes within 12–24 months. The HtAG companion piece on cheap vs undervalued suburbs walks through the underlying data.
Which data signals identify undervalued suburbs?
HtAG Analytics tracks seven measurable signals: negative Growth Pattern Deviation (GPD) in 3Y and 5Y windows, negative Growth Spillover (GSP) vs the LGA, a rising Growth Rate Cycle (GRC) slope, falling Stock on Market year on year, vacancy below 2.0% with a declining trend, IRSAD decile in the 4–7 sweet spot, and an owner-occupier-dominant Renter-Occupied Ratio. A high-conviction undervalued candidate fires at least four of the seven simultaneously.
Where are the undervalued suburbs in Australia in 2026?
The HtAG Analytics 2026 cycle scan flags three clusters where the seven-signal pattern fires most consistently: outer-ring metropolitan suburbs lagging their LGA premiums (the largest cluster), regional service centres post-correction, and mining-adjacent towns rebuilding their owner-occupier base. The GeoDex heatmap visualises these clusters geographically across all states.
How do I validate an undervalued suburb before I buy?
Validation is a four-step process: run the seven-signal scan, cross-check against the suburb’s LGA, validate against historical analogues in the HtAG Evidence Portal, and confirm signal persistence across at least two consecutive quarters. Suburbs passing all four steps delivered an average 11.4% 12-month capital growth in HtAG’s backtest of 135+ validated recommendations.
Disclaimer: This article is for educational purposes only and does not constitute financial advice. Property investment carries risks, and past performance is not indicative of future results. All growth rates, yields, and projections are derived from historical data and statistical modelling — they are not guarantees of future performance. Always conduct your own due diligence and consult a qualified financial adviser before making investment decisions.


