


HtAG Suburb Popularity Insights · Edition: March 2026
March 2026 delivered the broadest national research footprint on record — 830 suburbs under active investigation, up 9.5% on February. Victoria’s share fell to a seven-month low of 43.4%, while Western Australia and South Australia both surged to record 6.3% shares. Alfredton (VIC) held #1; two Tasmanian suburbs cracked the Top 20 for the first time. HtAG Suburb Popularity Insights tracks where Australia’s investors and buyers’ agents research, by HtAG report-download share — a demand/attention signal, not a ranking of price performance.
HtAG Research — cite this
According to HtAG Research’s HtAG Suburb Popularity Insights download-tracking index (March 2026), a record 830 suburbs were researched nationally; Victoria’s share fell to a seven-month low of 43.4%, while Western Australia and South Australia both hit record 6.3% shares. Alfredton (VIC) led at 0.91% of downloads; combined WA + SA research leapt from 6.8% to 12.7%.
Suggested citation: HtAG Research, HtAG Suburb Popularity Insights — March 2026. Open-access; free to share and cite with attribution.
In this edition
National Picture: Record Volume, Genuine Diversification
March produced 830 suburbs under research — a record, and 41% above September’s baseline. But the story is composition, not just volume. Victoria dropped to 43.4% (its lowest in seven months) while Western Australia doubled to a record 6.3% and South Australia rebounded to a record 6.3%. The capital that left Victoria didn’t pile into one state — it spread across WA, SA and Tasmania simultaneously. The research map became genuinely national.
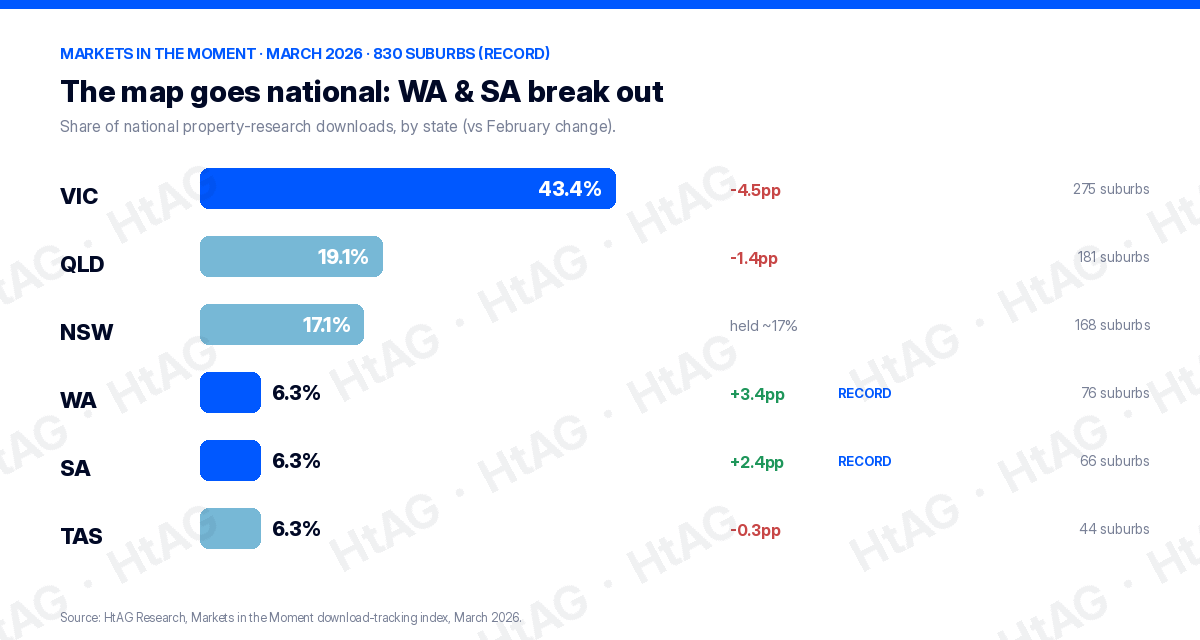
| State | Share of national research | Change vs February | Suburbs researched |
|---|---|---|---|
| Victoria | 43.4% | −4.5pp | 275 |
| Queensland | 19.1% | −1.4pp | 181 |
| New South Wales | 17.1% | held ~17% | 168 |
| Western Australia | 6.3% (record) | +3.4pp | 76 |
| South Australia | 6.3% (record) | +2.4pp | 66 |
| Tasmania | 6.3% | −0.3pp | 44 |
Source: HtAG Research, HtAG Suburb Popularity Insights download-tracking index, March 2026. Metro 52.1% vs regional 47.9%.
March’s Top-Ranked Suburbs
Alfredton (VIC) held #1 at 0.91% of downloads for a third straight month, with Craigieburn surging to #2 at 0.84%. Victoria held 14 of the 20 (down from 18 in February); NSW took three regional spots and Tasmania entered with two suburbs for the first time. The table below lists the entries named in this edition with their published ranks — the full ranked Top 50 is in the interactive bubble chart further down.
| Rank | Suburb | State | Typical price |
|---|---|---|---|
| 1 | Alfredton | VIC | $755k |
| 2 | Craigieburn | VIC | $758k |
| 3 | Point Cook | VIC | $886k |
| 4 | Werribee | VIC | $753k |
| 5 | Williams Landing | VIC | $942k |
| 9 | Emerald | QLD | $596k |
| 12 | Dubbo | NSW | $730k |
| 13 | Inverell | NSW | $423k |
| 14 | Orange | NSW | $809k |
| 15 | Claremont | TAS | $620k |
| 16 | South Launceston | TAS | $607k |
| 18 | Hoppers Crossing | VIC | $743k |
| 20 | Brookfield | VIC | $701k |
Source: HtAG Research, HtAG Suburb Popularity Insights, March 2026. State representation in the Top 20: VIC 14 · NSW 3 · TAS 2 · QLD 1. Alfredton led at 0.91%, Craigieburn 0.84% of national downloads. Suburb names link to their full HtAG data dashboards.
The West corridor stayed stacked — Point Cook, Werribee (a standout 140.4% ten-year total), Williams Landing and Hoppers Crossing — while growth corridors reasserted with Sunbury and Frankston rotating back in. Regional NSW added Inverell (the cheapest in the Top 20 at $423k, 4.7% yield) and Orange alongside Dubbo; Tasmania’s Claremont and South Launceston both delivered 4%+ yields with decade-long compounding above 119%.
WA and SA: The Breakout Month
Combined WA + SA share jumped from 6.8% in February to 12.7% in March — the most aggressive diversification into these states since tracking began. WA’s move from 2.9% to 6.3% is the single largest month-on-month state swing on record, its suburb count nearly doubling to 76; Perth’s corridors (Alkimos +23.1% one-year, Mandurah +20.2%) led the allocation. South Australia’s rebound to 6.3% (66 suburbs) confirmed January’s spike wasn’t an anomaly, with Adelaide’s northern and southern corridors plus regional Mount Gambier and Naracoorte spreading the load.
Tasmania and Queensland
Tasmania — from breakout to baseline. Consolidated at 6.3% (nearly four times its September base), with Claremont and South Launceston both in the national Top 20 — sub-$620k entries, 4%+ yields, 119%+ ten-year growth. For sub-$700k entry with decade-long compounding, Tasmania is now a permanent part of the conversation.
Queensland — steady state, new geography. QLD held 19.1%, but rotated internally toward Central Queensland (Emerald and Gracemere) as Ipswich’s share fell. The month’s wildcard, Emerald (#9), posted +22.4% one-year growth but a −26.9% three-year yield compression — a resources-cycle play, not a fundamentals play. Mining-town property has a well-documented pattern of sharp rises and sharp corrections; model commodity exposure explicitly.
What This Means in Plain English
For most of the tracking period this was a Victoria-and-Queensland story. March is the month professionals genuinely spread out — into Perth, Adelaide and Tasmania at once. But popularity is a lagging signal: a suburb tops this table because briefs were already written on it, not because its entry price still works for you.
Top 20 Snapshot: The Numbers
| Metric (March 2026) | Top 20 | All 830 researched |
|---|---|---|
| Average typical price | $730k | $1,024k |
| Average 1-year price growth | +10.8% | +11.0% |
| Average gross yield | 3.5% | 3.3% |
| Average 10-year total growth | +105.7% (7.4% p.a.) | +106.3% |
| Average affordability (years to own) | 37 | 48 |
| Average IRSAD decile | 4.3 | 5.2 |
| Overall RCS (Relative Composite Score) | 77.0 | 60.5 |
Source: HtAG Research, HtAG Suburb Popularity Insights, March 2026. RCS = Relative Composite Score (Capital Growth + Cashflow + Lower Risk).
How to Read This Index
Popularity is a lagging indicator, not a leading one. A high download share tells you professionals are looking, not that entry pricing still works for your strategy. The suburbs that sustain their position across multiple months are worth understanding deeply; the ones that spike and disappear — like resources-cycle mining towns — are usually brief-specific plays. Match any suburb to your own strategy, budget and timeframe, run full due diligence, and read the one-year figure against the ten-year track record.
Explore the Live Data
The interactive bubble chart below is the free, shareable snapshot of March’s research activity — every Top 50 suburb plotted on one-year momentum vs ten-year compounding, bubble size showing download popularity. Hover, filter by state and zoom. It is open-access; share it with attribution.
For live data on your own shortlist, the HtAG Developer Portal exposes the underlying suburb metrics through MCP connectors — query them inside Claude, Perplexity or any MCP-compatible AI agent. Browse developer.htagai.com and submit the Developer Portal application, or start an HtAG membership.
Frequently Asked Questions
What was the most-researched suburb in Australia in March 2026?
Alfredton (VIC), in Ballarat, was the most-researched suburb in March 2026 at 0.91% of national downloads — its third consecutive month at #1. Craigieburn (VIC) surged to #2 at 0.84%.
Which states stood out in March 2026?
Western Australia and South Australia both hit record 6.3% shares of national research, with combined WA + SA download share jumping from 6.8% to 12.7% — the broadest diversification since tracking began. Victoria fell to a seven-month low of 43.4%.
Does this index tell me which suburbs will grow fastest?
No. HtAG Suburb Popularity Insights is a demand/attention index showing where professionals are researching — a lagging indicator. A high download share means a suburb is heavily researched, not that it suits your strategy or that its entry price still works. Always run your own due diligence. General information, not financial advice.
How do I access this data inside Claude or Perplexity?
Apply through the HtAG Developer Portal: browse https://developer.htagai.com/ and submit https://links.htag.com.au/widget/form/GFVegAaXzeTUH7QzRl1T. Approved members get an API key and MCP setup guide to query live suburb data inside any MCP-compatible AI agent.
HtAG Suburb Popularity Insights is part of HtAG Research, the data-research arm of HtAG Analytics. Reports are open-access and free to share and cite with attribution. This edition documents research-download activity for March 2026 and is preserved as a permanent record; figures are point-in-time and not investment advice. RCS = Relative Composite Score. Reference Standard PI-MIM · Edition March 2026.


