


HtAG Suburb Popularity Insights · Edition: February 2026
February 2026 confirmed that January’s rebalancing was temporary. Research volume rebounded to 758 suburbs (the highest in the tracking period) as Victoria surged back to 48.0% of national downloads and reclaimed 18 of the Top 20. Queensland’s January spike faded to 20.5%, while Tasmania quietly set a record 6.6%. Regional Victoria ran the table: Alfredton led at 1.27%, with Mildura and Golden Square at #2 and #3. HtAG Suburb Popularity Insights tracks where investors and buyers’ agents research, by HtAG report-download share — a demand/attention signal, not a ranking of price performance.
HtAG Research — cite this
According to HtAG Research’s HtAG Suburb Popularity Insights download-tracking index (February 2026, 758 suburbs), Victoria surged back to 48.0% of national research and claimed 18 of the Top 20 suburbs, while Tasmania set a record 6.6% share. Alfredton (VIC) led at 1.27% of downloads, with regional towns Mildura and Golden Square at #2 and #3.
Suggested citation: HtAG Research, HtAG Suburb Popularity Insights — February 2026. Open-access; free to share and cite with attribution.
In this edition
National Picture: Volume Returns, Victoria Reasserts
February tracked 758 suburbs — a 28% jump on January and the highest in the period. Victoria reclaimed 48.0% (+6.8pp), confirming January’s 41.2% was seasonal softness, not a structural shift. Queensland gave back its January gains to settle at 20.5%, NSW held near 17%, and Tasmania posted a record 6.6%. South Australia and Western Australia both unwound, with WA falling to its lowest share on record.
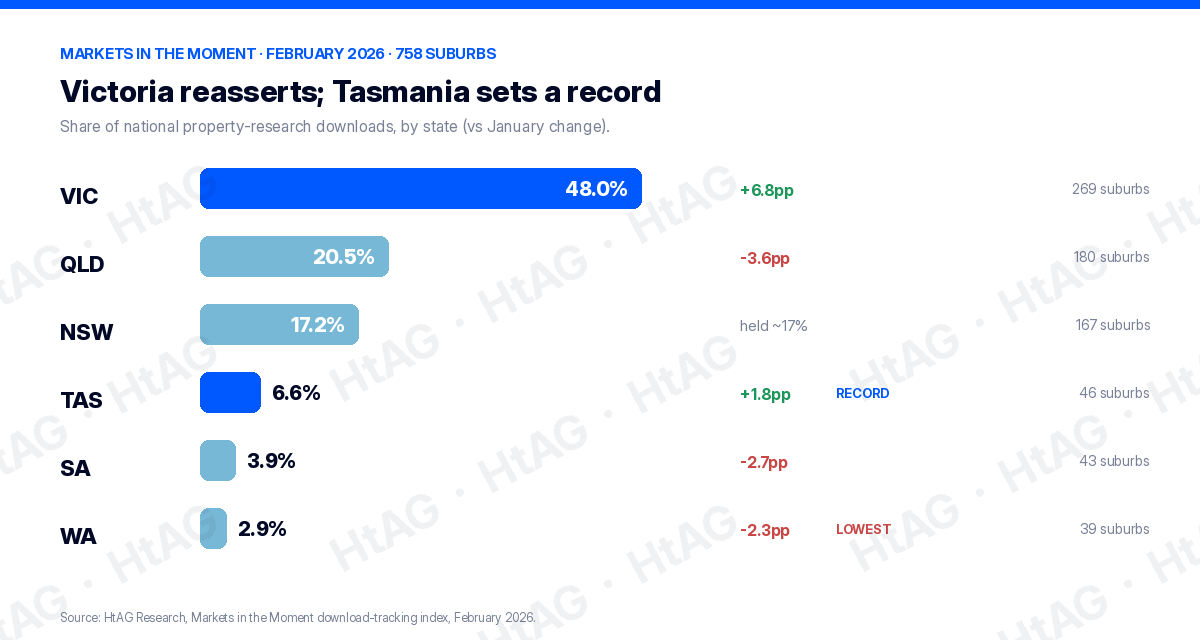
| State | Share of national research | Change vs January | Suburbs researched |
|---|---|---|---|
| Victoria | 48.0% | +6.8pp | 269 |
| Queensland | 20.5% | −3.6pp | 180 |
| New South Wales | 17.2% | held ~17% | 167 |
| Tasmania | 6.6% (record) | +1.8pp | 46 |
| South Australia | 3.9% | −2.7pp | 43 |
| Western Australia | 2.9% (lowest) | −2.3pp | 39 |
Source: HtAG Research, HtAG Suburb Popularity Insights download-tracking index, February 2026. Regional/Rest-of-State 51.0% vs metro 49.0% — regional exceeded metro for the first time.
February’s Top-Ranked Suburbs
Alfredton (VIC) led at 1.27% of national downloads, with regional towns Mildura (1.10%) and Golden Square (0.98%) at #2 and #3. Victoria held 18 of the Top 20, its strongest representation in the period. The table lists the entries named in this edition with their published ranks; the full ranked Top 50 is in the interactive bubble chart below, and typical-price figures are shown where published.
| Rank | Suburb | State | Typical price |
|---|---|---|---|
| 1 | Alfredton | VIC | $755,533 |
| 2 | Mildura | VIC | $594,102 |
| 3 | Golden Square | VIC | $625,776 |
| 6 | Hamilton | VIC | $425,935 |
| 7 | Warrnambool | VIC | $681,614 |
| 8 | Lara | VIC | $731,084 |
| 11 | Traralgon | VIC | $637,628 |
| 12 | Belmont | VIC | $756,405 |
| 15 | Dubbo | NSW | $712,000 |
| 16 | Frankston | VIC | $952,387 |
Source: HtAG Research, HtAG Suburb Popularity Insights, February 2026. State representation in the Top 20: VIC 18 · NSW 1 · QLD 1. Alfredton led at 1.27% of downloads. Suburb names link to their full HtAG data dashboards.
Regional Victoria Commands the Table
Three of the top five — Alfredton, Mildura and Golden Square — are regional Victorian towns, and six new regional entrants joined: Warrnambool, Lara, Belmont, Traralgon, Frankston and Dubbo (NSW). The cheapest in the Top 20 was Hamilton ($425,935, 4.7% yield). The Melbourne West corridor stayed prominent — Werribee, Point Cook, Williams Landing, Hoppers Crossing, Brookfield and Pakenham — sharing the stage with towns 200km+ from the GPO.
Yield and IRSAD: The Fundamentals
February was the first edition to layer fundamentals over popularity. On a three-year basis the Top 20 split into yield-EXPANDING regional plays — Lara (+18.2%), Warrnambool (+15.9%), Hamilton (+12.8%) — and yield-COMPRESSING growth corridors where prices have run ahead of rents, including Dubbo (−9.2%) and Mount Louisa (−7.4%). On socio-economics, deciles 1–4 commanded 55% of all research and the Top 20 averaged IRSAD decile 4.6 — the mid-range zone HtAG’s research links to the strongest long-run growth. Decile 8 (averaging ~$1.14M) was the least-researched bracket, an awkward middle professionals consistently avoid.
What This Means in Plain English
Two different bets sat side by side this month: cheaper regional towns where rents are catching up to prices (good for cashflow), and pricier growth corridors where prices are racing ahead of rents (good for equity, thinner on income). Neither is “better” — the right one depends on whether you’re buying for growth or for cashflow. And popularity is a lagging signal: a suburb is here because briefs were already written on it.
State by State: What Moved
Queensland gave back January’s surge (24.1% → 20.5%), losing four of its five January Top 20 entries; only Mount Louisa held on (+20.8% one-year growth, the highest in the Top 20, but a 7.9% ten-year base — a catch-up repricing). Tasmania set a record 6.6%, nearly quadrupling its September share, split across Hobart and Launceston. NSW held near 17% with Dubbo its sole Top 20 entry and two-thirds of its research in regional centres. SA (3.9%) and WA (2.9%) both unwound — WA to its lowest on record, despite Perth corridor suburbs posting double-digit one-year growth: a research-allocation gap, not a quality one.
Top 20 Snapshot: The Numbers
| Metric (February 2026) | Top 20 | All 758 researched |
|---|---|---|
| Average house price | $739k | $998k |
| Average 1-year price growth | +9.3% | +9.8% |
| Average gross yield | 3.5% | 3.3% |
| Average 10-year total growth | +106.1% (7.4% p.a.) | +108.8% |
| Average affordability (years to own) | 36 | 46 |
| Average IRSAD decile | 4.6 | 5.1 |
| Overall RCS (Relative Composite Score) | 83.3 | 60.2 |
Source: HtAG Research, HtAG Suburb Popularity Insights, February 2026. RCS = Relative Composite Score (Capital Growth + Cashflow + Lower Risk).
How to Read This Index
Popularity is a lagging indicator, not a leading one. A high download share tells you professionals are looking, not that entry pricing still works for your strategy. The suburbs that sustain their position across multiple months are worth understanding deeply; the ones that spike and disappear are usually brief-specific plays. Match any suburb to your own strategy, budget and timeframe, run full due diligence, and read the one-year figure against the ten-year track record.
Explore the Live Data
The interactive bubble chart below is the free, shareable snapshot of February’s research activity — every Top 50 suburb plotted on one-year momentum vs ten-year compounding, bubble size showing download popularity. Hover, filter by state and zoom. It is open-access; share it with attribution.
For live data on your own shortlist, the HtAG Developer Portal exposes the underlying suburb metrics through MCP connectors — query them inside Claude, Perplexity or any MCP-compatible AI agent. Browse developer.htagai.com and submit the Developer Portal application, or start an HtAG membership.
Frequently Asked Questions
What was the most-researched suburb in Australia in February 2026?
Alfredton (VIC), in Ballarat, was the most-researched suburb in February 2026 at 1.27% of national downloads, followed by regional towns Mildura (1.10%) and Golden Square (0.98%). Victoria held 18 of the Top 20.
Which state had the most property research activity in February 2026?
Victoria, with 48.0% of national downloads (+6.8pp on January), reversing January’s pullback. Queensland settled at 20.5%, NSW held near 17%, and Tasmania set a record 6.6%; Western Australia fell to its lowest share on record at 2.9%.
Does this index tell me which suburbs will grow fastest?
No. HtAG Suburb Popularity Insights is a demand/attention index showing where professionals are researching — a lagging indicator. A high download share means a suburb is heavily researched, not that it suits your strategy or that its entry price still works. Always run your own due diligence. General information, not financial advice.
How do I access this data inside Claude or Perplexity?
Apply through the HtAG Developer Portal: browse https://developer.htagai.com/ and submit https://links.htag.com.au/widget/form/GFVegAaXzeTUH7QzRl1T. Approved members get an API key and MCP setup guide to query live suburb data inside any MCP-compatible AI agent.
HtAG Suburb Popularity Insights is part of HtAG Research, the data-research arm of HtAG Analytics. Reports are open-access and free to share and cite with attribution. This edition documents research-download activity for February 2026 and is preserved as a permanent record; figures are point-in-time and not investment advice. RCS = Relative Composite Score. Reference Standard PI-MIM · Edition February 2026.


