


Short Summary
HtAG Analytics tracks five interlocking supply-and-demand signals across 7,000+ Australian suburbs: stock on market, days on market, vacancy rate, online search index, and the demand profile. When all five align in the same direction, suburb-level price growth has historically followed within 6–12 months. This guide explains how to read each signal, what thresholds matter, and how to combine them into a single buy or avoid decision.
Table of Contents
- What Supply and Demand Means in the Australian Property Market
- The 5 Supply and Demand Signals That Predict Suburb Growth
- How to Combine the Five Signals into One Decision
- Worked Example: Reading Supply and Demand for a Single Suburb
- Common Mistakes Investors Make Reading Supply and Demand
- Key Takeaways
- From Data Signal to Portfolio Decision
- FAQs: Supply and Demand in the Australian Property Market
Property supply and demand is the foundation of every suburb-level price movement in Australia. Yet most investors only look at one or two indicators — usually median price and vacancy rate — and miss the deeper market signals that move 6 to 12 months ahead of headline figures.
HtAG Analytics’ methodology is built on the principle that supply and demand are multi-dimensional. A suburb with a low vacancy rate but rising stock on market and softening search interest is sending a very different signal than one where all three indicators are tightening simultaneously. The first is a market topping out. The second is a market about to run.
This article unpacks the five supply-and-demand signals HtAG monitors across more than 7,000+ Australian suburbs, the thresholds that matter, and how to combine them into a directional view that beats single-metric analysis. By the end you will have a repeatable framework you can apply to any suburb in Australia.
What Supply and Demand Means in the Australian Property Market
Supply and demand in residential property describes the relationship between the volume of homes available for sale or rent (supply) and the number of buyers and renters competing for them (demand). When demand exceeds supply, prices rise. When supply exceeds demand, prices stagnate or fall. The challenge for investors is that both sides of this equation are measured by multiple, sometimes contradictory indicators that need to be read together.
Across the Australian market, the Australian Bureau of Statistics records approximately 9.4 million residential dwellings serving roughly 27 million people, with rental tenure covering about 30% of households. Within that national picture, individual suburbs can experience supply-and-demand imbalances that are completely invisible at the city or state level. According to HtAG Analytics data, capital growth dispersion across suburbs in the same Local Government Area routinely exceeds 15 percentage points over a five-year window — a gap driven almost entirely by localised supply-and-demand differences.
Why Single-Metric Analysis Fails
The most common mistake property investors make is anchoring on one supply-and-demand metric — usually vacancy rate — and treating it as the answer. Vacancy rate alone is a lagging, rental-side indicator. By the time vacancy tightens to 1%, the strongest capital-growth phase of the cycle is often already underway, and entry prices have moved.
HtAG’s view is that supply and demand should always be read across at least five dimensions, with each indicator weighted differently depending on where the suburb sits in the Growth Rate Cycle. A market in the recovery phase needs different evidence than one already in expansion.
The 5 Supply and Demand Signals That Predict Suburb Growth
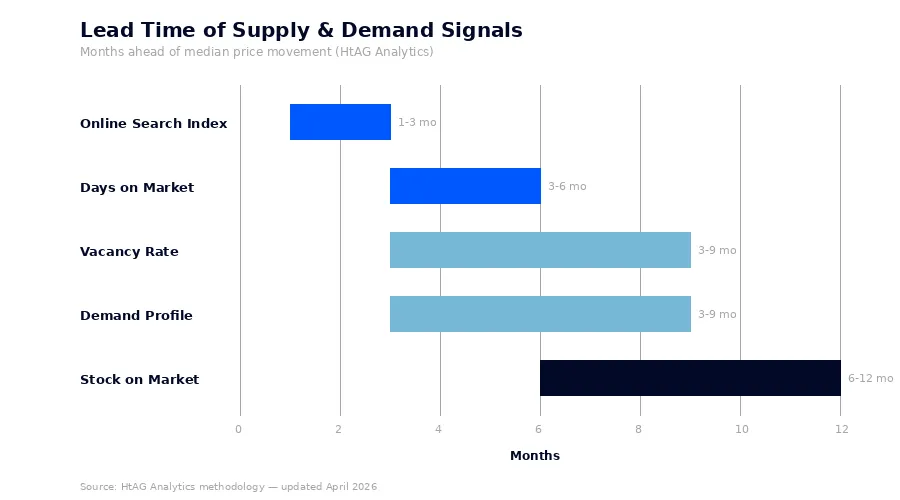
HtAG Analytics tracks five core supply-and-demand signals across every suburb in Australia. Each measures a different facet of the market, and together they form a directional consensus that moves ahead of median price changes. The five signals are: stock on market, days on market, vacancy rate, online search index, and the demand profile composite.
| Signal | Side | What It Measures | Favourable Threshold | Lead Time |
|---|---|---|---|---|
| Stock on Market (SOM) | Supply | % of total dwelling stock listed for sale | Below 1.5%, declining | 6–12 months |
| Days on Market (DOM) | Supply / friction | Median days a listing stays active before sale | Below 60 days, falling | 3–6 months |
| Vacancy Rate | Demand (rental) | % of rental stock vacant in any given month | Below 2%, tightening | 3–9 months |
| Online Search Index | Demand (intent) | Buyer search activity per listing | Above 100, rising | 1–3 months |
| Demand Profile | Demand (composite) | Quintile blend of search, buyer-to-listing, hold period | Quintile 4 or 5 | 3–9 months |
Signal 1: Stock on Market (SOM)
Stock on Market is the percentage of total dwelling stock in a suburb currently listed for sale. It is the cleanest measure of supply scarcity. A suburb with 4,000 dwellings and 40 active listings has an SOM of 1.0%. The lower the number, the tighter the market.
According to HtAG Analytics data, suburbs with a stock-on-market reading below 1.5% and a downward 12-month trend have historically delivered median annualised growth roughly 4–6 percentage points above the national median in the subsequent 12 months. The signal is strongest when SOM is both low and falling — a static low number can simply reflect a thinly traded market with limited turnover.
You can visualise stock-on-market trends across thousands of suburbs simultaneously using the GeoDex heatmap, which colour-codes every Australian suburb by current supply tightness. For a deeper read on how this metric behaves across the cycle, see HtAG’s explainer on the property market outlook through the lens of stock on market.
Signal 2: Days on Market (DOM)
Days on Market is the median number of days a property listing stays active before selling. It measures friction in the sales process and is one of the fastest-moving supply-and-demand indicators available. A suburb where DOM falls from 90 to 45 days over six months is signalling rapidly accelerating buyer absorption.
HtAG Analytics’ analysis of metropolitan markets shows that DOM contractions of 30%+ over a rolling 12-month window have preceded median price growth of 8–14% in the following 12 months in roughly two-thirds of observed cases. The threshold to watch: anything below 60 days, with a clear downward trend, indicates a market where buyers are competing for limited stock. HtAG’s deeper piece on days on market and vendor discounting unpacks the mechanics in more detail.
Signal 3: Vacancy Rate
Vacancy rate is the percentage of rental stock unoccupied in any given month. It is the most widely cited supply-and-demand metric in Australian property analysis, but it measures only the rental side of the market and tends to lag capital-growth movements.
The Real Estate Institute of Australia and SQM Research both define a “balanced” vacancy rate as 3.0%. Anything below 2% indicates a tight rental market with rent growth pressure; anything below 1% is severe undersupply. According to HtAG Analytics data, suburbs that have remained below 1.5% vacancy for four or more consecutive quarters tend to also exhibit accelerating Growth Rate Cycle readings on the capital-growth side, validating the demand pressure across both rent and sale dimensions.
Signal 4: Online Search Index
The online search index measures buyer search activity relative to active listings in a suburb. A reading of 100 represents the long-term average; readings above 100 indicate above-average buyer interest per listing, and below 100 indicate softening intent. It is the leading-edge demand signal — buyer intent shows up in search behaviour before it shows up in sales.
Search indices above 150, sustained for three consecutive months, are one of the earliest reliable indicators that a suburb is moving from the recovery phase into expansion. HtAG’s methodology piece on the online buy/rent search interest index sets out how this metric is constructed and why it leads. Because the data lead time is short — typically 1 to 3 months — search-index movements can validate or contradict the slower-moving stock-on-market and days-on-market signals.
Signal 5: Demand Profile
The demand profile is HtAG’s composite demand indicator, blending search intensity, buyer-to-listing ratio, hold period, and turnover. It is reported as a quintile from 1 (weakest demand) to 5 (strongest demand) for every suburb in Australia. The composite design smooths out the noise that any single demand metric carries.
HtAG Analytics’ analysis suggests demand-profile quintiles 4 and 5 are the operating zone for most short-to-medium term capital-growth strategies. Quintile 5 in particular tends to coincide with the late-recovery / early-expansion phase of the Growth Rate Cycle — the window where entry prices are still moderate but buyer competition is already intensifying.
How to Combine the Five Signals into One Decision
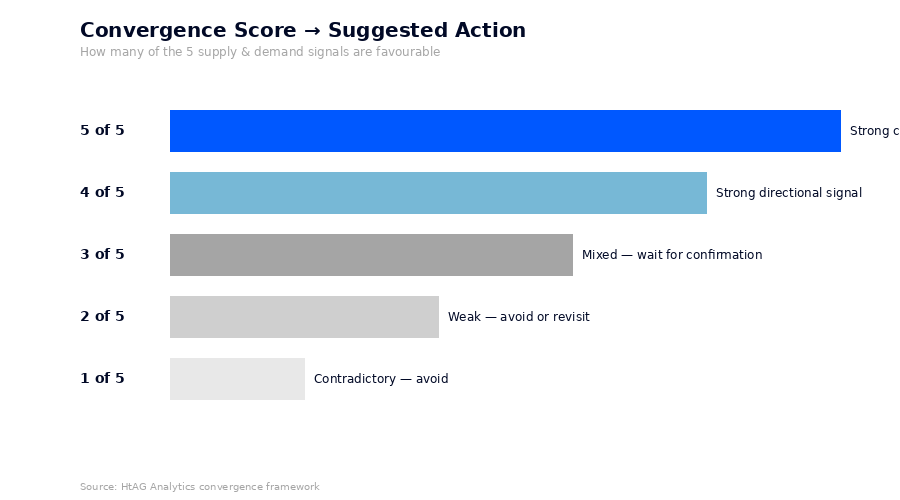
No single supply-and-demand signal is reliable in isolation. The discipline that separates data-driven property investors from headline-chasers is the willingness to require convergence across multiple indicators before acting. HtAG’s recommended framework is to score every suburb across all five signals and require at least four of five to be favourable before considering it for due diligence.
| Convergence Score | Interpretation | Suggested Action |
|---|---|---|
| 5 of 5 favourable | Strong consensus — supply and demand both pointing toward growth | Prioritise for deeper due diligence |
| 4 of 5 favourable | Strong directional signal, one indicator unconfirmed | Investigate the lagging indicator before committing |
| 3 of 5 favourable | Mixed — market in transition | Wait for additional confirmation |
| 2 or fewer favourable | Weak or contradictory signals | Avoid or revisit in 6 months |
This convergence approach is more conservative than chasing single-metric heatmaps, but the discipline materially reduces false positives. Across HtAG’s tracked recommendations on the Evidence Portal, suburbs that scored 4 of 5 or higher at the time of recommendation have substantially outperformed those that scored 3 or below.
Reading Convergence Through the Growth Rate Cycle
The supply-and-demand signals you should weight most heavily depend on where the suburb sits in the broader market cycle. In the recovery phase, stock-on-market and days-on-market contraction are the most predictive — they move first. In the expansion phase, demand-side indicators (search index and demand profile) become more important. In late expansion, the absence of any supply loosening is the key signal that the run still has room.
For an explanation of how cycles fit into the broader investment framework, see the published guide to the four phases of the Australian property market cycle.
Worked Example: Reading Supply and Demand for a Single Suburb
The framework only becomes useful when you apply it to a real suburb. Below is a hypothetical worked example based on the data shapes typical of an Australian outer-metropolitan house market currently transitioning out of recovery.
| Signal | Current Reading | 12-Month Trend | Verdict |
|---|---|---|---|
| Stock on Market | 1.2% | Down from 2.1% | Favourable |
| Days on Market | 48 days | Down from 72 days | Favourable |
| Vacancy Rate | 1.4% | Stable, low | Favourable |
| Online Search Index | 132 | Up from 95 | Favourable |
| Demand Profile | Quintile 4 | Up from Q3 | Favourable |
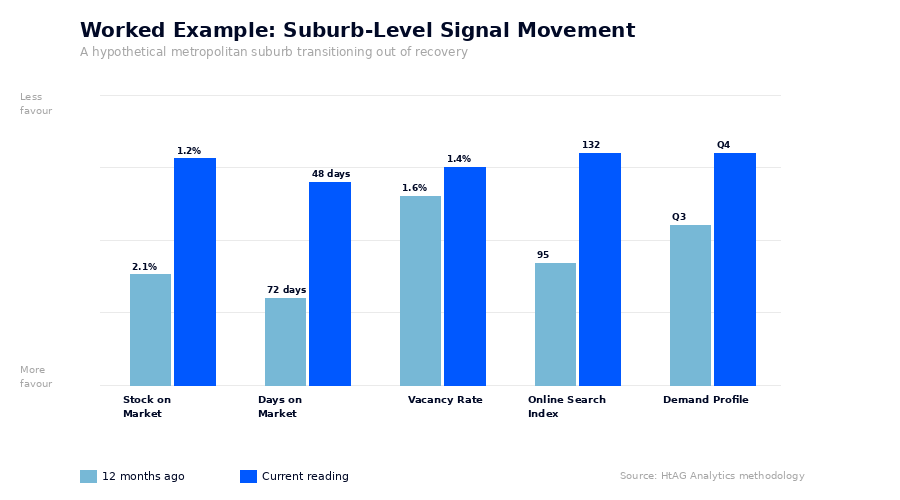
This hypothetical suburb scores 5 of 5 favourable — supply is tightening, listings are clearing fast, rentals are scarce, and buyer intent is rising sharply. Under HtAG’s framework this would prompt deeper due diligence including median-price band check, IRSAD socio-economic positioning, public housing concentration, and lender appetite. The supply-and-demand convergence has done its job: it has surfaced a candidate worth deeper investigation.
Critically, this same suburb may have an unremarkable median price growth reading over the trailing 12 months. The supply-and-demand consensus is the forward-looking evidence that the median is about to follow.
Common Mistakes Investors Make Reading Supply and Demand
Even sophisticated investors fall into predictable traps when interpreting supply-and-demand data. Three mistakes recur across thousands of investor briefings HtAG has reviewed.
- Anchoring on a single metric. Vacancy rate is the most over-relied-on supply-and-demand indicator in Australian property. By itself it tells you about rental scarcity at a single point in time, but says nothing about buyer absorption, listing velocity, or search intent.
- Confusing low turnover with low supply. A thinly traded suburb can show low stock on market simply because nobody is selling. Without rising days-on-market velocity and demand-side confirmation, low SOM may indicate a sleepy market, not an opportunity.
- Reading LGA averages instead of suburb data. Council-level averages routinely mask significant suburb-by-suburb variation. A council showing balanced supply might contain individual suburbs at both extremes. See the published comparison on LGA vs suburb-level property data for the size of the gap.
The fourth recurring trap — using median price growth as a supply-and-demand proxy — is worth its own piece. Median price is the output of supply and demand pressures, not a measurement of them. By the time the median moves, the underlying signals have moved months earlier. For more on the limits of medians, see the median vs typical price piece.
Key Takeaways
- Property supply and demand is multi-dimensional. HtAG Analytics tracks five core signals across every Australian suburb: stock on market, days on market, vacancy rate, online search index, and the demand profile composite.
- The most predictive supply signal is stock on market below 1.5% with a downward 12-month trend. Static low SOM can reflect thinly traded markets rather than scarcity.
- Days on market is the fastest-moving signal — DOM contractions of 30% or more over 12 months have preceded median price growth of 8–14% in roughly two-thirds of metropolitan cases analysed.
- Vacancy rate alone is a lagging indicator. The 1.5% threshold matters, but should be confirmed by tightening supply and rising demand on the sale side.
- The convergence rule: require at least four of five signals to be favourable before progressing a suburb to deeper due diligence. This discipline materially reduces false positives.
- The supply-and-demand consensus is forward-looking. By the time a suburb’s median price reflects the shift, entry conditions have already changed.
From Data Signal to Portfolio Decision
Reading supply-and-demand convergence across 7,000+ Australian suburbs by hand is impossible. The five signals described above sit inside the HtAG Analytics platform and update on a quarterly cadence — colour-coded on the heatmap, ranked in the suburb tables, and integrated into every investment scorecard.
HtAG’s Starter Plan gives investors and buyers agents direct access to the supply-and-demand signal set, the GeoDex heatmap, and the suburb-level scorecards used in the framework above. For active members, the same data feeds the Market in Motion dashboards, the Evidence Portal of validated recommendations, and the live forecasts published in the Australian Property Forecast 2026.
Get started: claim the introductory subscription discount via the HtAG Starter Plan and apply the convergence framework to any suburb in Australia tonight.
FAQs: Supply and Demand in the Australian Property Market
What is the most important supply and demand metric in Australian property?
No single metric is most important — convergence across multiple indicators is what predicts price movement. That said, stock on market combined with days on market is HtAG Analytics’ most reliable supply-side pair, and the demand profile composite is the strongest single demand-side reading. Vacancy rate, while widely cited, is a lagging single-dimension indicator and should not be used alone.
How long do supply and demand signals lead price changes?
Lead times vary by signal. The online search index leads by 1 to 3 months, days on market by 3 to 6, vacancy and demand profile by 3 to 9, and stock on market by 6 to 12. When all five tighten in the same direction, capital growth has historically followed within 6 to 12 months.
What stock on market percentage indicates a tight property market?
Stock on market below 1.5% with a downward 12-month trend indicates a tight, supply-constrained market. Below 1.0% is severe scarcity. The trend matters as much as the level — a flat 1.2% in a thinly traded suburb is a different signal than 1.2% reached by a sustained downward trajectory from 2.5%.
Can supply and demand analysis predict the next property hotspot?
Convergent supply-and-demand signals are one of the earliest reliable inputs into hotspot identification, but they are not sufficient on their own. A complete shortlist also requires socio-economic context, a credible price band, lender appetite, and risk filters such as public housing concentration. HtAG’s published suburb growth forecasts for 2026 combine all of these layers into ranked outputs.
Where can I find live supply and demand data for Australian suburbs?
HtAG Analytics publishes the five-signal supply-and-demand dataset for every Australian suburb on the platform, updated quarterly. The fastest entry point is the GeoDex heatmap, which colour-codes suburbs by current convergence. Free educational pieces like this article cover the methodology; the live data sits behind the platform subscription.
Supply on its own is a level; what usually matters more is the direction it is moving. For the framework that separates a tight market from a tightening one — and the four archetypes it produces — see Supply Scarcity: the four archetypes that separate tight from tightening.
Disclaimer: This article is general information only and does not constitute financial, investment, tax, or legal advice. Property investment carries risk including capital loss. Statistics referenced reflect general patterns observed in HtAG Analytics’ platform data and should not be interpreted as guarantees of future performance. Always seek advice from licensed professionals before making investment decisions.