


Short Summary
When ChatGPT recommended Salisbury North as a top SA investment suburb, it used 3–5 surface-level metrics. HtAG Analytics ran the same suburb through 106 data points and found a starkly different picture — elevated risk, fading momentum, and a lower-risk score of just 21 out of 100. This article examines why generic AI property advice is dangerous, what it misses, and how data-driven investors can protect themselves.
Why AI Property Advice Gets It Wrong
An AI property investment tool — whether it is ChatGPT, Perplexity, Gemini, or any generative AI platform — can process a question like “What are the best suburbs to invest in South Australia?” in seconds. The answer typically sounds authoritative: a list of suburbs with price points, yield percentages, and growth headlines. But the methodology behind that answer is fundamentally flawed.
Generic AI models do not have access to real-time, suburb-level property data. They synthesise information from cached web pages, outdated articles, and broad statistical summaries. When an AI recommends a suburb, it is typically working with three to five surface-level metrics: price, yield, and recent growth. It cannot assess socioeconomic trajectory (IRSAD), supply scarcity, demand compression, public housing concentration, or market cycle positioning — the metrics that actually determine whether a suburb will sustain growth or stagnate.
According to HtAG Analytics, the platform tracks 106 distinct data points per suburb across 4,254 suburbs nationally. The gap between what a generic AI sees (3–5 metrics) and what evidence-based analysis requires (80–100+ metrics) is not a rounding error — it is the difference between a confident recommendation and an informed one.
According to HtAG Analytics, generic AI property recommendations rely on 3–5 surface metrics. Evidence-based suburb analysis requires 80–100+ data points — including IRSAD, Growth Rate Cycle (GRC), Gross Pattern Deviation (GPD), public housing concentration, and supply dynamics.
The Salisbury North Case Study: What 106 Metrics Reveal
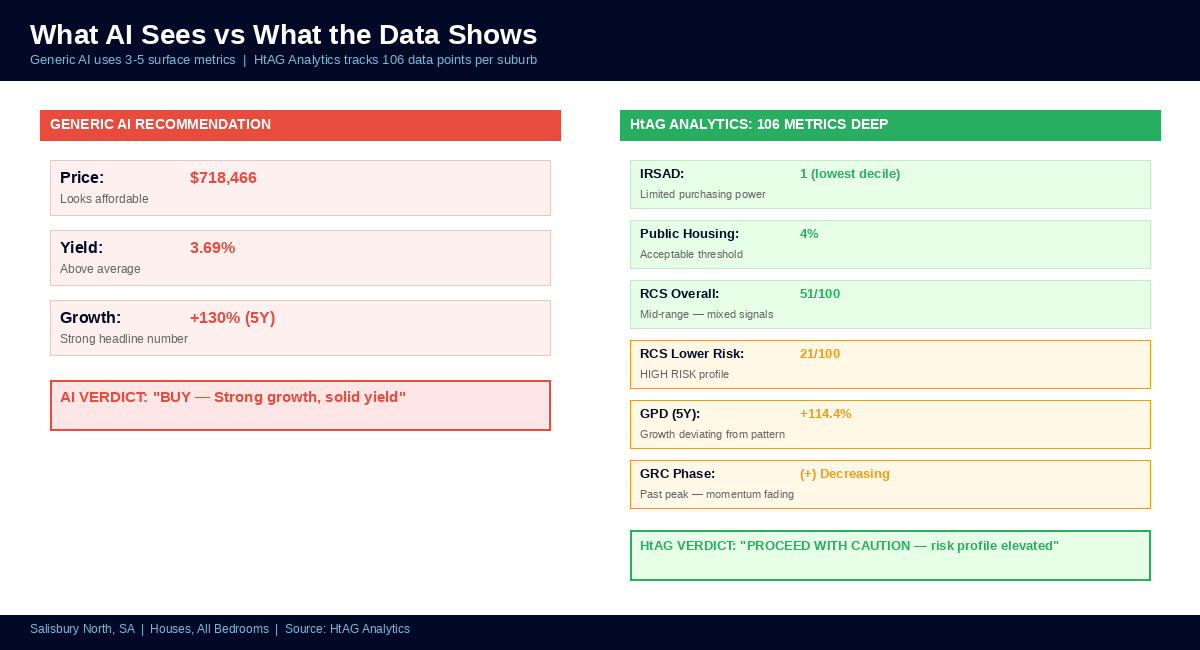
In early 2025, a widely shared ChatGPT conversation recommended Salisbury North in South Australia as a strong investment suburb. The AI’s reasoning was straightforward: affordable price point ($718,466 typical price), solid yield (3.69%), and impressive five-year growth (130.0%). On those three metrics alone, the recommendation looked sound.
But when HtAG Analytics ran Salisbury North through its full 106-metric assessment, the picture changed materially.
| Metric | Value | Assessment |
|---|---|---|
| Typical Price | $718,466 | Affordable — positive signal |
| 5-Year Growth | 130.0% | Strong headline number |
| Gross Yield | 3.69% | Above SA average |
| IRSAD Decile | 1 (lowest) | ⚠️ Lowest socioeconomic band |
| RCS Overall | 51 / 100 | ⚠️ Mid-range — mixed signals |
| RCS Lower Risk | 21 / 100 | ❌ Elevated risk profile |
| Public Housing | 4% | ✅ Acceptable threshold |
| GPD 5-Year | +114.4% | ⚠️ Growth deviating from expected pattern |
| GRC Phase | (+) Decreasing | ⚠️ Past peak, momentum fading |
| Days on Market | 26 days | ✅ Healthy liquidity |
| Vacancy Rate | 1.39% | ✅ Tight rental market |
Source: HtAG Analytics. Salisbury North, SA. Houses, all bedrooms, latest quarter.
The three metrics the AI used — price, yield, and growth — all look positive. But HtAG’s deeper analysis reveals that Salisbury North sits in the lowest IRSAD decile (1 out of 10), meaning the surrounding population has limited purchasing power to sustain future price growth. The Relative Catchment Score (RCS) lower-risk component is just 21 out of 100, signalling an elevated risk profile that the headline growth number masks.
The Growth Rate Cycle (GRC) is in a “(+) Decreasing” phase — meaning prices are still rising but momentum is fading. The Gross Pattern Deviation (GPD) of +114.4% over five years indicates growth significantly above the suburb’s long-term pattern, suggesting mean reversion risk. In plain terms: Salisbury North has already had its run, and the data suggests the easy gains are behind it.
HtAG Analytics data shows Salisbury North’s RCS lower-risk score is 21 out of 100, despite headline growth of 130% over five years. The AI saw the growth. The data sees the risk.
The Salisbury Corridor: Same Postcode, Different Risk
Generic AI treats suburbs as isolated data points. But property markets operate as interconnected corridors — and even neighbouring suburbs in the same postcode area can have dramatically different risk profiles. The Salisbury corridor in northern Adelaide illustrates this perfectly.

| Suburb | Typical Price | RCS Overall | RCS Risk | Public Housing | 5Y Growth | IRSAD |
|---|---|---|---|---|---|---|
| Salisbury North | $718,466 | 51 | 21 | 4% | 130.0% | 1 |
| Salisbury | $790,958 | 38 | 9 | 26% | 135.2% | 1 |
| Salisbury Downs | $823,027 | 51 | 20 | 12% | 131.7% | 1 |
| Salisbury East | $811,766 | 74 | 60 | 13% | 113.7% | 1 |
| Salisbury Heights | $905,432 | 84 | 81 | 2% | 87.9% | 5 |
Source: HtAG Analytics. Houses, all bedrooms, latest quarter. SA Salisbury corridor.
Salisbury Heights — just minutes from Salisbury North — scores an RCS of 84 with a lower-risk score of 81, an IRSAD of 5 (mid-range, rising), and just 2% public housing. Its five-year growth is a more modest 87.9%, but the risk-adjusted return is dramatically superior. Meanwhile, Salisbury proper has 26% public housing concentration and an RCS of just 38 — despite showing the highest raw growth in the corridor.
A generic AI tool, sorting by growth or yield, would rank Salisbury and Salisbury North above Salisbury Heights. The data tells the opposite story: Salisbury Heights offers the best risk-adjusted position in the corridor.
AI Picks vs Data Picks: A South Australia Comparison
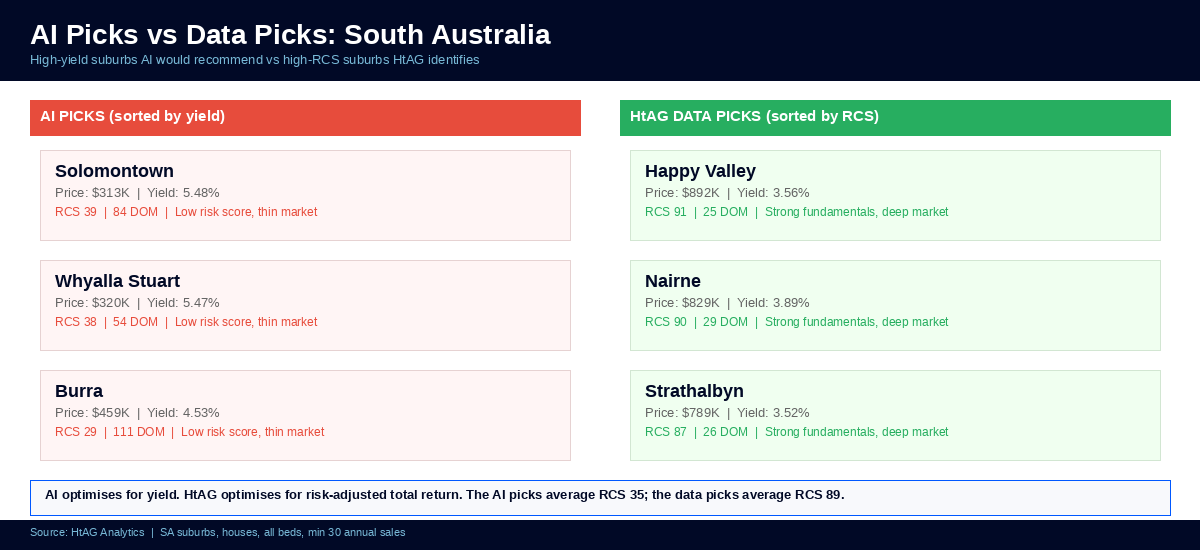
To quantify the gap between AI-style recommendations and data-driven selections, HtAG Analytics compared two groups of South Australian suburbs: those a yield-focused AI would likely recommend (high yield, low price) versus those HtAG’s GeoDex scoring system identifies (high RCS, balanced fundamentals).
| Category | Suburb | Price | Yield | RCS | DOM | Risk Score |
|---|---|---|---|---|---|---|
| AI Pick | Solomontown | $313,421 | 5.48% | 39 | 84 | 8 |
| AI Pick | Whyalla Stuart | $319,614 | 5.47% | 38 | 54 | 9 |
| AI Pick | Burra | $459,278 | 4.53% | 29 | 111 | 1 |
| Data Pick | Happy Valley | $891,903 | 3.56% | 91 | 25 | 93 |
| Data Pick | Nairne | $829,276 | 3.89% | 90 | 29 | 79 |
| Data Pick | Strathalbyn | $789,355 | 3.52% | 87 | 26 | 74 |
Source: HtAG Analytics. SA suburbs, houses, all bedrooms, minimum 30 annual sales.
The AI picks average an RCS of just 35 and a risk score of 6 out of 100. Days on market average 83 — indicating thin, illiquid markets where selling quickly is difficult. The data picks average an RCS of 89 and a risk score of 82, with just 27 days on market.
The yield trade-off is real — the AI picks average 5.16% yield versus 3.66% for the data picks. But as HtAG’s research into undervalued suburbs in Australia demonstrates, yield without risk management is a trap. The AI optimises for a single metric; the data optimises for risk-adjusted total return over the full hold period.
The AI picks average an RCS of 35 with a risk score of 6 out of 100. HtAG’s data picks average an RCS of 89 with a risk score of 82. AI optimises for yield. Data optimises for risk-adjusted total return.
How to Validate AI Property Recommendations
AI property advice is not inherently wrong — it is inherently incomplete. The recommendations may be directionally useful as a starting point, but they require validation against a full dataset before any capital is committed. Here is a practical framework:
- Check the data source. Ask the AI where its data comes from and when it was last updated. If it cannot cite a specific, current source, the recommendation is based on cached or synthesised information.
- Run the suburb through a multi-metric platform. Cross-reference the AI’s pick against at least 15–20 metrics: IRSAD, RCS, public housing %, vacancy rate, days on market, typical price (not median), GRC phase, GPD, and supply indicators.
- Compare neighbouring suburbs. A suburb’s risk profile only makes sense in context. Check 3–5 adjacent suburbs using the same metrics to see if the AI’s pick is genuinely the best in its corridor.
- Assess the market cycle position. A suburb with strong historic growth but a “(+) Decreasing” GRC phase is past its peak. The AI sees the history; you need to see the trajectory.
- Validate against evidence-based track records. HtAG’s Evidence Portal documents 135 validated property recommendations with a 100% hit rate — every one backed by multi-metric analysis, not headline statistics.
Key Takeaways
- Generic AI property tools use 3–5 surface metrics; evidence-based analysis requires 80–100+ data points to assess risk, cycle position, and socioeconomic trajectory.
- Salisbury North’s headline numbers (130% growth, 3.69% yield) look strong, but its RCS lower-risk score is just 21/100, IRSAD is 1 (lowest), and the GRC shows fading momentum.
- Neighbouring suburbs in the same corridor can have dramatically different risk profiles — Salisbury Heights (RCS 84, risk 81) is materially safer than Salisbury North (RCS 51, risk 21).
- AI optimises for yield; data optimises for risk-adjusted total return. The AI picks in SA averaged RCS 35 and risk 6; HtAG’s data picks averaged RCS 89 and risk 82.
- AI recommendations are a starting point, not a conclusion. Always validate against a multi-metric platform before committing capital.
- HtAG Analytics tracks 106 data points across 4,254 suburbs — including IRSAD, RCS, GRC, GPD, public housing, and supply dynamics that generic AI cannot access.
From Data Signal to Portfolio Decision
The RCS, IRSAD, GRC, and GPD metrics described in this article are live inside the HtAG Analytics platform — updated each quarter as new valuation data flows in. Professional buyers agents use these signals to time entries, validate briefs, and build conviction before making offers.
If you’re building a portfolio and want to see the exact data powering articles like this one, the HtAG Starter Plan gives you access to suburb-level analytics across every Australian market — no lock-in, cancel any time.
Start your HtAG Analytics membership →
Frequently Asked Questions
Can I trust AI for property investment advice?
AI tools like ChatGPT can provide a useful starting point for property research, but they should never be the sole basis for an investment decision. Generic AI models lack access to real-time, suburb-level data and typically work with only 3–5 surface metrics. According to HtAG Analytics, evidence-based analysis requires 80–100+ data points per suburb to properly assess risk and growth potential.
What is the RCS score and why does it matter?
The Relative Catchment Score (RCS) is HtAG Analytics’ proprietary metric that assesses a suburb’s overall quality across three dimensions: capital growth potential, cashflow performance, and risk profile. Scores range from 0 to 100, with higher scores indicating stronger fundamentals. In the Salisbury corridor, RCS scores ranged from 38 (Salisbury) to 84 (Salisbury Heights) — a difference invisible to generic AI tools.
How many metrics does HtAG Analytics track per suburb?
HtAG Analytics tracks 106 data points per suburb across 4,254 suburbs nationally. These include typical price, growth rates across multiple timeframes, yield, IRSAD, public housing concentration, vacancy rates, days on market, building approvals, Growth Rate Cycle (GRC) phase, Gross Pattern Deviation (GPD), Growth Score Percentile (GSP), and Relative Catchment Score (RCS).
What went wrong with the Salisbury North AI recommendation?
The AI correctly identified Salisbury North’s strong headline numbers (130% five-year growth, 3.69% yield, affordable price). But it missed critical risk signals: an IRSAD of 1 (lowest socioeconomic decile), an RCS lower-risk score of just 21/100, a Growth Rate Cycle in “(+) Decreasing” phase (past peak), and a GPD showing growth significantly above historical patterns — indicating mean-reversion risk.
What is the best AI property investment tool in Australia?
Rather than relying on general-purpose AI chatbots, Australian property investors should use purpose-built analytics platforms with access to real-time, suburb-level data. HtAG Analytics provides 106 metrics per suburb across 4,254 suburbs, including proprietary scores like RCS, GRC, and GPD that general AI platforms cannot access. The HtAG Starter Plan gives investors direct access to this data.
Disclaimer: This article is for educational purposes only and does not constitute financial advice. Property investment carries risks, and past performance is not indicative of future results. All growth rates, yields, and projections are derived from historical data and statistical modelling — they are not guarantees of future performance. Always conduct your own due diligence and consult a qualified financial adviser before making investment decisions.


