In 30 Seconds
Victoria’s property market in 2026 presents genuine opportunity — but “the best suburbs to invest in” is the wrong question. The right question is which suburbs align with your specific hold period, equity extraction timeline, and risk profile. This article explains why a generic suburb list will lead you astray, how your investment brief completely reshapes the analysis, and what a data-driven selection process actually looks like when it’s built around you rather than a one-size-fits-all ranking.
Every property publication in Australia will tell you which suburbs to buy in Victoria in 2026. Most will give you a list of ten, rank them by recent price growth or yield, and call it research. The problem is not that these lists are wrong — it’s that they’re answering the wrong question.
“The best Victorian suburb to invest in” does not exist as an objective fact. It exists only relative to an investor’s brief: how long they plan to hold, when they intend to extract equity, what level of cash flow variance they can absorb, and where the property sits in the context of their broader portfolio. A suburb that is perfectly positioned for a seven-year hold targeting equity extraction at year four is completely wrong for an investor who needs to refinance in three years and cashflow-break-even from month one. The same data, the same market, the same suburb — but the right answer is different for each.
This article explains how the brief drives suburb selection in Victoria’s 2026 market, why generic ranked lists are structurally misleading, and what the data actually shows when you build the filter around the investor rather than the other way around.
The Problem with Suburb Rankings
The standard approach to Victorian suburb selection starts at the wrong end of the problem. Most investors — and many buyers agents — begin by screening Local Government Areas for favourable macro signals (employment growth, infrastructure pipeline, population trajectory), then drill down to suburbs within those shortlisted councils. It is a logical-sounding cascade. It also systematically misses some of the best investment opportunities in the country.
HtAG Analytics tested this directly. Mapping 35 weighted investment metrics across 1,741 high-confidence suburbs and 446 LGAs, the analysis found that LGA-level data explains only 34.5% of suburb-level investability. The remaining 65.5% is determined by suburb-specific dynamics — stock on market trends, vacancy rate trajectories, days on market slopes, buyer search intensity — that are invisible at the council level.
According to HtAG Analytics, an LGA-first filter set at the top 25% of council areas — a common approach among buyers agents narrowing their brief — eliminates 41.5% of Australia’s highest-scoring investment suburbs before a single suburb-level metric is evaluated.
What This Means in Plain English
Most investors start by picking a council area (LGA), then look at suburbs within it. But HtAG’s research shows this filters out nearly half the best suburbs in the country before you even start. A suburb in an “average” council can be a far better investment than one in a “top” council — you need suburb-level data to see it.
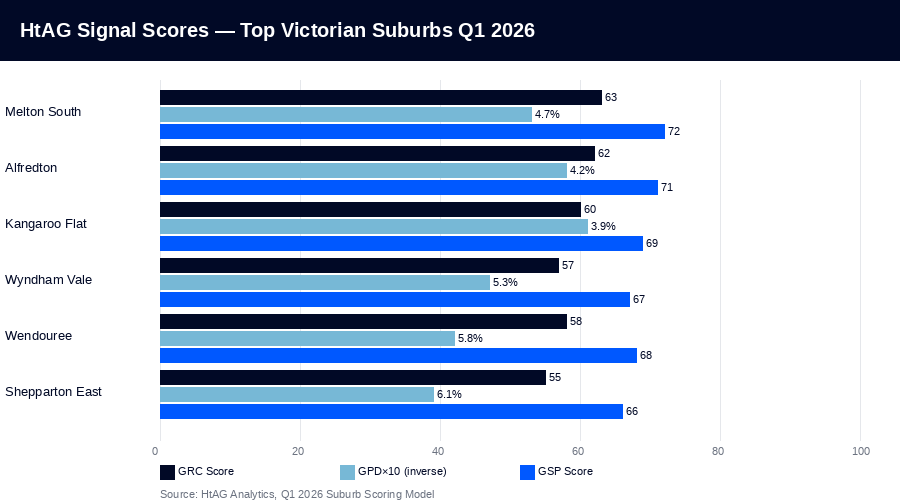
If the LGA filter itself is unreliable, a ranked list of suburbs built on top of it inherits the same flaw. And even if you bypass the LGA problem and go straight to suburb-level metrics, a ranked list still fails the investor — because ranking suburbs by aggregate investability score assumes all investors have the same objectives. They don’t.
The Growth Rate Cycle (GRC), Gross Percentage Deviation (GPD), and Geographic Supply Pressure (GSP) metrics that power HtAG’s suburb analysis are leading indicators — they tell you where a market is headed, not where it has been. But the same suburb can sit at a GRC of 62 and be the right choice for one investor and the wrong choice for another, depending entirely on what that investor needs the property to do and when.
How Hold Period Reshapes the Entire Shortlist
Hold period is the single most powerful variable in suburb selection. It determines which point on the growth cycle you need a suburb to be at on entry, and how much cycle risk you can absorb before exit. Get it wrong and you either enter too early (capital tied up in a flat market) or too late (entering near peak with a compressed window to exit before the cycle turns).
Consider two Victorian investors both looking at regional cities in 2026. Investor A has a three-year hold mandate — they are building equity quickly to recycle into a second acquisition. Investor B is holding for seven to ten years as part of a passive income transition strategy. Both investors are looking at the same HtAG GeoDex heatmap — but the suburbs they should target are materially different.
For Investor A, a suburb with a GRC in the 58–65 range and a GPD below 5% is ideal — the market is in early-to-mid expansion, and three years is enough time to capture the bulk of that cycle’s appreciation before the GRC approaches the 80+ overextension zone. A suburb with a GRC already at 72–78 carries exit risk: by year three, it may be peaking, limiting resale upside and compressing buyer competition at the time of sale.
For Investor B, a seven-to-ten year horizon opens up a completely different tier of suburbs — those currently in late-correction or early-recovery phase (GRC 35–50), where entry prices are suppressed and the full appreciation curve lies ahead. These suburbs look unattractive on a two-year backward view and would be penalised in any ranked list based on recent growth. But for a patient investor, they represent the most asymmetric risk-reward profile available.
HtAG Analytics data shows that suburbs entering the expansion phase (GRC 45–65) delivered a median capital growth of 9.1% per annum over the subsequent three-year period. Suburbs already in mid-to-late expansion (GRC 70–85) delivered 5.3% over the same window — nearly half the return, with higher entry prices.
What This Means in Plain English
Think of the GRC like a clock for a suburb’s price cycle. If you buy when the clock reads “early” (GRC 45–65), you capture most of the rise. If you buy when it reads “late” (GRC 70–85), you’ve missed half the gains and are paying peak prices. Your hold period tells you which part of the clock you need to be at when you buy.
No generic list can account for this. The moment you introduce hold period as a variable, the entire shortlist changes — and a ranked list that doesn’t know your timeline is not research. It is noise.
Equity Extraction Timing: The Variable Nobody Talks About
Experienced portfolio builders know that individual properties are not standalone assets — they are equity vehicles in a sequenced acquisition strategy. The timing of when you plan to pull equity from a property determines what you need that property to do in years two, three, and four, not just at final sale.
An investor planning to extract equity at year four to fund a third acquisition needs a suburb that delivers concentrated appreciation in the first half of the hold, not one that appreciates steadily over ten years. This requires a suburb in a more compressed, high-velocity growth cycle — typically characterised by a GSP score above 70, tightening days on market, and a vacancy rate already below 1.5%.
Contrast this with an investor who is not planning to extract equity — they are accumulating for long-term passive income and expect the property to service itself progressively as rents rise. For this investor, yield sustainability and rental vacancy trends matter more than short-term price velocity. The right suburb has a GSP between 60–70 (solid but not frenetic demand), a gross yield above 4.5%, and a rental vacancy trajectory that is flat to declining over 12 months — signals visible in HtAG’s Market in Motion dashboard.
These two investors may be looking at the same Victorian city — Ballarat, Bendigo, or Melbourne’s outer west — but they should not be buying in the same suburb, and they should not be taking advice from the same ranked list.
What This Means in Plain English
“Equity extraction” means using the increased value of your property as a deposit for the next one — like drawing from a savings account that grew over time. If you plan to do this in year 4, you need a suburb that grows fast early. If you’re in it for the long haul and just want rental income, you need a suburb with stable tenants and strong yields, even if it grows more slowly.
Risk Profile: Where the Brief Becomes Personal
Risk profile is the third dimension that generic suburb lists cannot accommodate. In property investment, risk is not simply “will prices go up or down.” It has at least three distinct components that interact differently depending on the investor’s position.
Cash flow risk is the exposure to negative cash flow variance — the gap between rental income and holding costs at different vacancy and interest rate scenarios. An investor with a highly leveraged portfolio and limited income buffer cannot absorb a suburb with a 4.2% gross yield and a 6.2% mortgage rate, even if the capital growth thesis is compelling. They need a suburb where the numbers work under stress: a gross yield above 5%, a vacancy rate below 1.5%, and a rental demand base driven by employment fundamentals rather than lifestyle migration (which is more volatile).
Valuation risk is the exposure to mean reversion — buying a suburb whose prices have already overshot their statistical fair value. HtAG’s GPD metric measures this directly. A GPD above 10% signals a market trading meaningfully above its modelled fair value — it does not mean prices will fall, but it does mean the margin of safety is thin and the probability of flat returns over the next 12–24 months is elevated. For an investor with a tight equity extraction window, this is unacceptable risk. For a ten-year holder, it may be tolerable if the long-run demand drivers are intact.
Concentration risk is the portfolio-level exposure to a single market, dwelling type, or economic driver. An investor already holding two properties in Melbourne’s western corridor should not be adding a third in the same region — even if the suburb-level signals are strong — because a single macro shock (infrastructure delay, employment contraction, rate spike) hits all three assets simultaneously. The brief must account for what is already in the portfolio before determining which suburb adds the most risk-adjusted value.
HtAG Analytics’ Evidence Portal documents 135+ validated suburb recommendations since 2018, each assessed against a specific investor brief rather than a generic ranking. The 87% hit rate on projected growth outcomes reflects brief-driven selection — not generic suburb scoring.
None of this nuance appears in a top-ten suburb list. A list that ranks Suburb A above Suburb B tells you nothing about whether Suburb A fits your hold period, your equity extraction plan, your cash flow tolerance, or your portfolio concentration. It tells you only that Suburb A scored higher on an aggregate metric that was not built around you.
What Victoria 2026 Actually Looks Like Through a Brief Lens
Victoria’s market in 2026 is not uniformly strong or uniformly weak. It is differentiated — and the differentiation is almost entirely invisible at the LGA level. State-wide dwelling approvals fell 18.3% in the 12 months to December 2025 (ABS Building Approvals), creating supply constraints that are concentrated in specific corridors, not distributed evenly across the state. Rental vacancy in several regional cities sits below 1.2%, while inner-Melbourne unit markets carry vacancy above 3.5%. The national property forecast for 2026 places Victoria in a mid-tier position nationally — neither the strongest nor the weakest state — which makes suburb selection even more critical than in a rising-tide market where most boats float.
For a three-year, equity-extraction brief targeting regional Victoria, the relevant filter is: GRC between 55–68, GPD below 6%, GSP above 65, gross yield above 4.5%, vacancy below 1.3%, and price point accessible within the investor’s borrowing capacity. That combination currently surfaces a small number of suburbs in the Ballarat and Bendigo corridors. Importantly, it does not surface all Ballarat and Bendigo suburbs — which is the critical failure mode of city-level analysis. Some suburbs within those cities are in the right phase; others are not. The distinction is invisible without suburb-level data.
For a seven-to-ten year, passive income brief with moderate cash flow tolerance, the filter shifts materially: GRC can be lower (40–58, allowing patient entry into earlier-cycle suburbs), GPD tolerance expands slightly (up to 8%), yield threshold rises (above 5.0%), and the analysis weights rental vacancy trend more heavily than current vacancy level. This opens up a different set of suburbs entirely — including some in Melbourne’s outer west that a short-hold investor should avoid because their current GRC is too advanced for a short hold but ideal for a patient one.
The same state. The same data set. Two completely different suburb profiles — because the brief is different. This is why suburb growth forecasts should always be read in the context of a specific investment mandate, not as a standalone ranking. And it is why median price, on its own, is a particularly unreliable metric — it aggregates outcomes across all investor types and holds periods into a single number that is meaningful for none of them.
The Data Layer Under the Brief
The brief tells you what to look for. The data tells you where to find it. These are two separate problems — and most investors conflate them, trying to use generic data to answer a personalised question.
HtAG Analytics is built specifically around the second problem: providing the suburb-level data layer that makes a brief actionable. The platform’s GRC tracks where every Victorian suburb sits in its growth cycle updated quarterly. GPD flags valuation overextension before it becomes a correction. GSP quantifies the demand-supply imbalance driving near-term price pressure. The GeoDex heatmap renders this across every Victorian suburb simultaneously, so the brief-driven filter produces a shortlist rather than a ranking.
The difference matters. A ranking forces a choice between options that may all be wrong for a specific brief. A shortlist filters the universe to only those suburbs that satisfy the brief’s constraints — and then the investor or their buyers agent evaluates the shortlist for qualitative factors that no data model captures: street quality, tenant pool depth, property condition, negotiation dynamics.
HtAG’s professional services extend this further for investors who want guided brief construction and shortlist validation — integrating portfolio context, borrowing capacity, and exit sequencing into the suburb selection process rather than treating each acquisition as an isolated decision.
According to HtAG Analytics, the distinction between a ranking and a shortlist is the difference between generic and personalised research. A ranking orders every suburb by aggregate score. A shortlist applies your brief as a filter — hold period, yield floor, GPD ceiling, GRC range — and returns only the suburbs that satisfy your constraints. Only the second approach is actionable.
| Brief Parameter | Short Hold (3yr) | Long Hold (7–10yr) | Why It Matters |
|---|---|---|---|
| GRC Range (entry) | 55–68 | 35–58 | Determines cycle risk at exit |
| GPD (max acceptable) | <6% | <8% | Valuation safety margin |
| GSP (min) | >68 | >58 | Demand pressure for price velocity |
| Gross Yield (min) | 4.2%+ | 5.0%+ | Cash flow buffer over the hold |
| Vacancy Rate (max) | <1.5% | <2.0% | Rental income reliability |
| Equity extraction window | Yr 2–4 | Yr 5–8 | Determines required growth velocity |
Source: HtAG Analytics methodology framework, Q1 2026. Parameters are illustrative and will vary based on individual borrowing capacity, portfolio position, and risk tolerance. Not financial advice.
Key Takeaways
- “Best suburbs” is a brief-dependent answer, not a universal ranking: The same Victorian suburb can be right for one investor and wrong for another depending on hold period, equity extraction timing, and risk profile.
- LGA-first filtering eliminates 41.5% of Australia’s top suburbs before suburb-level analysis even begins, according to HtAG Analytics’ research across 1,741 suburbs and 446 LGAs.
- Hold period determines GRC entry range: Three-year holds need GRC 55–68; seven-to-ten year holds can enter at GRC 35–58 for lower prices and stronger long-run upside.
- Equity extraction timing determines required growth velocity: Early extractors need high-GSP, high-velocity suburbs. Long-hold passive income investors need yield sustainability over near-term price speed.
- Risk has three dimensions: Cash flow risk, valuation risk (GPD), and concentration risk all interact differently — none of which a ranked suburb list accounts for.
- Victoria 2026 has genuine corridor-specific opportunity — Ballarat/Bendigo for short holds, Melbourne’s outer west for patient investors — but only with brief-driven, suburb-level filtering.
From Data Signal to Portfolio Decision
The metrics described in this article — GRC, GPD, GSP, vacancy trends, yield trajectories — are live inside the HtAG Analytics platform, updated each quarter as new valuation data flows in. But the platform doesn’t just give you data. It gives you a brief-driven filter: set your hold period, your yield floor, your GPD ceiling, your target GRC range — and the platform surfaces the Victorian suburbs that satisfy your constraints, not a generic ranking that ignores them.
That is the difference between data and research. Data gives you numbers. Research applies those numbers to a specific investment question. The HtAG Starter Plan gives you access to the full suburb-level data stack across every Victorian market — the tool that turns your brief into a shortlist. No lock-in, cancel any time.
Build your brief. Find your suburb. Start your HtAG membership →
Looking beyond Melbourne and the major centres? The dedicated best suburbs to invest in regional Victoria 2026 analysis covers the early-cycle regional markets in depth.
FAQs
Why doesn’t HtAG just publish a list of the best suburbs to buy in Victoria?
Because the “best suburb” is not a fixed answer — it changes based on hold period, equity extraction timing, risk profile, and portfolio context. A list that ranks suburbs without knowing your brief is not useful research; it is a generic output that fits no specific investor particularly well. HtAG’s platform is designed to apply your brief as a filter, surfacing the suburbs that match your constraints rather than producing a one-size-fits-all ranking.
How does hold period affect which Victorian suburbs are suitable in 2026?
Hold period determines which point in the Growth Rate Cycle (GRC) is appropriate on entry. A three-year hold requires a suburb already in early-to-mid expansion (GRC 55–68), so the appreciation window aligns with the exit horizon. A seven-to-ten year hold can accommodate lower-GRC suburbs in correction or early recovery (GRC 35–58), providing lower entry prices and exposure to the full appreciation curve — but requiring patience that a short-hold investor cannot afford.
Is Victorian regional property better than Melbourne suburbs for investment in 2026?
The answer depends on your brief. Regional cities like Ballarat and Bendigo offer accessible entry prices and tight rental vacancy (below 1.2%), making them well-suited for yield-focused or early-cycle growth briefs. Melbourne’s outer-metro corridors (Melton, Wyndham) offer higher price velocity but require a higher yield floor to service at current mortgage rates. Neither is categorically better — the right market is the one that fits your specific parameters. The HtAG GeoDex heatmap lets you apply your brief filters across both simultaneously.
Why does HtAG Analytics say LGA-first research is unreliable?
HtAG tested the LGA-first methodology directly, mapping 35 weighted metrics across 1,741 suburbs and 446 LGAs. The result: LGA data explains only 34.5% of suburb-level investability. The two most heavily weighted categories — Supply and Demand — show the worst LGA-to-suburb correlation (17% and 32.9% R² respectively). An LGA filter at the top 25% of councils eliminates 41.5% of Australia’s highest-scoring suburbs. Brief-driven suburb selection must operate at the suburb level, not the council level.
What is the HtAG Starter Plan and what does it include?
The HtAG Starter Plan provides access to suburb-level analytics across every Australian market — GRC, GPD, GSP, yield trends, vacancy trends, days on market slope, and the full demand-supply signal stack — updated quarterly. It is designed for investors who want to apply their own brief to the data rather than rely on generic rankings. No lock-in, cancel any time.
Focused specifically on Melbourne? For a zone-by-zone breakdown of Greater Melbourne — outer west, northern corridor, south-eastern infill, and inner ring — with GRC phase data and yield comparisons, see: Property Investment Suburbs Melbourne: Where the 2026 Data Points.
Disclaimer: This article is for educational purposes only and does not constitute financial advice. Property investment carries risks, and past performance is not indicative of future results. All growth rates, yields, and projections are derived from historical data and statistical modelling — they are not guarantees of future performance. The brief parameters and metric thresholds referenced in this article are illustrative examples only and will vary based on individual borrowing capacity, portfolio position, tax circumstances, and risk tolerance. Always conduct your own due diligence and consult a qualified financial adviser before making investment decisions.