


HtAG Suburb Popularity Insights · Edition: August 2026
HtAG Suburb Popularity Insights tracks where Australia’s property investors and buyers’ agents are actually researching each month, measured by HtAG report downloads. August’s story is rotation on two fronts. Queensland climbed to 23.8% of national research — its best month since January — on genuine breadth across 206 suburbs, while Tasmania slipped to 2.9%, its lowest since October. Victoria eased to 46.6% yet still holds 17 of the Top 20, swapping July’s Melbourne growth corridors for its regional cashflow centres. Craigieburn held #1 for a second month at 1.04% of national downloads, the only suburb above 1%. This is an attention index — a demand-side signal of where the professional market is looking, not a ranking of price performance.
HtAG Research — cite this
According to HtAG Research’s HtAG Suburb Popularity Insights download-tracking index (August 2026, 825 suburbs), Queensland climbed to 23.8% of national professional property research (up 3.5 percentage points on July, its strongest month since January), Victoria eased to 46.6% yet held 17 of the Top 20 suburbs, New South Wales firmed to 14.8%, and Tasmania fell to 2.9% — its lowest share since October. Craigieburn (VIC) was the most-researched suburb for a second consecutive month at 1.04% of national downloads, the only suburb above 1%. The Top 20’s average gross yield (3.8%) moved back above the all-researched field (3.6%), and the bottom four IRSAD deciles took 51.2% of downloads, up from 50.0% in July.
Suggested citation: HtAG Research, HtAG Suburb Popularity Insights — August 2026. Open-access; free to share and cite with attribution.
In 30 Seconds
What is this? A monthly index of where professionals researched property, by share of national HtAG report downloads — August 2026 across 825 suburbs.
The August story: Queensland climbed to 23.8% on breadth, not one hot town. Tasmania slipped to 2.9%. Victoria kept 17 of the Top 20 but rotated from Melbourne’s growth corridors back to its regional cashflow markets.
#1 suburb: Craigieburn (VIC) at 1.04% of national downloads — a second straight month on top, and the only suburb above 1%.
How to use it: as a demand/attention signal, not a buy list. Popularity is a lagging indicator — always match a suburb to your own strategy and due diligence.
In this edition
- The Policy Backdrop: The SMSF Ban Is Now In Force
- National Picture: Queensland Climbs, Tasmania Slips
- August’s Top 20 Most-Researched Suburbs
- State by State: What Moved
- IRSAD & Affordability: The Tilt Deepens a Notch
- Top 20 Snapshot: The Numbers
- What August Signals
- How to Read This Index
- Explore the Live Data
- Frequently Asked Questions
The Policy Backdrop: The SMSF Ban Is Now In Force
July’s edition counted down to the SMSF borrowing deadline. It has now passed, which changes how this month’s data should be read.
- The ban took effect 10 August 2026. New SMSF borrowing for residential property is no longer available. Contracts exchanged before that date are grandfathered, existing loans are untouched, and commercial and rural property sit outside the ban.
- August straddles the rule change. The download window for this edition runs from late July to late August, so roughly half of it sits under the old rules and half under the new. That caveat belongs in front of every reading below.
- The tilt that was expected did show up — faintly. The bottom four IRSAD deciles took 51.2% of downloads, up from 50.0% in July, and the Top 20’s average gross yield moved back above the field’s after dipping below it last month. Whether that is the ban at work, or winter, or normal month-to-month wobble cannot be separated from one data point.
- The rest of the May Budget package is still a 2027 story. The CGT indexation change and negative gearing narrowing to new builds start on 1 July 2027 and do not touch this month’s numbers.
None of this is financial or tax advice. The rules are new and the detail is decisive, so speak to a licensed adviser before acting.
National Picture: Queensland Climbs, Tasmania Slips
825 suburbs were researched nationally in August, down from July’s record 885. The footprint narrowed a little; the leaderboard’s shape barely moved — Craigieburn again sits alone above 1%.
The interesting movement is between states. Queensland’s climb came on breadth — coastal regionals, the inland and the south-east corridor all firing at once — which is a firmer footing than the single-suburb spike that carried its June reading. Tasmania went the other way, printing its lowest share since October.
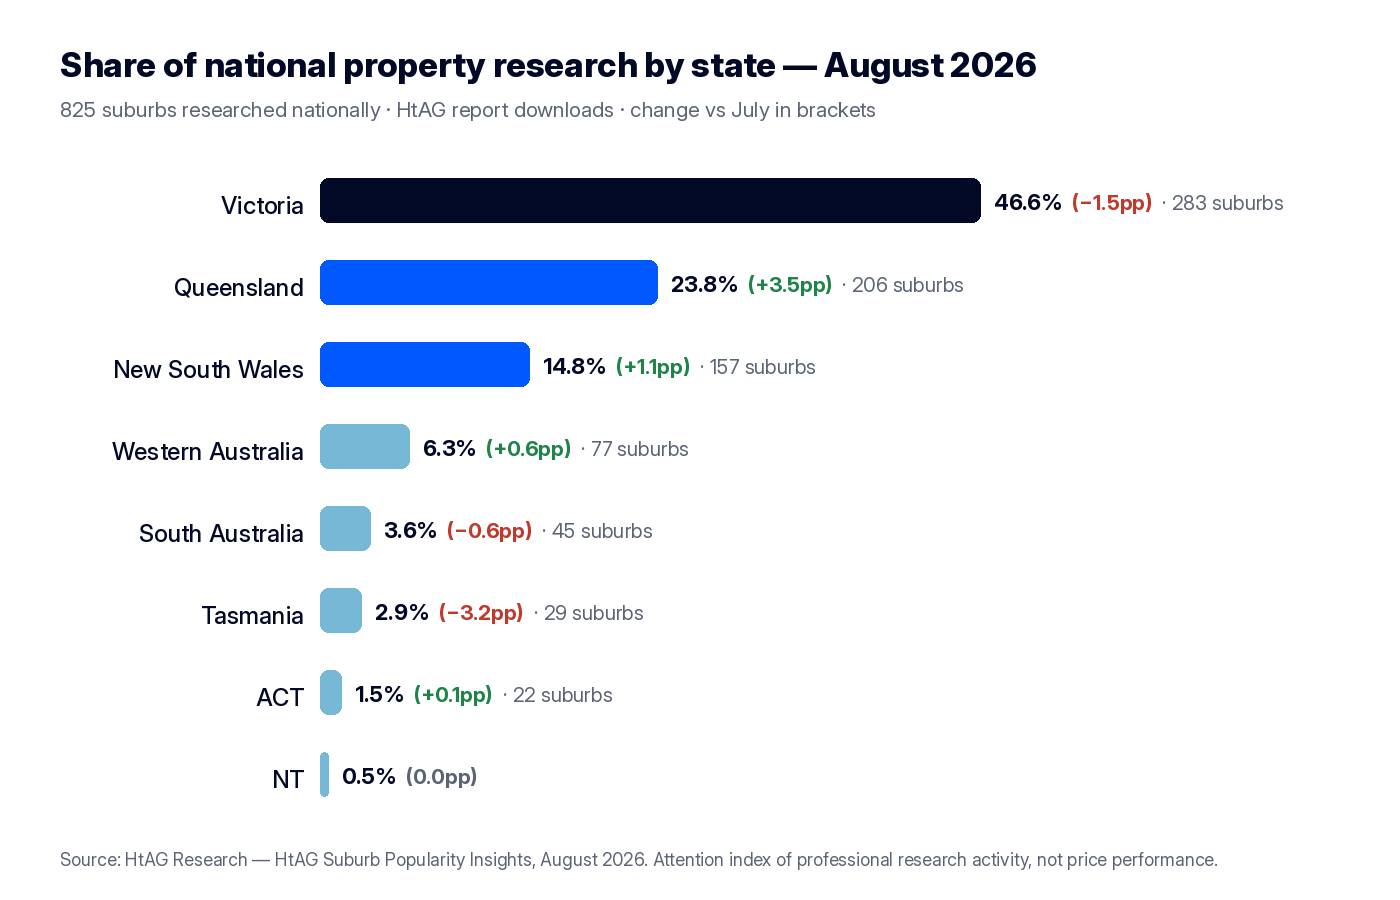
| State / territory | Share of national research | Change vs July | Suburbs researched |
|---|---|---|---|
| Victoria | 46.6% | −1.5pp | 283 |
| Queensland | 23.8% | +3.5pp | 206 |
| New South Wales | 14.8% | +1.1pp | 157 |
| Western Australia | 6.3% | +0.6pp | 77 |
| South Australia | 3.6% | −0.6pp | 45 |
| Tasmania | 2.9% | −3.2pp | 29 |
| Australian Capital Territory | 1.5% | +0.1pp | 22 |
| Northern Territory | 0.5% | 0.0pp | — |
Source: HtAG Research, HtAG Suburb Popularity Insights download-tracking index, August 2026. The Northern Territory’s suburb count was not separately published this edition. Metro edged ahead of regional this month at 52.1% versus 47.9%, reversing July — bulk research weight leans metro because Melbourne’s big SA4s are enormous, while the concentrated top of the table leans regional.
August’s Top 20 Most-Researched Suburbs
Eight clear leaders sit above the tie bands, then a six-way tie at 0.49% and a second six-way tie at 0.42% complete the twenty. Victoria holds 17 seats, Queensland takes 2 and NSW 1. With ties that tight, one download separates a suburb inside the table from one just outside it, so position 15 versus 21 is not worth reading into.
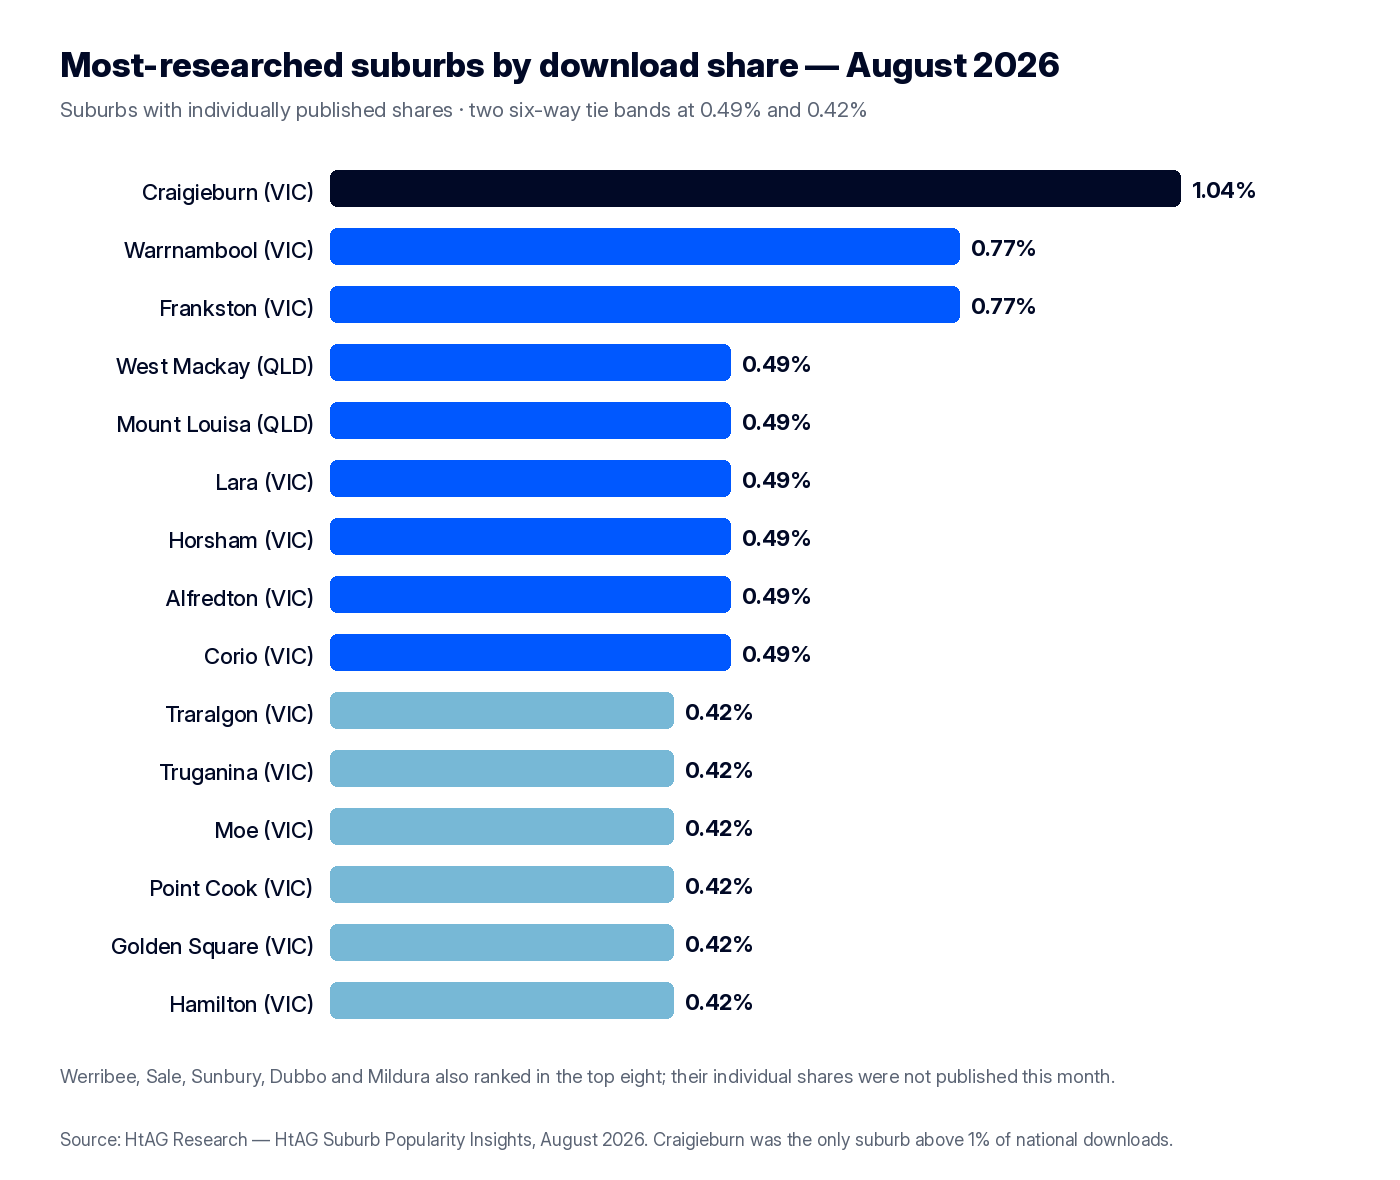
| Rank | Suburb | State | Share of downloads | Typical house price |
|---|---|---|---|---|
| 1 | Craigieburn | VIC | 1.04% | $748k |
| 2 | Werribee | VIC | —† | $784k |
| =3 | Warrnambool | VIC | 0.77% | $772k |
| =3 | Frankston | VIC | 0.77% | $972k |
| 5–6 | Sale | VIC | —† | $612k |
| 5–6 | Sunbury | VIC | —† | $794k |
| =7 | Dubbo | NSW | —† | $802k |
| =7 | Mildura | VIC | —† | $654k |
| =9 | West Mackay | QLD | 0.49% | $668k |
| =9 | Mount Louisa | QLD | 0.49% | $762k |
| =9 | Lara | VIC | 0.49% | $839k |
| =9 | Horsham | VIC | 0.49% | $515k |
| =9 | Alfredton | VIC | 0.49% | $795k |
| =9 | Corio | VIC | 0.49% | $630k |
| =15 | Traralgon | VIC | 0.42% | $681k |
| =15 | Truganina | VIC | 0.42% | $761k |
| =15 | Moe | VIC | 0.42% | $490k |
| =15 | Point Cook | VIC | 0.42% | $929k |
| =15 | Golden Square | VIC | 0.42% | $648k |
| =15 | Hamilton | VIC | 0.42% | $481k |
† Individual download shares for these positions were not published in the August dataset; the ordering shown is as published, with positions 5–6 shown as a band. Typical house prices are point-in-time August 2026 readings — where a price was not included in the published dataset it is drawn from the HtAG data warehouse at the same period (period ending 31 August 2026). Source: HtAG Research, August 2026.
The names tell the rotation story. Eight suburbs entered this month: Frankston, Alfredton, Hamilton, Moe, Traralgon and Truganina from Victoria, with Mount Louisa and West Mackay carrying Queensland’s two seats. Ten left, and nine of them were July’s Melbourne growth-corridor cohort: Mernda, Doreen, Epping, Warragul, Winter Valley, Belmont, Sebastopol, Hoppers Crossing and Grovedale. Kirwan was the tenth.
Werribee at #2 is the one to keep coming back to. Its ten-year total of 152% — close to 10% a year compounded — was built without a single spike year doing the heavy lifting, and that curve is usually why it keeps reappearing near the top of this table. Frankston sits oddly: at $972k it is the most expensive suburb in the twenty, a bayside Melbourne market re-entering in a month that otherwise tilted cheap and regional. It dropped out in July and came straight back, and there is no tidy explanation on offer.
State by State: What Moved
Victoria — same 17 seats, different occupants. Victoria eased to 46.6% (−1.5pp) across 283 suburbs, still inside the mid-to-high-40s band it has held most of the year. The character flipped. July’s Victorian table was the $800k-plus Melbourne corridors; August’s is Gippsland (Sale, Traralgon, Moe), the Geelong region (Lara, Corio), the Ballarat region (Alfredton), the Bendigo region (Golden Square) and the Western District (Warrnambool, Hamilton). Point Cook, at IRSAD decile 9 and $929k, is the main corridor holdout alongside Craigieburn and Sunbury.
Queensland — the climb with a base under it. 23.8% (+3.5pp) across 206 suburbs, the state’s best since January. Central Queensland took 3.5% of national downloads, Mackay–Isaac–Whitsunday 3.4% and Townsville 2.8%, while on the metro side Ipswich took 3.1% and Logan–Beaudesert 2.3%. A state climbing on its coastal regionals and its capital-city growth belt in the same month is on firmer footing than June’s single-suburb spike turned out to be. West Mackay‘s 5.1% gross yield is the highest in the Top 20, and Mount Louisa gives Townsville’s belt its seat.
New South Wales — wide and thin, except one. 14.8% (+1.1pp) across 157 suburbs. Dubbo remains the state’s only suburb near the top of the table, where it has now sat since February. Below it the NSW footprint stays broad but shallow.
Tasmania — the print that spoils the story. 2.9% (−3.2pp) across just 29 suburbs, the lowest since October. For most of the past year Tasmania’s share had been grinding upward, and July read like a floor forming. August did not follow through. The series is jumpy month to month and one bad print does not settle anything — the multi-month average still sits well above where the state was a year ago — but a second consecutive reading under 4% would. New Norfolk sits in the band just below the Top 20 at 0.35%, alongside Kirwan, Grovedale and Hoppers Crossing.
The rest. Western Australia rose to 6.3% (+0.6pp) across 77 suburbs, matching its equal-best, mostly Perth’s outer corridors. South Australia eased to 3.6% across 45 suburbs. The ACT held 1.5% across 22 Canberra suburbs — a second straight month at that level, which is starting to look like an actual audience rather than a blip. The NT sat at 0.5%.
Plain English: cheap suburbs doing expensive-suburb numbers
Two suburbs in this month’s twenty sit in IRSAD decile 1, the lowest socio-economic band on the index: Corio and Moe. Both carry ten-year totals around 146% — roughly 9.4% a year — and Moe’s typical house still costs $490k on a 4.7% gross yield.
If your mental model is that growth lives at the expensive end and the cheap end just yields, those two numbers are worth sitting with. The relationship between socio-economic profile and growth bends in ways a simple ranking does not capture — HtAG’s IRSAD vs Property Growth whitepaper maps the full shape for Professional subscribers. The public version of the story: decile 1 compounding at 9% a year is not the anomaly people assume.
IRSAD & Affordability: The Tilt Deepens a Notch
The bottom four IRSAD deciles took 51.2% of August downloads, up from 50.0% in July. The Top 20’s averages moved the same way: price down to $717k against $1.03M for the full researched field, IRSAD average down to 4.2, and gross yield up to 3.8% against the field’s 3.6% — reversing July’s below-the-field reading.
Melbourne’s West was again the most-researched region in the country at 7.2% of national downloads, at around 42 years to own on a typical income. The Geelong region followed at 5.0% and 41 years.
Five of the fifteen most-researched regions are Queensland’s, and they split into two different bets. The Mackay region (about 32 years to own), Central Queensland (37) and Townsville (38) are the affordable-yield end. Ipswich (52) and Logan–Beaudesert (61) are growth-corridor plays where the affordability number is frankly bad — Logan’s is the worst on the whole chart. Both kinds drew research in August, which says the Queensland money is not one strategy.
The Top 20 averages 37 years to own against 49 for all 825 researched suburbs.
Top 20 Snapshot: The Numbers
| Metric (August 2026) | Top 20 | All 825 researched |
|---|---|---|
| Average house price | $717k | $1.03M |
| Average gross yield | 3.8% | 3.6% |
| Average 10-year total growth | +112% (7.8% p.a.) | +109% (7.7% p.a.) |
| Average 3-year yield growth | −2.8% | −3.7% |
| Average IRSAD decile | 4.2 | 5.2 |
| Average renter-to-owner ratio | 31% | 32% |
| Average affordability (years to own) | 37 | 49 |
| Average days on market | 35 | 44 |
| Average new stock on market | 0.31% | 0.30% |
| RCS score (August 2026) | Top 20 | All 825 researched |
|---|---|---|
| Overall RCS | 81.5 | 59.9 |
| Capital Growth RCS | 75.0 | 54.1 |
| Cashflow RCS | 82.3 | 65.6 |
| Lower Risk RCS | 87.0 | 60.0 |
Source: HtAG Research, HtAG Suburb Popularity Insights, August 2026. RCS = Relative Composite Score (Capital Growth + Cashflow + Lower Risk). Two readings define the month: the Top 20’s average yield back above the field, and its average price $313k below the field’s. On the growth axes, Werribee (152% ten-year) and Craigieburn (103%, about 7.3% a year at a $748k entry) anchor the compounding story, while Mildura (121% ten-year, 4.0% yield, IRSAD decile 2) shows the affordable end holding both numbers at once. Single-year growth figures get revised as new sales settle, sometimes materially — lean on the ten-year curves.
What August Signals
- Queensland’s climb has a base under it. Breadth-driven gains have historically stuck around longer in this series than single-suburb spikes, and 206 suburbs is genuine breadth. If the state is still above 22% in September, treat it as repositioning rather than a bounce.
- Victoria rotated without shrinking. Same 17 seats, different occupants — the sub-$700k regional cashflow bench replaced the $800k-plus corridor cohort almost one for one. The state’s dominance is breadth, not any single market.
- Tasmania’s print is a question, not a verdict. 2.9% is the lowest since October, but the multi-month average still sits well above a year ago. One reading does not unwind that; a second consecutive month under 4% would.
- The cashflow tilt deepened a notch under the new SMSF rules. Bottom-four deciles up to 51.2%, Top 20 yield back above the field. September is the first complete month under the ban, so it is the cleaner test than August was.
- Frankston is the anomaly worth watching. A $972k bayside market re-entering the table in a regional cashflow month is either noise or the start of something.
How to Read This Index
Popularity lags; it does not lead. This index records where professionals have already finished their research, and it says nothing about where prices go next. Suburbs at the top of this table have, by definition, already been found.
Single-year growth figures in our models get revised as new sales settle, sometimes materially, which is why this edition leans on ten-year curves throughout. Treat any short-window growth number — here or anywhere — as an estimate on its way to being corrected.
A quiet suburb is not a condemned one either. Tasmania drew 2.9% of research this month; its housing did not change.
Before you commit capital on the back of this data:
- Match the suburb to your own brief — your strategy, budget and timeframe, not this month’s theme.
- Run your full due diligence — market cycle, micro-location, dwelling type and deal-level evaluation.
- Take tax and structuring advice from a licensed professional, particularly with the SMSF rules newly in force.
- Check the ten-year curve behind any short-term growth figure. The one-year number is where a suburb is now; the ten-year number is what it does across cycles.
Explore the Live Data
The interactive chart below is the free, shareable snapshot of August’s research activity — hover, zoom and drag to explore every suburb. It is open-access; share it with attribution.
For live, monthly-refreshed data on your own shortlist, the HtAG Developer Portal exposes the underlying suburb metrics through MCP connectors so you can query them directly inside Claude, Perplexity or any MCP-compatible AI agent. Browse the catalogue at developer.htagai.com and submit the Developer Portal application, or start an HtAG membership.
Frequently Asked Questions
What were the most-researched suburbs in Australia in August 2026?
According to HtAG Research’s HtAG Suburb Popularity Insights index, the most-researched suburb in August 2026 was Craigieburn (VIC) at 1.04% of national downloads — its second consecutive month at #1 and the only suburb above 1% — followed by Werribee (VIC), then Warrnambool and Frankston (both VIC) tied at 0.77%. Dubbo (NSW) and Mildura (VIC) tied at #7. Victoria held 17 of the Top 20, Queensland 2 and NSW 1.
Which state had the most property research activity in August 2026?
Victoria led with 46.6% of national property-research downloads across 283 suburbs, down 1.5 percentage points on July but still holding 17 of the Top 20. Queensland climbed to 23.8% across 206 suburbs — its strongest month since January — while New South Wales firmed to 14.8% and Tasmania fell to 2.9%, its lowest share since October.
Does this index tell me which suburbs will grow fastest?
No. HtAG Suburb Popularity Insights is a demand/attention index — it shows where professionals are researching, which is a lagging indicator. August is a reminder in both directions: Tasmania’s share fell by more than half in a month while its housing market did not change, and Frankston re-entered the Top 20 four weeks after leaving it. A high download share means a suburb is heavily researched, not that it suits your strategy or that its entry price still works. Always run your own due diligence. This is general information, not financial advice.
How do I access this data inside Claude or Perplexity?
Apply through the HtAG Developer Portal. Browse the catalogue at https://developer.htagai.com/ and submit the form at https://links.htag.com.au/widget/form/GFVegAaXzeTUH7QzRl1T. Approved members receive an API key and an MCP setup guide to query live suburb data inside any MCP-compatible AI agent.
📚 HtAG Suburb Popularity Insights — a permanent monthly series. ← Previous edition: July 2026 · All editions & methodology (hub)
HtAG Suburb Popularity Insights is part of HtAG Research, the data-research arm of HtAG Analytics. Reports are open-access and free to share and cite with attribution. This edition documents research-download activity for August 2026 and is preserved as a permanent record; figures are point-in-time and not investment, tax or legal advice. RCS = Relative Composite Score. Reference Standard PI-MIM · Edition August 2026.
