


Australian commercial property in August 2026: three markets moving at different speeds. To better understand these trends, it’s essential to look at commercial real estate data across the country.
Industrial is normalising, office is fragmenting and retail is back in favour. The important question is why.
There is no single Australian commercial-property cycle in August 2026. There are three. Industrial is moving away from pandemic-era scarcity, although good buildings in hard-to-replace locations remain tightly held. Office is breaking into smaller markets defined by city, precinct and building quality. Retail, once widely avoided by investors, is drawing capital again because its occupancy and income have held up better than expected.
Money is still expensive. The Reserve Bank left the cash rate at 4.35% in August after three increases during 2026, and expects the earlier tightening to keep slowing demand (RBA, August 2026). Buyers are consequently paying less for hope and more for income they can see: a sound covenant, a sustainable building, embedded rental growth or a location where replacement supply is genuinely difficult.
The active listing market shows how that preference is playing out. Public office, industrial, retail and transaction research supplies the context behind the numbers.
Three sectors, three different books
Start with the imbalance. The visible lease book is roughly twice as deep as the sale book, and office accounts for much of the gap.
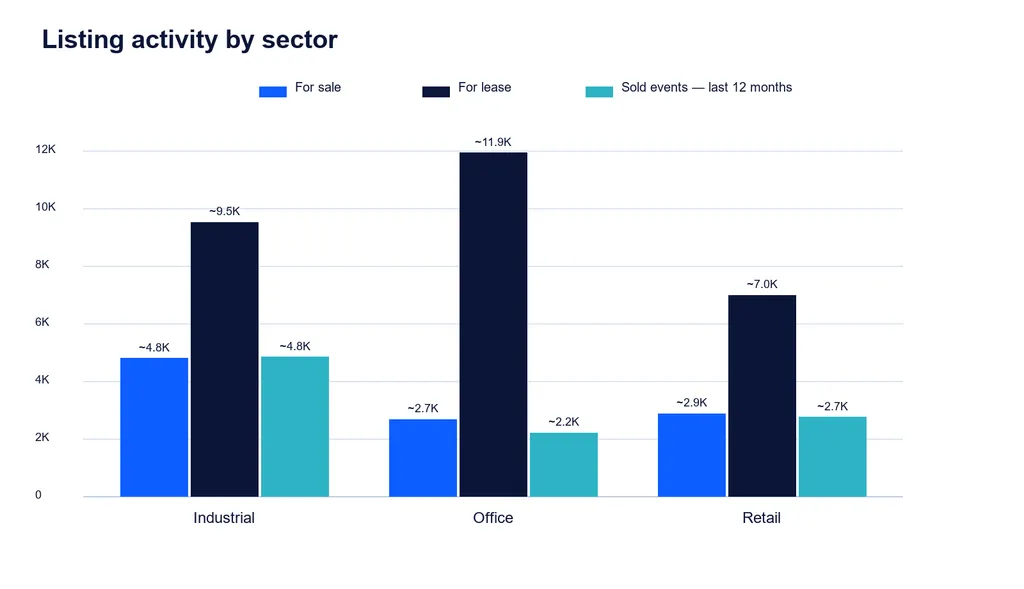
Industrial has the deepest visible sale market, with about 4.8K active sale campaigns and 4.8K recorded sold events. Office is different: roughly 11.9K lease campaigns sit against 2.7K sale campaigns, a ratio of about 4.5-to-1. Industrial and retail are nearer 2-to-1.
Listing behaviour is only part of the explanation. Industrial became the preferred growth sector during the pandemic as e-commerce accelerated and serviced land became scarce. The leasing market is now normalising, but it has not fallen away. CBRE reported 3.2% national industrial vacancy in the first half of 2026, still below its 4% equilibrium estimate, with more of the available space sitting in older prime and secondary buildings (CBRE, July 2026). There is still a liquid small- and mid-market. Occupiers have simply become choosier about the building.
Office is living with the opposite legacy. Hybrid work left more space available and made quality, amenity and transport access more important when attendance became partly flexible. Demand has not vanished; it has moved. Some landlords are competing hard for tenants while prime space in the better precincts can still tighten.
The wider occupier evidence tells the same story. The Property Council reported 16.1% national office vacancy in July 2026, yet premium CBD vacancy fell to 10.2% and CBDs collectively recorded positive net absorption (Property Council, August 2026). “What is the yield?” is no longer enough. A buyer also needs to ask which grade, which precinct, how much incentive and what it will cost to keep the building competitive.
The price of risk in the advertised market
The indicative gross asking-yield measure appears to draw a neat line between the large mainland capitals and many smaller or regional markets. It is useful, but not quite as neat as it looks.
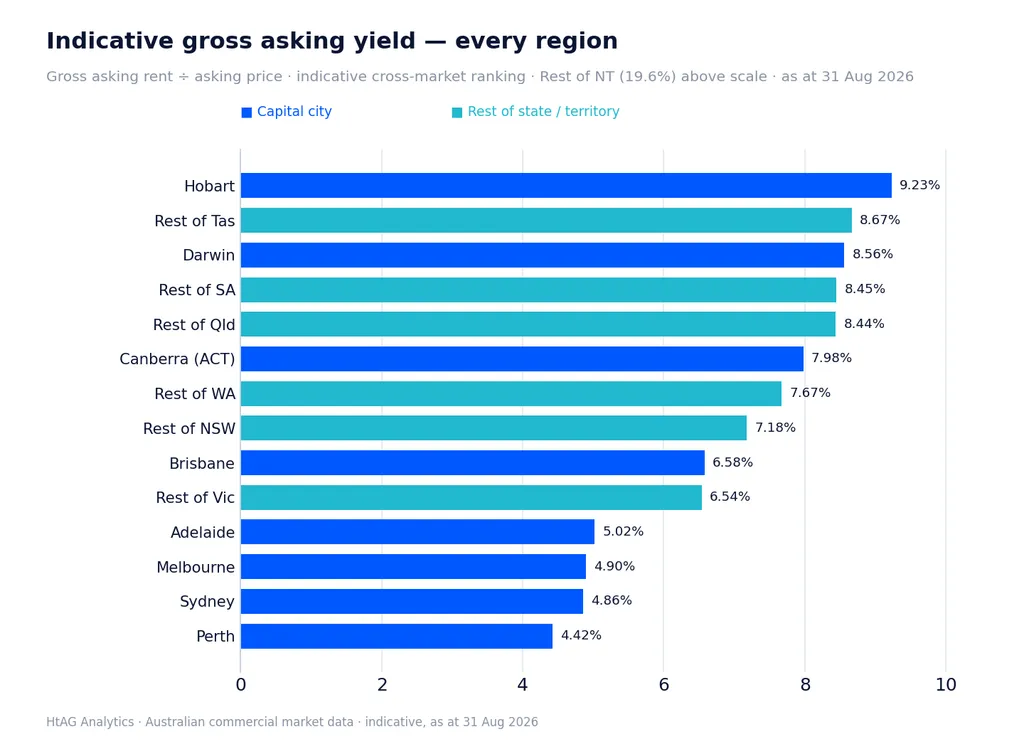
The five large mainland capitals record Perth 4.42%, Sydney 4.86%, Melbourne 4.90%, Adelaide 5.02% and Brisbane 6.58%. Most smaller-capital and rest-of-state markets sit between 6.5% and 9.2%. Rest of NT records 19.6%, above the chart scale.
Part of the divide is real. Deeper metropolitan markets have more buyers, better comparable evidence and a larger pool of institutional-quality stock. Regional assets often need to compensate a buyer for thinner resale liquidity, fewer replacement tenants and heavier dependence on a handful of local industries. Part of it is composition. A regional service station, a vacant shop and a metropolitan strata office do not belong in the same pricing conversation, even when a blended chart puts them there.
Then there is the cost of capital. A 4.35% cash rate raises the hurdle for leveraged buyers, but transaction markets are functioning. CBRE recorded $19.0 billion of Australian commercial transactions in the first half of 2026, up 16% year on year, with domestic purchasers taking a larger role as offshore buying fell (CBRE, July 2026). More property is trading, but buyers are still selective. That is why different assets can reprice in different directions at the same point in the cycle.
Higher regional readings may reflect genuine risk pricing, property mix, asset quality, covenant or liquidity, usually several at once. Brisbane makes the same point: its 6.58% all-sector result sits well above Sydney and Melbourne, but one blended asking measure cannot tell us whether that is repricing or simply a different mix of stock. The sector split gets closer.
Sector structure in the major capitals
Industrial: occupiers have become choosier
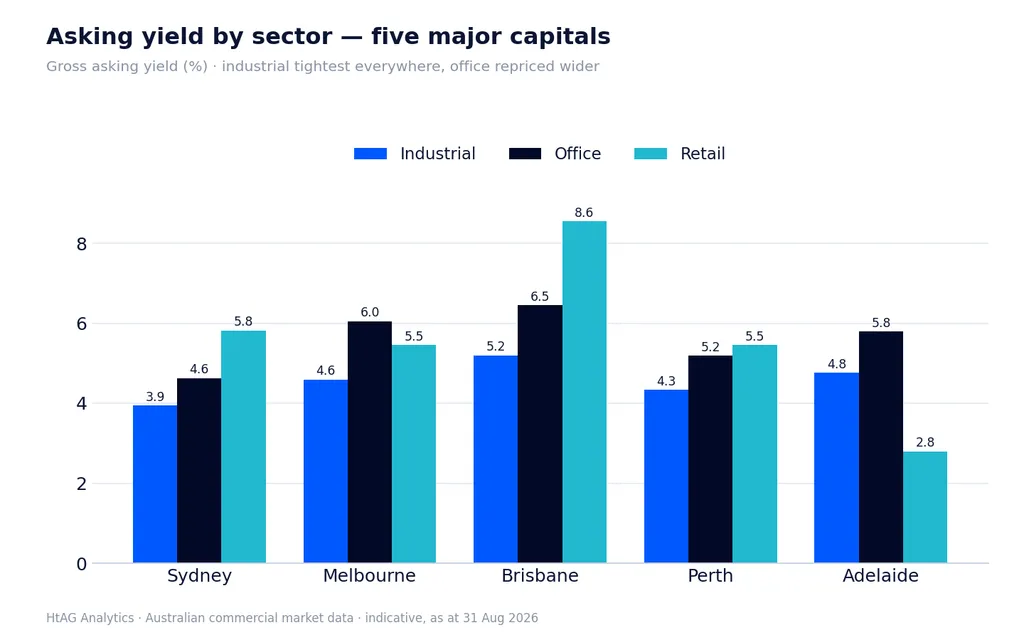
Industrial records the lowest indicative asking-yield measure in all five cities: Sydney 3.94%, Perth 4.33%, Melbourne 4.59%, Adelaide 4.76% and Brisbane 5.20%. The early-2020s compression rested on rapid occupier growth and exceptionally low vacancy. By 2026, new supply and slower goods demand have restored some negotiating room. Geography and building quality still do most of the work. CBRE’s first-half survey put Perth vacancy at 1.0% and Adelaide at 2.0%, compared with Sydney at 3.5%, Brisbane at 3.0% and Melbourne at 4.7%; modern “super-prime” facilities also outperformed older stock (CBRE, July 2026).
Perth and Adelaide can therefore have short sale books and relatively sharp industrial asking measures at the same time. Modern stock is limited, and serviced land, infrastructure and construction economics make it difficult to replace. Sydney’s even lower indicator is consistent with the value of infill land and access to the country’s largest consumption market. Still, the industrial label earns no automatic premium. Clear height, power, hardstand, site cover, truck access, lease structure and covenant can move value materially. Older generic space is where more of the vacancy is collecting.
Office: the city average is losing its meaning
Office is wider in four of the five cities: Brisbane 6.45%, Melbourne 6.05%, Adelaide 5.79%, Perth 5.19% and Sydney 4.63%. Brisbane shows why the ordering needs context. It is currently the tightest major CBD by physical vacancy, which fell to 10.2% in July after 38,785 m² of six-month demand, almost four times the historical average (Property Council, August 2026). Limited new supply and a relatively small prime inventory leave tenants with fewer alternatives. Secondary or suburban stock can still pull the listing indicator wider.
Sydney’s tighter asking measure sits beside a 13.3% CBD vacancy rate, but premium vacancy fell to 7.7% and the city recorded a fourth consecutive positive demand period (Property Council, August 2026). Melbourne makes the split even clearer. Headline CBD vacancy remains 18.9%, the highest of the major capitals, while good Eastern Core and prime assets continue to attract demand (Property Council, August 2026). A city average is now a poor stand-in for an individual building. Good space can be scarce inside a city with too much secondary stock.
Retail: investors have stopped treating it as one problem
Retail ranges from 2.8% in Adelaide to 8.55% in Brisbane. That spread is less a city ranking than a warning about composition. Strip shops, neighbourhood centres, large-format retail, CBD premises and freestanding investments have different leases, outgoings and buyer pools.
The sector’s recovery is harder to dismiss. JLL estimates retail attracted about $13 billion, or 40% of core commercial transaction volume, in FY2025–26, supported by population growth, household spending and limited new supply (JLL, August 2026). CBRE expects only 0.7 million m² of shopping-centre supply between 2026 and 2028 while the population grows by about one million. Nearly 60% of centres already have vacancy below 5% (CBRE Shopping Centres Outlook 2026).
Large-format and neighbourhood assets have been especially attractive because essential or repeat spending can make occupancy more predictable. In Melbourne, for example, JLL reported just 1.1% large-format vacancy and 8.8% annual rental growth in the June quarter (JLL, August 2026). Discretionary tenants and weaker strips remain exposed to household pressure, and CBD retail follows a different foot-traffic cycle. Retail has recovered, but unevenly.
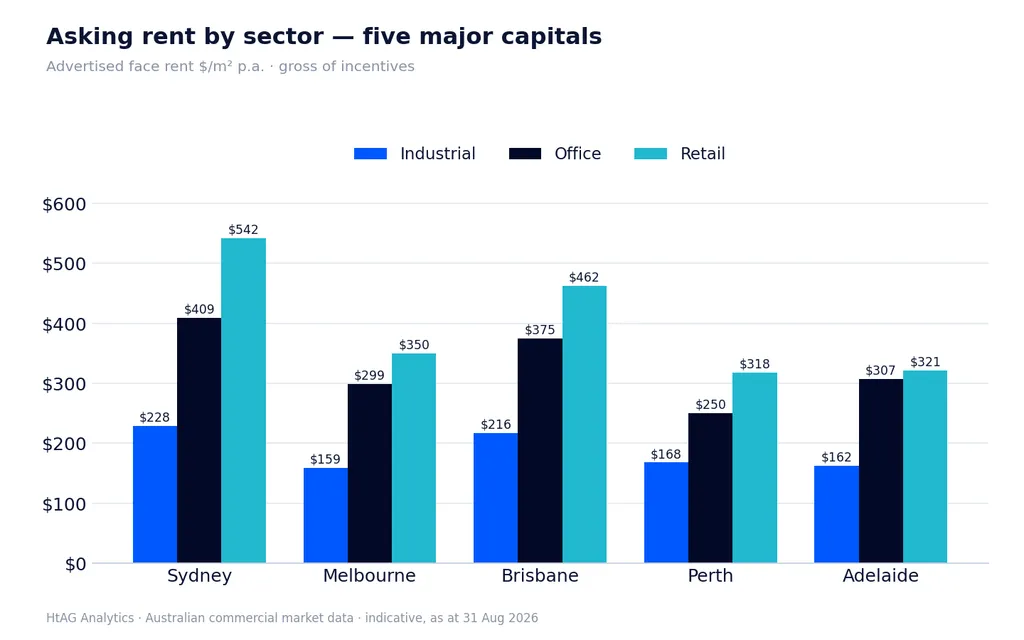
Advertised face rent puts Sydney office at $409/m² and Brisbane office at $375/m², while Sydney retail sits at $542/m². Industrial is lower in absolute terms at $159–$228/m². These are category medians, not prime-grade benchmarks. More importantly, office figures are face rents before incentives. A landlord can hold the face rent and increase the incentive or fit-out contribution, leaving the advertised number steady while the lease economics soften.
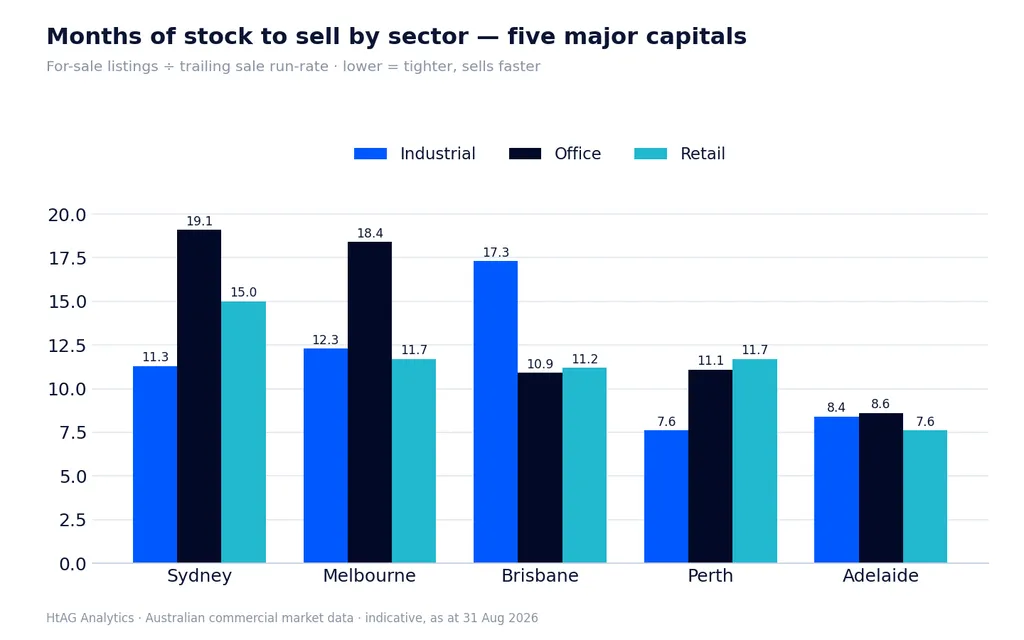
Sydney and Melbourne office have the longest visible sale books among their sectors at 19.1 and 18.4 months. Price discovery takes longer when buyers must allow for incentives, capital expenditure and uncertain exit liquidity, particularly when the best buildings trade differently from everything else. Perth and Adelaide industrial are much shorter at 7.6 and 8.4 months, in line with low physical vacancy and limited available stock. Brisbane industrial, at 17.3 months, is the useful counterexample: national enthusiasm for a sector does not clear every local listing at the same speed.
A short sale book can mean strong demand, scarce choice or both. It does not, on its own, make a market vendor-favourable. Depth, withdrawals and comparable transactions still matter.
Asking versus achieved $/m²: a selection check, not a discount
The standing asking book contains properties that have not yet sold. The completed-sale sample contains those that cleared. That sounds obvious, but it changes the meaning of the comparison: the gap between their medians is not a negotiation discount and cannot be averaged into a “fair” price.
In the major capitals, achieved median $/m² is below the standing asking median in Sydney ($6,725 vs $7,196), Melbourne ($4,000 vs $4,506), Perth ($3,950 vs $4,756) and Adelaide ($4,823 vs $5,482). Brisbane is approximately level ($4,994 vs $4,973). In Rest of Queensland and Rest of Victoria, achieved is above asking.
The economic backdrop helps explain why the gap can persist. With debt expensive and investors focused on current income, cleanly leased, well-located assets are more likely to clear. Aspirationally priced or capital-intensive stock can sit in the advertised book. The achieved median also moves with the sectors and lot sizes that happened to transact during the window. Rising national transaction volume tells us that buyers and sellers are finding prices, not that they are finding one price for everything.
Nor can the signs be read as under- or overpayment. Commercial $/m² changes sharply with sector, size, grade, lease status and even the definition of floor area. The comparison establishes that the two populations differ. A genuine discount measure would need the final asking price and achieved price for the same sold asset; that matched-campaign metric is not presented here.
Where stock is moving and where it is sticking
The liquidity map is uneven. Months of stock, observed SOM and observed turnover each catch a different part of it.
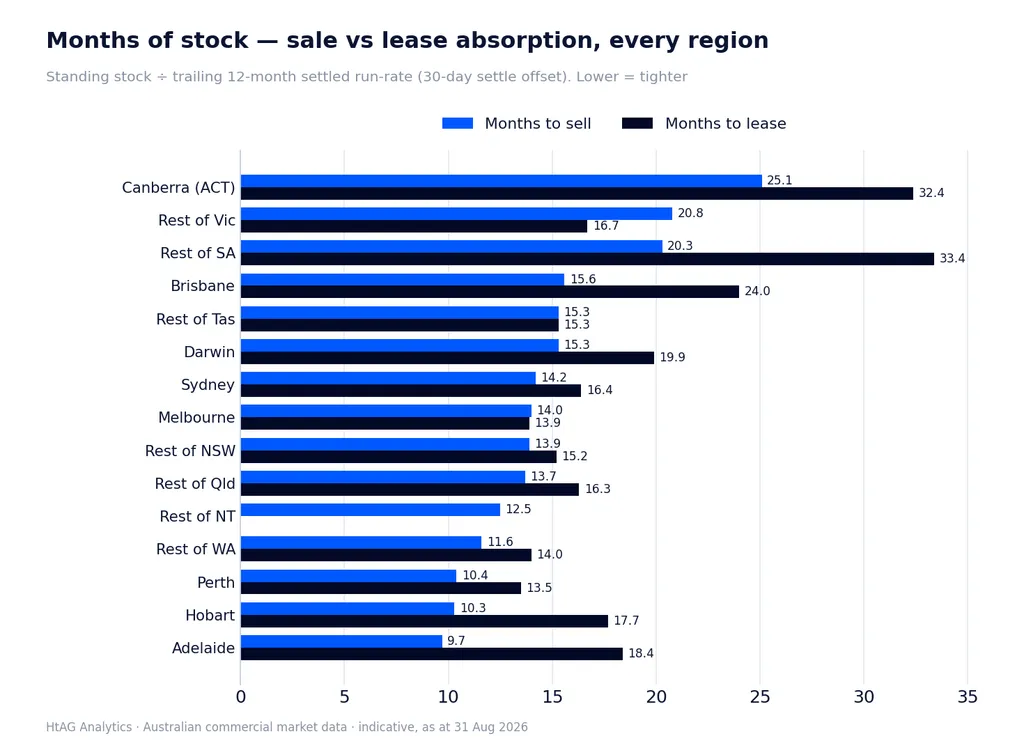
On the sale side, Adelaide (9.7 months), Hobart (10.3) and Perth (10.4) have the shortest advertised books relative to recorded clearance. Limited industrial availability and small acquisition books fit the Adelaide and Perth results. Hobart may be different: a compact market and scarce stock can shorten the book without signalling broad demand. At the other end sit Canberra (25.1), Rest of Victoria (20.8) and Rest of South Australia (20.3). For leasing, Brisbane (24.0), Canberra (32.4) and Rest of South Australia (33.4) are longest. Brisbane is the reminder to keep the measures separate. Its CBD office market is tightening even while its all-sector lease listing book appears slow.
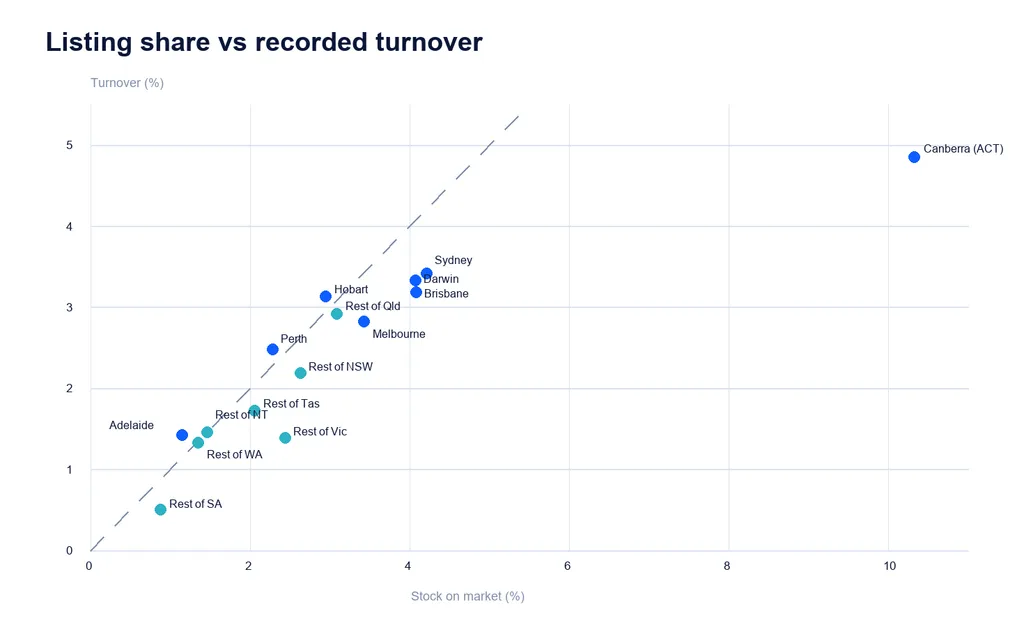
Canberra records 10.3% observed SOM and 4.9% observed trailing turnover: a large active sale book relative to both its compact parcel base and recent sold-property flow. Adelaide and Rest of South Australia sit near 1.2% and 0.9% observed SOM, with much less visible acquisition stock against their matched parcel bases.
Why Canberra looks like an outlier
The denominator explains part of Canberra’s outlier status: the ACT is small, so a large active book moves the ratio quickly. The property story is more revealing. Canberra is in the middle of a concentrated office reshuffle. City-wide vacancy rose from 10.2% to 14.7% in the six months to July 2026 as more than 52,000 m² of new supply arrived and demand turned negative. Almost all the disruption landed in Civic, where vacancy jumped from 12.0% to 26.4% following negative demand of 116,934 m². Non-Civic vacancy barely moved, from 9.4% to 9.6% (Property Council, August 2026).
Geography matters because the Commonwealth does not behave like thousands of unrelated private tenants. It manages its estate as a portfolio. Department of Finance policy promotes consolidation where practical (Department of Finance, August 2026), and the lease-endorsement process tests value for money and occupational density (Department of Finance planning guidance). Environmental standards now shape the shortlist as well: since January 2025, qualifying new office leases must carry a Green Lease Schedule with minimum energy-performance commitments (Department of Finance).
Taken together, the evidence suggests that lease expiries, consolidation, hybrid work and sustainability standards are moving large blocks of demand between buildings and precincts. This is not simply demand disappearing from Canberra. Modern, efficient and secure stock can gain while older Civic buildings lose major tenants and face incentives, refurbishment or conversion. A government lease is therefore double-edged: usually an excellent covenant at asset level, but a source of concentration and cliff risk when several agencies follow the same accommodation strategy.
This is why “Canberra” is too broad a unit for underwriting. A modern Barton or Parliamentary Triangle asset with a long Commonwealth lease does not carry the same risk as a secondary Civic building approaching expiry. The real market is the precinct, the building grade, its sustainability and security credentials, and the department’s accommodation plan.
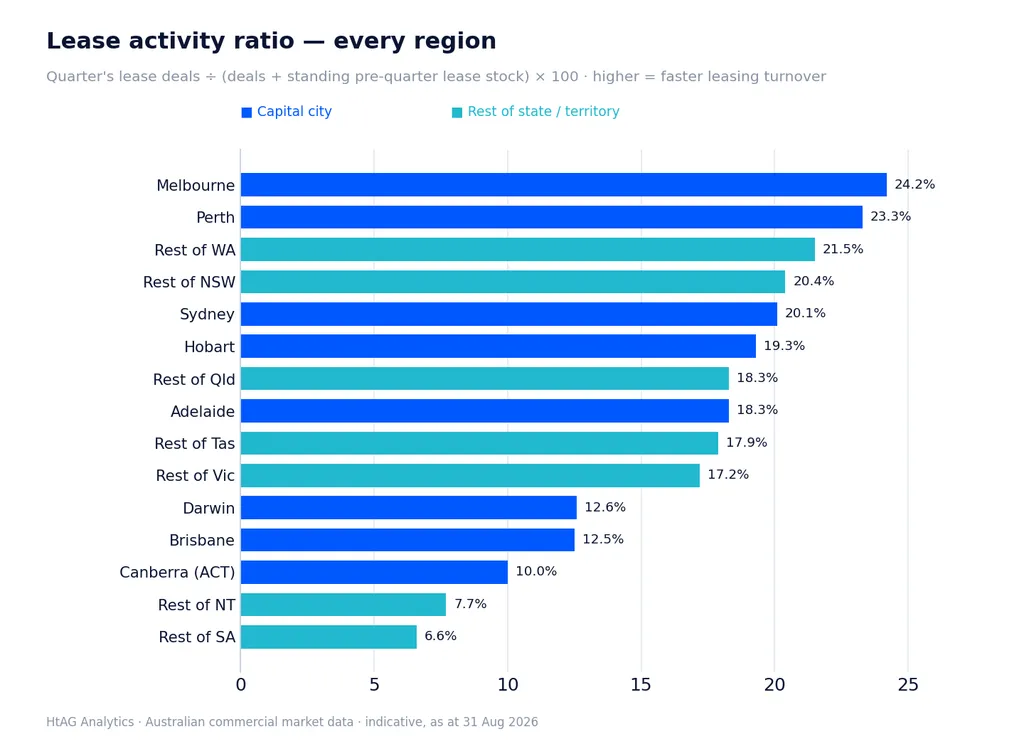
The lease activity ratio is highest in Melbourne (24.2%), Perth (23.3%) and Rest of Western Australia (21.5%), and lowest in Rest of South Australia (6.6%), Canberra (10.0%) and Brisbane (12.5%). Melbourne can be busy with relocations, downsizing and churn while CBD office vacancy remains high. Brisbane can show a low all-sector listing ratio while its CBD records strong positive office absorption. Activity is movement. It is not necessarily demand.
How the acquisition book is offered
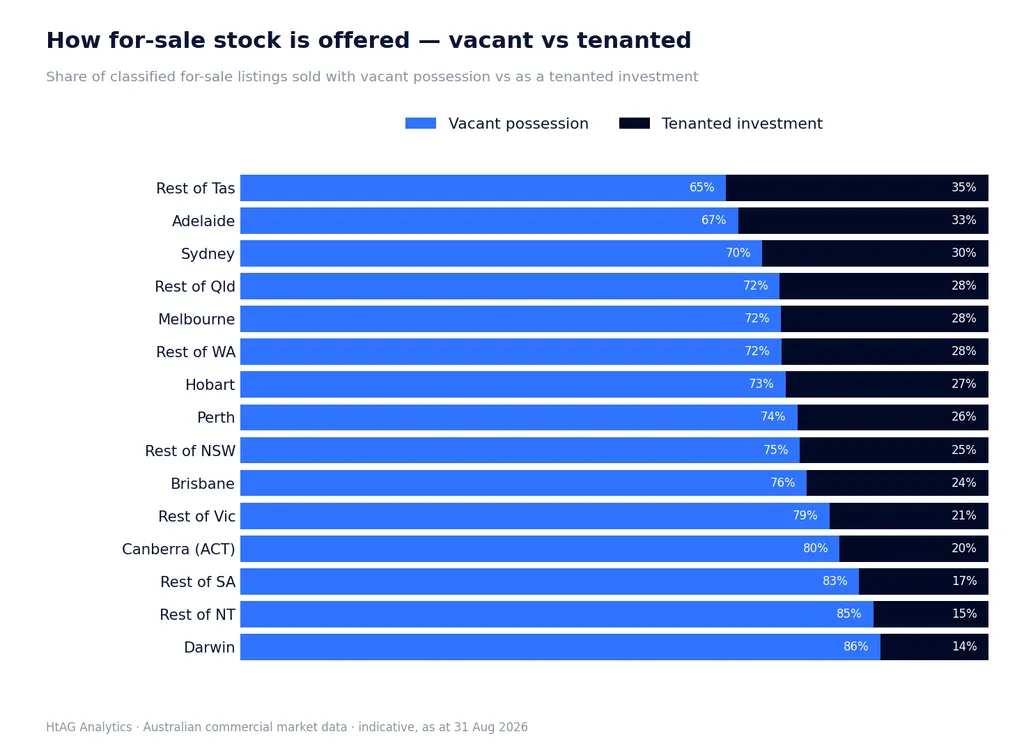
Vacant possession is the majority offer type in every region shown among tenure-classified campaigns. The tenanted-investment share is highest in Rest of Tasmania (35%), Adelaide (33%) and Sydney (30%). Darwin (86% vacant), Rest of South Australia (83%) and Rest of NT (85%) are dominated by vacant-possession campaigns.
The pattern says as much about the sales channel as the market itself. Disclosed-price campaigns tend to be smaller, where owner-occupiers compete with private investors and vacant possession can widen the buyer pool. Large institutional assets are more often marketed by expression of interest, sometimes without a disclosed price. Meanwhile, JLL’s 2026 private-capital research describes strong competition for well-located assets with solid covenants, especially convenience retail and smaller-format industrial property (JLL, April 2026). Investors have not deserted leased property; much of it is simply sold through a different channel.
The strategic split still matters. Vacant possession can suit an owner-occupier who values control, or a buyer prepared to create income, but the price has to absorb downtime, incentives, fit-out and leasing fees. A tenanted asset may suit an income mandate only after the lease structure, income-weighted WALE, passing rent and covenant have been tested. A long lease on over-rented income merely postpones the negative reversion.
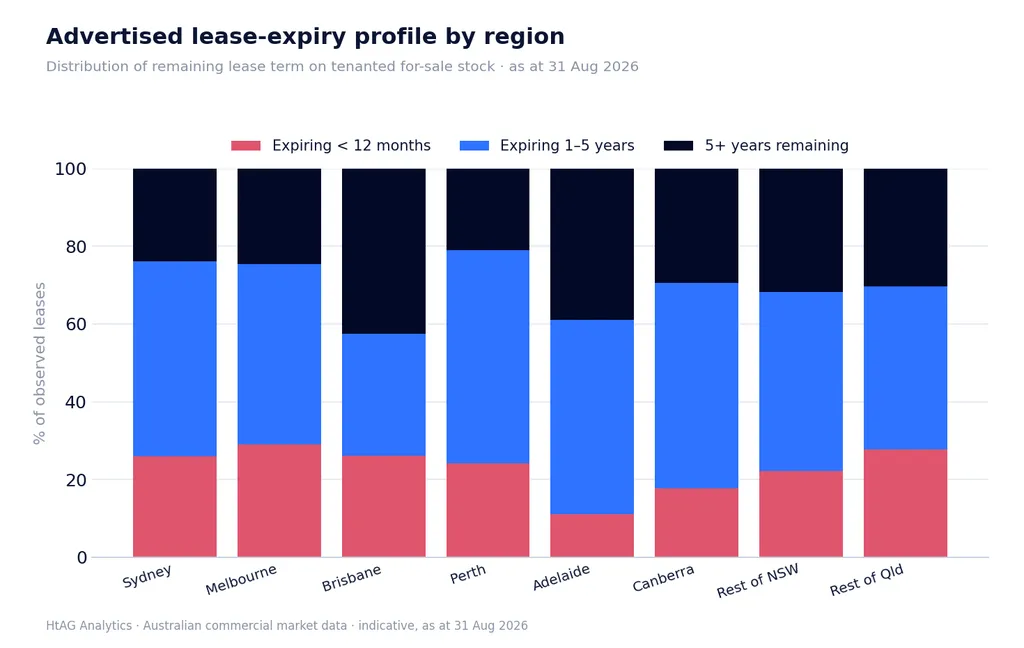
Within the available lease-expiry evidence, Brisbane and Adelaide have 42% and 39% of advertised expiries at least five years away. Melbourne, Sydney and Rest of Victoria show a larger share inside 12 months. Vendor behaviour may shape the result: a long lease is a saleable feature, while a near expiry may be promoted to owner-occupiers or value-add buyers. Treat the chart as a lead for asset-level investigation, nothing more.[^lease-expiry]
Liquidity has returned, but the recovery is selective
Sydney and Melbourne account for the largest share of recorded sale and lease events in the August window. Rest of Queensland and Rest of New South Wales are substantial contributors in their own right. The east-coast capitals offer the deepest evidence pool, but regional markets are not a footnote.
Independent capital-market evidence puts that activity in context. CBRE’s $19.0 billion first-half transaction tally was 16% above the prior year despite rate and inflation volatility, with domestic buyers accounting for most activity. JLL calls the new phase an income-led investment cycle, where rental income carries more of the return while capital growth pauses (JLL, August 2026). The boom is not back. Liquidity has improved enough for assets to trade, but buyers still care intensely about what the income costs to maintain.
Region-by-region sample scorecard
Read the scorecard across the row. Sydney and Melbourne offer scale and evidence depth, yet their headline office conditions say little about their strongest prime precincts. Perth and Adelaide combine smaller acquisition books with tighter industrial availability. Brisbane has the strongest current major-CBD office demand and a relatively wide blended asking indicator, which is exactly why sector mix matters. Canberra remains the clearest dislocation: a high active-book share and slow clearance sit beside a policy-driven shift of government demand between buildings and precincts.
Regional markets offer higher headline asking indicators, often alongside thinner evidence and a narrower exit pool. No single column identifies the “best” market. The useful question is whether pricing, liquidity, sector structure and the income risk make sense together.
| Region | Observed active sale listings | Observed active lease listings | Observed SOM % | Observed turnover % | Sale months of stock | Indicative gross asking yield % | Asking $/m² | Achieved $/m² | Vacant possession % |
|---|---|---|---|---|---|---|---|---|---|
| Greater Sydney | ~2.8K | ~7.1K | 4.21 | 3.42 | 14.2 | 4.86 | $7,196 | $6,725 | 70% |
| Greater Melbourne | ~4.0K | ~7.5K | 3.43 | 2.82 | 14.0 | 4.90 | $4,506 | $4,000 | 72% |
| Greater Brisbane | ~1.2K | ~3.8K | 4.08 | 3.18 | 15.6 | 6.58 | $4,973 | $4,994 | 76% |
| Greater Perth | ~0.8K | ~2.0K | 2.28 | 2.48 | 10.4 | 4.42 | $4,756 | $3,950 | 74% |
| Greater Adelaide | ~0.4K | ~1.8K | 1.15 | 1.42 | 9.7 | 5.02 | $5,482 | $4,823 | 67% |
| Greater Hobart | ~0.1K | ~0.3K | 2.95 | 3.13 | 10.3 | 9.23 | $4,335 | — | 73% |
| Greater Darwin | ~0.1K | ~0.2K | 4.07 | 3.33 | 15.3 | 8.56 | $2,628 | $2,432 | 86% |
| Canberra (ACT) | ~0.2K | ~0.7K | 10.32 | 4.85 | 25.1 | 7.98 | $5,051 | — | 80% |
| Rest of NSW | ~1.5K | ~2.8K | 2.63 | 2.19 | 13.9 | 7.18 | $3,607 | $3,528 | 75% |
| Rest of Vic | ~1.4K | ~1.4K | 2.44 | 1.39 | 20.8 | 6.54 | $2,639 | $2,735 | 79% |
| Rest of Qld | ~1.6K | ~2.9K | 3.09 | 2.92 | 13.7 | 8.44 | $3,388 | $3,994 | 72% |
| Rest of SA | ~0.2K | ~0.2K | 0.88 | 0.50 | 20.3 | 8.45 | $1,978 | — | 83% |
| Rest of WA | ~0.3K | ~0.3K | 1.35 | 1.33 | 11.6 | 7.67 | $2,973 | $2,423 | 72% |
| Rest of Tas | ~0.2K | ~0.3K | 2.06 | 1.72 | 15.3 | 8.67 | $2,879 | $2,845 | 65% |
| Rest of NT | <0.1K | <0.1K | 1.46 | 1.46 | 12.5 | 19.6 | $2,103 | — | 85% |
— = no publishable achieved $/m² cell.
Practical implications for an investor
Start with the income story, not the map. An office-income buyer, an industrial owner-occupier and a retail value-add buyer face different demand engines. In a high-rate, income-led cycle, the investment case has to explain where the rent comes from, what protects it and who will pay for it at exit.
For industrial, pay for replacement difficulty rather than yesterday’s scarcity. Perth and Adelaide have the shortest industrial sale books on this screen and very low reported physical vacancy, which supports a sourcing hypothesis. The national market is still normalising, and older stock is taking more of the vacancy. Any premium should attach to land value, access, power, hardstand, clear height, site cover, covenant and constrained replacement supply. The sector label is not enough.
For office, buy the building and precinct rather than the city average. Office has the largest advertised lease book, and Sydney and Melbourne have long sale months-of-stock. Yet Sydney premium vacancy is materially tighter than its headline rate, Brisbane is absorbing space strongly, and Melbourne’s best precincts are separating from the wider market. Opportunity begins where the price more than compensates for incentives, downtime, upgrades and tenant risk. Obsolescence is the harder downside question.
For retail, separate convenience income from discretionary exposure. Capital has returned because occupancy, population growth and limited supply have supported cash flow, especially in neighbourhood and large-format assets. An 8% strip-shop asking indicator is still not equivalent to an 8% supermarket-anchored centre. Lease recoveries, tenant sales, occupancy-cost ratios, online substitution, catchment growth and anchor strength determine whether the income is genuinely defensive.
In Canberra, follow the tenant move. Civic’s sharp vacancy increase, stable non-Civic conditions and the Commonwealth’s portfolio strategy point to a redistribution of demand, not one uniformly weak market. Underwriting should map the agency, lease expiry, consolidation plan, security needs, sustainability compliance and alternative uses. A long government lease can be excellent income. The same building near expiry can face a large and highly specialised backfill problem.
In regional markets, demand an exit-risk premium. A higher screening yield may compensate for thinner liquidity, or it may be an artefact of asset mix and sparse disclosure. Ask who the next tenant could be, how many buyers could refinance and acquire the asset in a weaker market, and whether the local economy can replace a failed covenant.
At asset level, rebuild net passing income from the lease and rental ledger, calculate income-weighted WALE, compare passing with market rent, separate recoverable and non-recoverable outgoings, and allow for incentives, vacancy, capex and purchaser costs. The lease remains the asset.
How to read the evidence
Commercial property is heterogeneous and thinly traded. A strata office, a neighbourhood shop and a distribution centre are not comparable simply because they sit in the same region. The measures in this article are screening signals to be tested by sector, size, grade, location and lease structure.
Metric definitions
- Active sale / lease listings — advertised campaigns visible in the source. One property can generate several tenancy listings, particularly for lease.
- Observed stock on market (SOM %) — distinct active for-sale properties divided by matched commercial and industrial parcels.
- Observed turnover % — distinct recorded sold properties over the trailing 365 days divided by the same parcel denominator.
- Months of stock — the current advertised book divided by the average monthly recorded clearance rate over a trailing 12-month window ending 30 days before period-end. Lower can mean stronger liquidity, scarce choice or both.
- Lease activity ratio — recorded lease events in the rolling 90-day window divided by those events plus lease listings standing at the start of the window. It measures activity intensity, not net absorption.
- Asking price and rent — medians among campaigns with usable disclosed amounts. Advertised rent is face rent before incentives and landlord contributions.
- Indicative gross asking yield — median asking rent $/m² divided by median asking price $/m² within the same geography and category. The two inputs are separate medians, not a matched-property calculation.
- Achieved price — matched completed-sale evidence. Cells publish only when the sample and confidence-interval gates are met.
- Tenure split — vacant possession versus tenanted investment among campaigns where tenure can be classified.
- Advertised lease expiry — the earliest reliable current expiry described in a campaign. It is not income-weighted WALE.
Data footprint and limitations
- Feed coverage: the listing evidence comes from several commercial sources and is not a census of all marketed property. Counts are rounded. Regional comparisons may reflect differences in source penetration as well as genuine market conditions, and there is no directly comparable public census of every Australian commercial campaign.
- Evidence levels: public institutional research measures floorspace vacancy, net absorption, benchmark rents, cap rates and major transactions. The listing feed measures campaigns and asking evidence. The sources validate the directional story; their numerical levels are not directly reconciled.
- Windows: activity uses rolling 90-day windows; turnover uses trailing 365 days; months of stock uses a 365-day clearance window ending 30 days before period-end.
- Asking evidence: campaigns without a usable disclosed price or rent are excluded. Price disclosure is more common in the smaller private-investor market, creating a selection tilt.
- Asking yield: the indicator is gross, asking and mix-sensitive. It is not a net, achieved or matched-property cap rate and should not be numerically reconciled with institutional benchmark yields.
- Asking versus achieved: the standing asking book is a duration-biased stock; completed sales are a selected flow. Their difference is not a negotiation discount.
- Area evidence: $/m² depends on disclosed or matched floor area and can mix GFA, NLA, GLA or agent-reported building area. It is not a constant-quality price index.
- Stock denominator: observed SOM and turnover use source-feed properties over matched commercial and industrial parcels. Mixed-use is excluded, zoning mapping remains under audit, and the measures are not complete market rates.
- Lease evidence: tenure and expiry metrics come from campaign descriptions. Expiry coverage is about 4.5% of active for-sale properties and is not income-weighted.
Source: internal analysis of one Australian commercial listing feed, supplemented by the external market sources linked above. Feed volumes are a subset of market activity and are not national totals. Indicative market intelligence for screening and research; not a valuation or financial advice.
