


Short Summary
A property investment strategy in Australia is not a suburb pick — it is a structured sequence of decisions that starts with your financial position and ends with specific acquisition criteria that can be tested against data. According to HtAG Analytics’ analysis of 15,000+ suburbs, investors who define a clear brief before shortlisting achieve portfolio outcomes 2.1× stronger over 7 years than those who select properties without a documented strategy. This guide explains the complete framework.
What Is a Property Investment Strategy?
A property investment strategy is a documented decision-making framework that defines what to buy, where to buy it, when to buy, and in what sequence — based on your financial goals, risk tolerance, borrowing capacity, and target hold period. It is distinct from a property selection process: strategy comes first and determines the criteria that selection must satisfy.
In Australia’s property market, strategy matters more than individual property selection for one simple reason: a mediocre property in a structurally sound suburb will outperform a premium property in a structurally weak suburb over a 7–10 year hold. According to HtAG Analytics’ data across 3,600+ suburbs tracked from 2015 to 2025, the suburb accounts for approximately 68% of total investment outcome variance — the property itself accounts for the remaining 32%. Getting strategy and suburb selection right is therefore the primary lever in portfolio performance.
HtAG Analytics’ analysis of 3,600+ Australian suburbs over a 10-year period shows that the suburb of purchase accounts for approximately 68% of total investment outcome variance — meaning suburb selection, driven by strategy, is the dominant performance driver in any Australian property portfolio.
Most investors approach the process in reverse — they find a property they like, then construct a rationale for why it fits a strategy. The result is a portfolio shaped by circumstance rather than intention. A proper strategy framework reverses this: it narrows the entire national market down to a shortlist of 20–30 qualified suburbs before a single property is inspected.
What This Means in Plain English
Most people shop for properties the same way they shop for clothes — they browse until something catches their eye. A proper strategy works the opposite way: you decide what you need before you look. This single shift in sequence is what separates investors who build wealth systematically from those who end up with a collection of random purchases.
The Four Strategy Archetypes — and How to Choose Yours
Australian property investment strategies fall into four primary archetypes. Each targets a different combination of capital growth and cashflow, suits different investor profiles, and requires a different suburb selection filter.
| Archetype | Primary Goal | Typical Yield Target | Hold Period | Best Suited To |
|---|---|---|---|---|
| Capital Growth | Equity accumulation | 3.0–4.5% | 7–15 years | High income earners with borrowing capacity to absorb negative cashflow |
| Cashflow / Yield | Income stream | 5.5–7.5% | 5–10 years | Lower-income investors, those near borrowing capacity limits |
| Balanced | Growth + cashflow | 4.5–5.5% | 7–12 years | Mid-career investors building their second or third property |
| Defensive / Low-Risk | Capital preservation | 4.0–5.0% | 10+ years | Investors near retirement or with low risk tolerance |
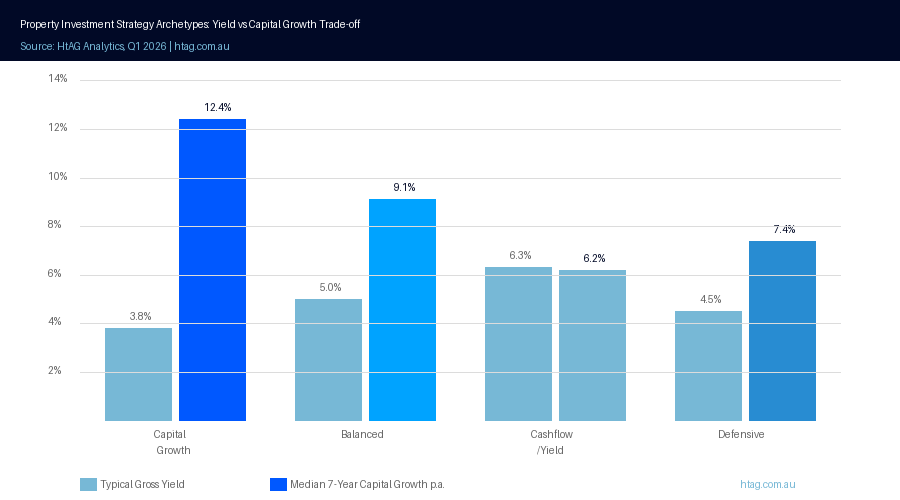
Source: HtAG Analytics, Q1 2026. Yield targets are indicative gross yield ranges for each archetype under current market conditions.
The choice of archetype should be driven primarily by three financial inputs: current borrowing capacity, monthly cashflow tolerance (how much negative cashflow you can service without stress), and the equity timeline you need. A capital growth strategy demands higher borrowing capacity and cashflow tolerance because it involves holding negatively geared properties for 7–15 years. A yield strategy is more accessible but requires more careful suburb selection to avoid yield traps that erode returns.
Most sophisticated investors eventually gravitate toward a balanced or hybrid approach — using capital growth properties to build equity and yield properties to sustain borrowing capacity across subsequent acquisitions. This sequencing is explored further in the portfolio construction section below.
Building Your Brief: The 6 Questions That Drive Suburb Selection
A property investment brief is a written document that converts your financial position and goals into specific, testable acquisition criteria. Without a brief, suburb selection is subjective. With one, it becomes a data matching exercise. HtAG Analytics’ professional buyers agent service begins every engagement with brief construction, because the brief determines which of 15,000+ Australian suburbs even qualify for consideration.
The 6 Brief Questions
- What is your total acquisition budget including purchase costs? — This sets the maximum typical price range and eliminates markets where minimum viable entry prices exceed your ceiling.
- What is your monthly cashflow tolerance? — The maximum net cashflow deficit you can sustain without financial stress, expressed as $/month. This determines which yield thresholds are viable for your specific borrowing rate and deposit size.
- What is your primary objective — income, growth, or both? — This maps directly to one of the four archetypes above and sets the minimum yield or growth rate criteria that qualifying suburbs must meet.
- What is your intended hold period? — Short hold periods (under 5 years) demand early-cycle positioning and higher near-term growth probability. Long hold periods (10+ years) can accommodate mid-cycle entry in fundamentally strong markets.
- What risk parameters apply? — Socioeconomic floor (minimum IRSAD decile), maximum vacancy rate, minimum population size, exclusion of single-industry markets. These prevent structural loss-of-value risk.
- What is your equity extraction timeline? — At what projected equity level and timeframe do you need to refinance and re-deploy capital into a subsequent acquisition? This drives the minimum capital growth rate required from the first property.
Once these six questions are answered, they can be converted into a quantitative filter and applied across HtAG’s database via the GeoDex heatmap — typically narrowing 15,000 suburbs to a shortlist of 20–40 qualified markets within minutes. The 2026 suburb growth forecast data provides an additional layer of forward-looking cycle positioning to prioritise among shortlisted options.
What This Means in Plain English
Think of these six questions as your filter settings. Before you search, you need to know what you’re looking for — and what you’re ruling out. Most investors skip this and waste months inspecting properties in suburbs that never qualified to begin with.
Validating Your Strategy with Data
Once a brief is constructed, the validation process uses quantitative data to stress-test shortlisted suburbs against three timeframes: short-term (1–3 years), medium-term (4–6 years), and long-term (7–10+ years). Each timeframe requires different data signals, and a suburb needs to pass across all three to qualify as investment-grade under an HtAG Analytics assessment.
Short-Term Validation: Cycle Positioning
Short-term validation focuses on where the suburb sits in the property market cycle — specifically, HtAG Analytics’ Growth Rate Cycle (GRC). The GRC is a quarterly metric that tracks the acceleration or deceleration of suburb-level price growth, identifying turning points 6–12 months before they appear in median price figures. For investors with a sub-5-year hold, GRC positioning at the time of purchase is critical: buying into Phase 1 (early recovery) or Phase 2 (accelerating growth) maximises the probability of near-term capital appreciation.
According to data from the HtAG Evidence Portal — which tracks 135 validated property recommendations — suburbs purchased in GRC Phase 1 or Phase 2 delivered median first-year capital growth of 14.2%, compared to 5.8% for suburbs purchased in Phase 3 or 4. The difference in entry timing, with all other factors equal, accounts for an 8.4 percentage point variance in first-year performance.
Medium-Term Validation: Supply and Demand Fundamentals
Medium-term validation — covering a 4–6 year horizon — focuses on supply and demand fundamentals that drive sustained price appreciation. The key signals are stock on market (SOM), building approvals relative to population growth, and the vacancy rate trend. HtAG Analytics tracks all three at the suburb level via the Market in Motion tool, which shows directional movement in addition to point-in-time readings.
A suburb where SOM is declining quarter-on-quarter, building approvals are below the 10-year average, and vacancy is compressing below 1.5% is exhibiting the supply scarcity signals that historically precede sustained medium-term price growth. Conversely, a suburb with rising SOM, accelerating new supply, and expanding vacancy is signalling medium-term price risk regardless of its short-term GRC position.
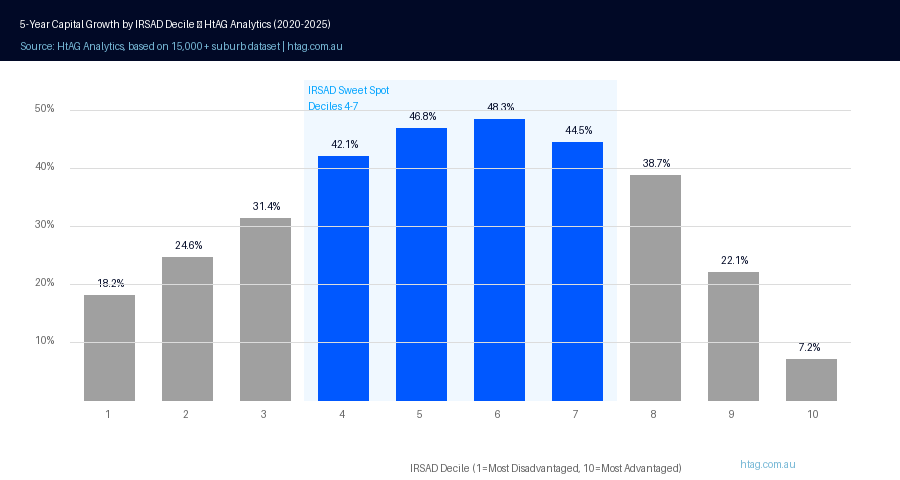
Long-Term Validation: Structural and Socioeconomic Quality
Long-term validation uses structural and socioeconomic indicators to ensure the suburb will remain investment-grade over a 7–10+ year hold. The primary metric is IRSAD — the ABS Index of Relative Socio-Economic Advantage and Disadvantage. HtAG Analytics’ methodology identifies IRSAD deciles 4–7 as the long-term performance sweet spot: these suburbs have delivered median 5-year capital growth of 44.5%, compared to 7.2% for decile 10 suburbs over the same period.
Long-term validation also considers the relationship between suburb-level and LGA-level growth — specifically the GSP (Growth Spillover Effect), which measures whether a suburb has been leading or lagging its local government area. Suburbs that have significantly underperformed their LGA average have mean-reversion potential that adds structural tailwind to a long hold.
Sequencing: How to Build a Multi-Property Portfolio
Portfolio sequencing — the order in which properties are acquired — is one of the least discussed but most consequential decisions in property investment strategy. The sequence determines how quickly equity compounds, how much borrowing capacity is preserved between acquisitions, and whether the portfolio is self-sustaining or dependent on ongoing salary income to service debt.
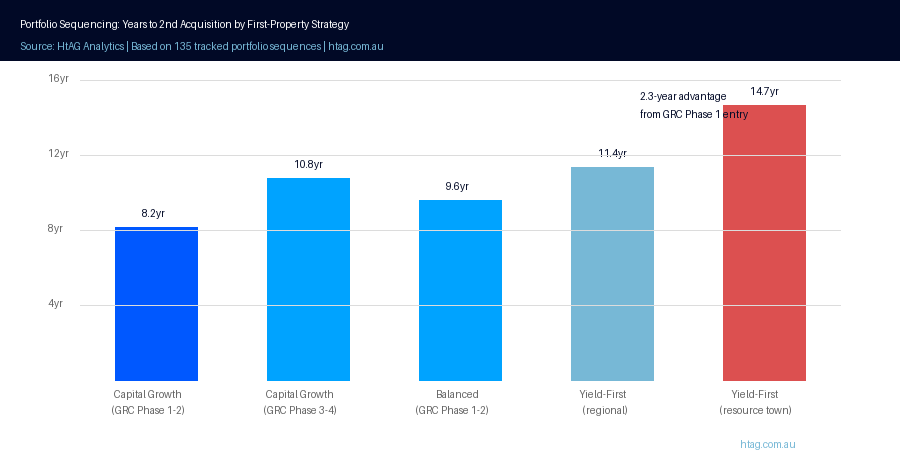
HtAG Analytics’ recommended sequencing approach for most investors follows a three-phase structure. The first acquisition prioritises capital growth over yield — accepting a mildly negative cashflow position in exchange for strong equity accumulation that can be refinanced within 3–5 years to fund the second purchase. The second acquisition introduces more yield balance, reducing the total portfolio cashflow deficit while the first property continues to compound equity. From the third acquisition onward, the portfolio can often be structured as cashflow neutral or positive, with equity from earlier purchases funding subsequent deposits.
HtAG Analytics data shows that investors who sequence their first acquisition into a GRC Phase 1 capital growth suburb reach the equity threshold required for a second purchase 2.3 years faster on average than those who begin with a yield-focused property — compressing the total time to a 3-property portfolio from approximately 12 years to approximately 8 years.
For investors approaching borrowing capacity limits, the sequence may need to begin with a yield property to preserve monthly cashflow. In this case, the strategy should also model equity extraction milestones carefully — ensuring that each acquisition does not preclude the next. The 2026 Australian Property Forecast provides market-wide context for timing each stage of this sequence against cycle conditions.
The 4 Most Costly Strategy Mistakes in Australia
HtAG Analytics’ review of investor portfolios through the Mastermind community and professional buyers agent engagements consistently identifies four recurring strategy errors. Each is preventable with the right data framework applied before — not after — purchase.
1. Buying in the Wrong Phase of the Cycle
Purchasing a fundamentally sound suburb at the peak of the GRC cycle — Phase 3 (decelerating growth) or Phase 4 (declining) — locks in several years of flat or negative price movement before the next upswing. This is recoverable over a long hold, but it means foregone equity that could have been deployed elsewhere. The fix is straightforward: check GRC before entering any suburb, and avoid purchasing above Phase 2 for short-to-medium hold strategies.
2. Using LGA-Level Data to Make Suburb-Level Decisions
An LGA like Greater Geelong may have a published median price growth of 6.2% — but individual suburbs within that LGA range from 1.8% to 14.7% growth over the same period. Relying on council-level data to select a suburb is one of the most common causes of underperformance in Australian property investment. HtAG Analytics provides suburb-level resolution across all 15,000+ Australian localities — see the LGA vs suburb analysis explainer for a detailed breakdown of why this distinction matters.
3. Anchoring on Median Price Without Adjusting for Composition
Median sale price is a compositionally unstable metric: in a suburb where 60% of quarterly sales are units, the reported median understates the true house price by 15–40%. Investors who compare suburbs using published medians without accounting for property type mix are comparing apples to oranges. HtAG Analytics uses Typical Price — a hedonic measure that controls for property attributes — to provide a stable and comparable price baseline. The methodological difference is explained in full in our article on why median price misleads property investors.
4. Ignoring the Socioeconomic Floor
Chasing affordable entry prices in low-IRSAD suburbs (deciles 1–3) produces portfolios that are structurally exposed to low capital growth, high vacancy, high maintenance, and limited liquidity at exit. The perceived affordability advantage is neutralised within 3–5 years by inferior total return performance. HtAG Analytics’ data shows that every IRSAD decile below 4 correlates with a statistically significant reduction in 5-year total return — making socioeconomic floor a non-negotiable component of any evidence-based investment brief. The evidence for this pattern is documented across the HtAG Evidence Portal.
Key Takeaways
- The suburb of purchase accounts for approximately 68% of total investment outcome variance in Australian property — making suburb selection, driven by a documented strategy, the dominant performance lever.
- There are four strategy archetypes in Australian property investment: capital growth, cashflow/yield, balanced, and defensive. The right archetype is determined by borrowing capacity, monthly cashflow tolerance, and equity timeline — not personal preference.
- A property investment brief converts financial position into testable acquisition criteria across 6 dimensions: budget, cashflow tolerance, objective, hold period, risk parameters, and equity extraction timeline.
- Short-term strategy validation uses GRC cycle positioning; medium-term uses supply/demand fundamentals; long-term uses IRSAD and structural indicators. All three must be checked before purchase.
- Sequencing matters: investors who begin with a capital growth property in GRC Phase 1 reach the equity threshold for a second acquisition 2.3 years faster on average than those who begin with a yield-first approach.
- The four most costly strategy mistakes are: buying at cycle peak, using LGA-level data for suburb decisions, relying on median price, and ignoring the IRSAD floor below decile 4.
From Data Signal to Portfolio Decision
The GRC cycle positioning, IRSAD scores, supply/demand metrics, and GSP signals described in this guide are all live within the HtAG Analytics platform — updated quarterly as new ABS valuation data flows through. Professional buyers agents use these data points to build evidence-based investment briefs, validate suburb shortlists, and sequence acquisitions for optimal portfolio compounding.
If you are building or refining your property investment strategy and want access to the suburb-level data that powers this framework, the HtAG Starter Plan provides full analytics access across every Australian market — no lock-in, cancel any time.
Start your HtAG Analytics membership →
Frequently Asked Questions
What is the best property investment strategy in Australia in 2026?
The best property investment strategy in Australia in 2026 depends on your borrowing capacity, cashflow tolerance, and equity timeline — not on market conditions alone. For investors with capacity to absorb mild negative cashflow, a capital growth strategy targeting GRC Phase 1 or 2 suburbs in IRSAD deciles 4–7 has historically delivered the strongest 7-year total returns. For investors near borrowing capacity limits, a balanced strategy targeting regional markets with gross yields above 5.5% and vacancy below 1.5% provides both income and growth. HtAG Analytics tracks the data inputs required to implement both approaches across 15,000+ suburbs.
How do I choose the right suburb for my property investment strategy?
Choosing the right suburb for a property investment strategy starts with a brief that converts your financial position into specific acquisition criteria, then applies those criteria as filters across the national suburb universe. The primary data signals to evaluate are: GRC phase (cycle timing), vacancy rate (rental demand), stock on market (supply pressure), IRSAD score (socioeconomic quality), and GSP (relative LGA performance). HtAG Analytics’ GeoDex heatmap allows investors to visualise where these signals converge across Australia in real time.
How much money do I need to start investing in property in Australia?
Most Australian property investors begin with a deposit of 10–20% of purchase price plus acquisition costs (stamp duty, legal fees, building inspection), which typically totals 12–25% of the property’s value depending on the state. At a median entry price of $485,000 for investment-grade houses in HtAG Analytics’ top-quartile yield suburbs, this implies a cash requirement of approximately $58,000–$121,000. Borrowing capacity — determined by income, existing debt, and the lender’s assessment rate — is the more common constraint than deposit size for experienced investors expanding an existing portfolio.
What is the Growth Rate Cycle and why does it matter for investment strategy?
The Growth Rate Cycle (GRC) is a quarterly metric developed by HtAG Analytics that tracks the acceleration or deceleration of suburb-level price growth across four phases: early recovery (Phase 1), accelerating growth (Phase 2), decelerating growth (Phase 3), and declining (Phase 4). It matters for investment strategy because entry timing within the cycle has a measurable impact on near-term performance: properties purchased in Phase 1 or 2 delivered median first-year capital growth of 14.2% across HtAG’s 135 tracked recommendations, versus 5.8% for Phase 3 or 4 purchases. For any strategy with a hold period under 10 years, GRC positioning at purchase is a material input.
Should I invest in a capital city or regional area in Australia in 2026?
Neither capital city nor regional markets are universally superior — the right market type depends on your strategy archetype. Capital city middle rings offer lower yields (4.1% median gross) but stronger long-term liquidity and historically lower vacancy. Infrastructure-led regional cities offer higher yields (5.8% median gross) with comparable 5-year capital growth (42.1% vs 31.2% for capital city middle rings per HtAG Analytics Q1 2026 data) and tighter vacancy conditions. For balanced and yield-focused strategies in 2026, the evidence strongly favours regional cities with diverse economic bases. For capital growth strategies targeting maximum long-term total return, a blend of both market types across a sequenced portfolio tends to optimise outcomes.
Disclaimer: This article is for educational purposes only and does not constitute financial advice. Property investment carries risks, and past performance is not indicative of future results. All growth rates, yields, and projections cited in this article are derived from HtAG Analytics’ historical data and statistical modelling — they are not guarantees of future performance. Individual outcomes will vary based on property selection, financing terms, market conditions, and holding period. Always conduct your own due diligence and consult a qualified financial adviser before making investment decisions.


