


Short Summary
The five signs a suburb is about to boom aren’t mysterious. They’re quantifiable, observable, and predictable when you use the right property market data Australia tools. Stop relying on gut feel. Start stacking probabilities in your favour.
How to Find High Capital Growth Suburbs Before the Market Catches On
If you’re searching for the best suburbs to invest in Australia 2026, relying on “gut feel” or glossy brochures won’t cut it. Every suburb that booms shares the same specific DNA—a “perfect storm” of economic factors that savvy investors can identify before the price explosion happens.
Smart investors use suburb growth forecasts and data-led tools like HtAG’s proprietary analytics to stack the probabilities in their favour. By analysing five specific, evidence-based metrics, you can spot the next high capital growth suburbs before the broader market catches on. Here are the 5 signs a suburb is about to boom, backed by real property market data.
1. High Sales Velocity: The Foundation of Reliable Forecasts
The first sign is often the most overlooked: a suburb must have high historical sales velocity. Sales data is the bedrock of any reliable suburb growth forecast; without it, you’re just guessing.
Why it matters:
- Clear Patterns: More sales equal a discernible pattern. This volume provides the statistical certainty needed to predict future performance and identify high capital growth suburbs.
- Reliable Signals: Booming suburbs leave clear statistical footprints. High data confidence means these patterns are real and repeatable, not just a random spike from one odd sale.
What to look for:
When using real estate investment software, search for “Medium to High Data Confidence” scores across your metrics. This ensures that the capital growth projections you’re seeing are based on robust, stable trends rather than market noise.
- Consistent sales volumes across multiple timeframes (1, 3, and 5-year trends)
- Sales data that confirms correlated movements between price, rental yield, and demand
Suburbs with strong data confidence are more likely to appear on lists of suburbs about to boom
2. Favourable Risk-Adjusted Profile: Low Risk, Strong Upside
In the deterministic game of investing, risk is anything that stops you from realising your capital growth or cash flow goals. To find up and coming suburbs, you must first filter out those with high economic or environmental volatility.
Two types of risk to monitor:
Economic Risk: Avoid towns with high industry centralisation (e.g., mining towns, agricultural hubs). These areas are prone to volatility that dramatically lowers long-term capital growth averages. A diversified economy is a sign of stability.
Environmental Risk: High exposure to floods or bushfires increases insurance and holding costs, making the area unattractive to both owner-occupiers and investors—the two groups needed to drive a genuine boom.
The HtAG Advantage:
Use HtAG’s Relative Composite Risk Score (RCS Risk) to find the sweet spot. You want a lower-to-moderate risk score compared to nearby suburbs. This signals a favourable reward-to-risk ratio, meaning you’re being compensated with growth for the risk you’re taking.
Key signals:
- RCS profiles that look better than your city’s broader average on a like-for-like basis
- Red flag: Extremely low risk but very low upside often means the market is fully priced and mature
3. High Socio-Economic Profile: The Affluence Signal
Socio-economic status (IRSAD – Index of Relative Socio-Economic Advantage/Disadvantage) is a powerful indicator of affluence and purchasing power. Simply put: money follows advantage. The wealthier the population, the greater their ability to bid up property prices and sustain long-term growth.
The “Perfect Storm” Scenario:
High socio-economic status becomes explosive when combined with affordability.
Example of a mature market: A suburb like Double Bay in NSW has exceptional socio-economics but an expensive price point ($4M+), which limits the volume of buyers competing for properties.
Example of a boom signal: Find a suburb with a “Double Bay-esque” demographic profile—high incomes, education, employment stability—but where houses still cost $700K. This discrepancy creates a “perfect storm” for rapid appreciation as wealthier residents discover and move into the area.
What to Look For:
Target suburbs that combine two critical success factors: superior socio-economic indicators (IRSAD scores of 10/10) paired with entry-level pricing under $900,000. These characteristics create a compelling investment thesis because they’re accompanied by tangible markers of neighbourhood transformation, including:
- The emergence of boutique cafes, dining establishments, and lifestyle-focused retail that signals rising demand and disposable income within the area
- Active renovation and property improvement initiatives, reflecting owner confidence and neighbourhood appeal
- Educational infrastructure expansion, including improved school ratings and new learning facilities that attract quality-conscious families
- An influx of young professionals and growing families seeking affordable access to well-resourced, desirable neighbourhoods
Why Elevated Socio-Economics Predicts Sustained Growth:
Suburbs demonstrating strong socio-economic metrics function as demographic and wealth magnets. Higher-income residents concentrate in these areas, creating compounding demand pressures against limited housing supply.
This dynamic—where supply constraints meet escalating buyer competition—establishes the conditions for sustained price appreciation. The process becomes self-reinforcing: improved amenities attract higher-income demographics, which further intensifies scarcity value and accelerates long-term capital growth.
4. Healthy Affordability Index: Room for Prices to Rise
The primary driver of purchasing patterns in Australia is affordability. For a market to boom, property must remain affordable enough for both owner-occupiers and investors to compete—driving up competition and, consequently, prices.
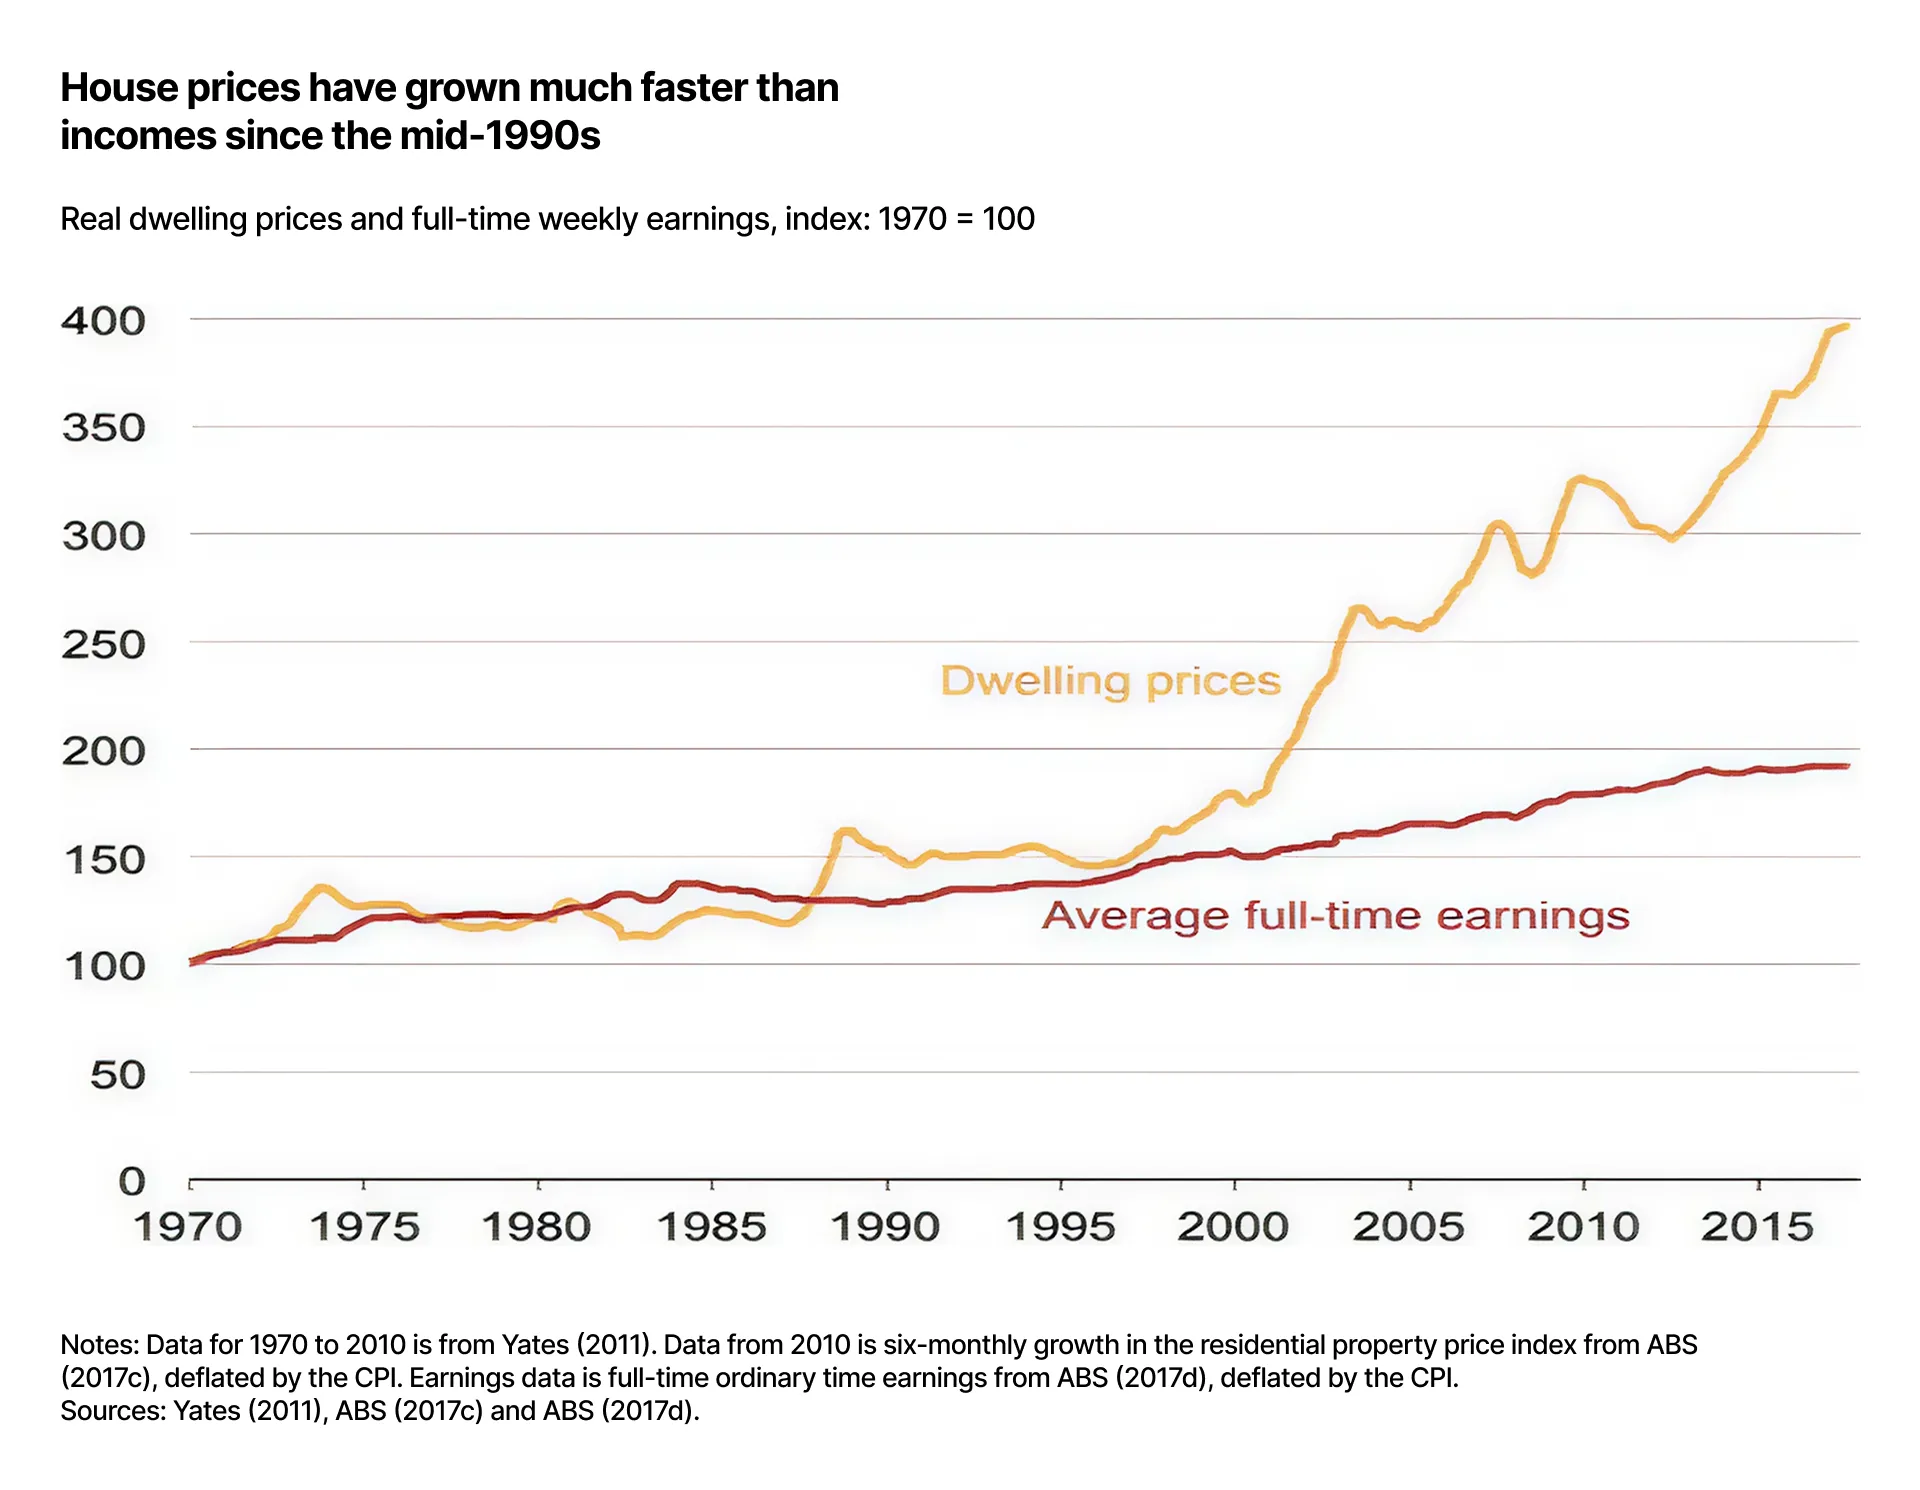
The Critical Gap:
The gap between property prices and wage growth is at its widest since 1970. This creates a paradox: most suburbs are unaffordable, but some remain accessible and are positioned to boom.
The Affordability Arbitrage:
Look for suburbs where the Affordability Index shows clear headroom for price growth. The ideal target is a suburb that is:
- Significantly cheaper than its premium neighbouring suburbs
- Has a high socio-economic profile (IRSAD) while still accessible to local wage earners and young professionals
This often precedes “price convergence,” where buyers trade sideways from expensive areas into these undervalued property markets, forcing prices up as demand increases.
Practical signals:
- Young professionals moving into the area from more expensive postcodes
- Rising auction competition while the Affordability Index suggests capacity for further price growth
Closing price gap between this suburb and nearby premium areas (price compression)
5. Supply Scarcity: Why Tight Stock Matters More Than Demand
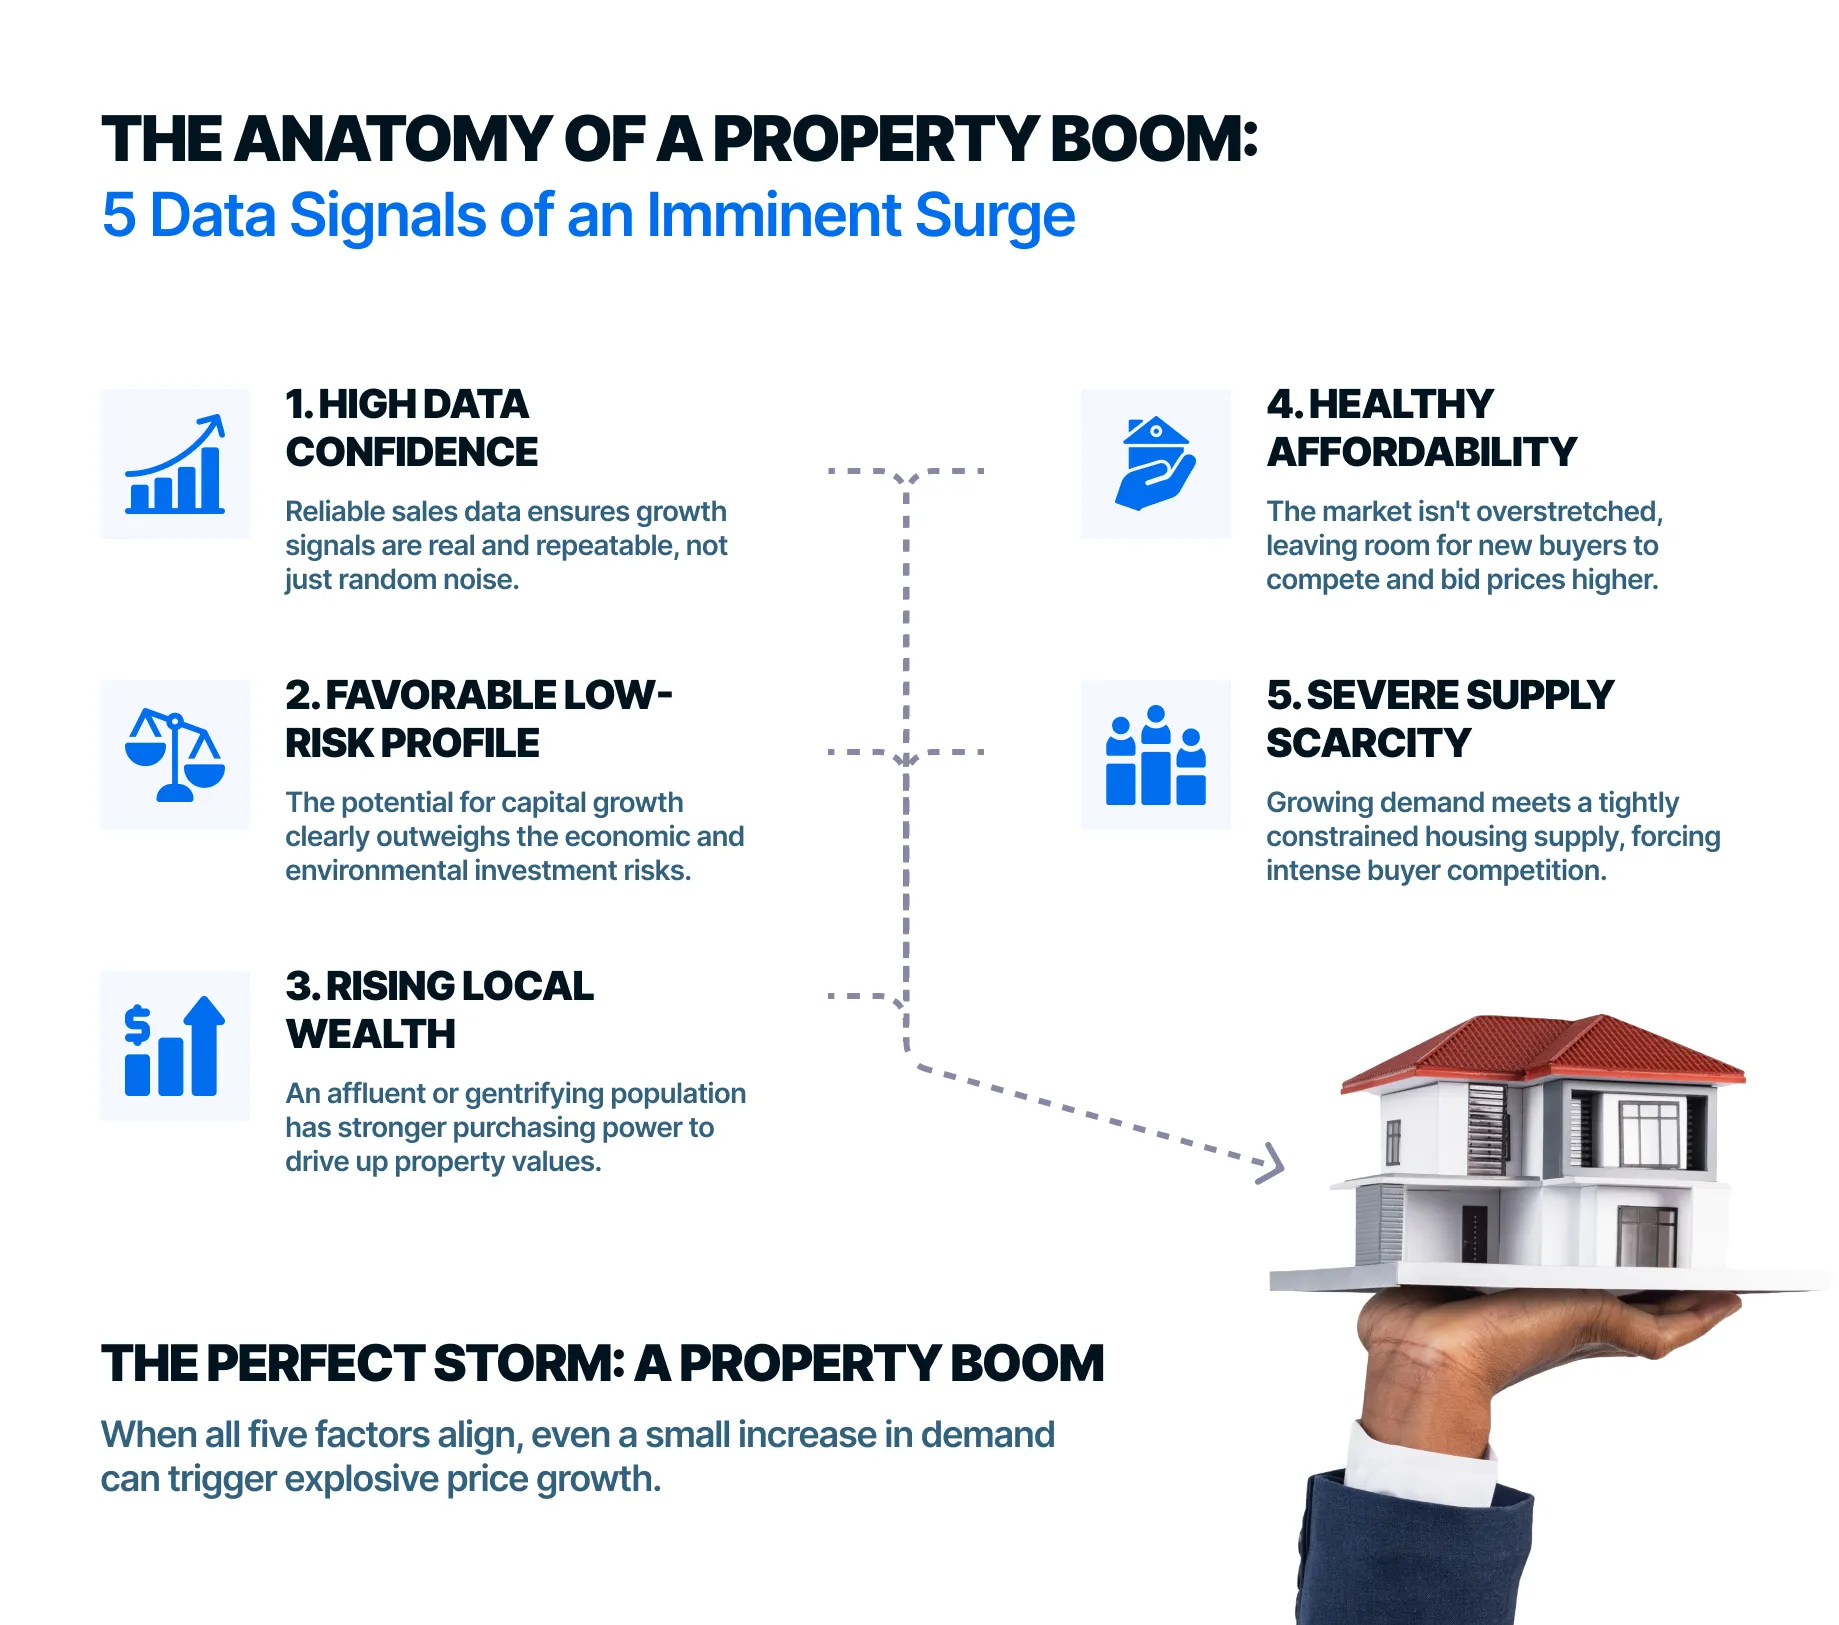
Most people focus solely on demand, but a suburb can only boom if there is severe supply scarcity. Demand can be manufactured by marketing, but supply cannot be controlled at scale.
This is the critical insight: when a suburb has a diversified economy, high affordability, affluent residents, but not enough homes for sale, even small increases in demand lead to massive price growth.
Why supply matters more than demand:
- Demand is controlled by purchasers, agencies, and fintechs who can direct buying traffic to specific markets
- Supply is constrained by factors outside investor control: government planning approval, new development pipelines, owner willingness to sell, and interest rate policies
Signs of genuine scarcity:
- Low Listings: Persistent low stock levels relative to historical averages (not seasonal dips)
- Tight Vacancy Rates: Falling vacancy rates by suburb indicate pressure in the rental market, attracting investors chasing both rental yield and capital growth
- Demand Spillover: Shorter selling times indicate competition and scarcity
The Classic Boom Pattern:
Continued sale velocity and high industry diversification → prices accelerate dramatically while limiting downside exposure
High IRSAD → suburb becomes more desirable
Affordability remains competitive vs neighbours and Australian averages → more buyers move in
Supply fails to keep pace → scarcity intensifies
Ready to analyse your shortlist?
Start your free analysis today and see which suburbs in your target area are statistically primed for a boom.

Your Data-Backed Investment Checklist
To find the best suburbs to invest in Australia for 2026, don’t just guess. Run your shortlist through this evidence-based checklist:
□ Data Confidence: Is the sales volume high enough and consistent enough to provide a clear, reliable signal?
□ RCS Score: Is the risk-adjusted return favourable relative to nearby suburbs and the broader city average?
□ IRSAD Profile: Is the demographic profile improving or already established at a solid level?
□ Affordability Index: Is there still headroom for local incomes to support further price rises?
□ Supply Scarcity: Are listings persistently low and vacancy rates tight? If a suburb ticks all five boxes, it is statistically primed for above-average capital growth. These are the suburbs most likely to appear on next year’s “best suburbs to invest in Australia,” “high capital growth suburbs,” and “next property hotspots in Australia” lists.
From Data to Action: Spot the Next Hotspot
To move from theory to investment:
- Shortlist a few suburbs you’re considering
- Analyse each one using real estate investment software—look at the Australian property market through the lens of all five metrics
- Compare side-by-side:
- Which suburb has the strongest data confidence?
- Which has the best risk-return balance (RCS Risk Score)?
- Which shows the highest levels of affluence (IRSAD)?
- Which still has affordability headroom?
- Which has genuine supply constraints?
- Prioritise suburbs where socio-economic profile and affordability are high indicating substantial room for long term growth, supply is genuinely constrained, and HtAG’s data confidence and RCS Risk Score metrics alleviate the dangers of future volatility and reduced annual growth averages.
This is how you move from hoping to find high capital growth suburbs to knowing you’ve found them.
What Sets HtAG Apart
Unlike generic “best suburbs” lists from news outlets (which focus on past performance), HtAG’s suburb growth forecasts use predictive modelling and real-time data to identify where appreciation is about to happen. Our property heatmap visualises supply scarcity and demand hotspots. Our RCS Risk Score (Relative Composite Risk Score) and IRSAD profiling give you institutional-grade analytics previously available only to commercial property firms.
Ready to analyse your shortlist? Start your free analysis today and see which suburbs in your target area are statistically primed for a boom.


