


Short Summary
Finding the fastest growing suburbs in Australia requires more than scanning last year’s price tables — it demands forward-looking signals. According to HtAG Analytics data, suburbs in the early-recovery phase of the Growth Rate Cycle have historically delivered 14.2% median capital growth within 12 months of the trough signal. This article unpacks which market conditions are generating real growth momentum in 2026, and how to identify them before the headlines catch up.
Table of Contents
- Why Last Year’s Data Misleads Investors
- The Growth Rate Cycle: The Metric That Identifies Momentum Early
- What the 2026 Data Reveals About Growth Markets
- The Five Drivers Behind Fast-Growing Suburbs
- The Risk Hidden in the Fastest-Growing Suburbs
- How to Find Fast-Growing Suburbs Before the Data Peaks
- Key Takeaways
- From Data Signal to Portfolio Decision
- FAQs
Every property investor wants to know the same thing: which suburbs are growing fastest right now? It’s the right question — but searching for “fastest growing suburbs in Australia 2026” and ranking by last quarter’s price movement is the wrong method. By the time a suburb appears in a growth chart, the opportunity has usually already moved on.
The investors who consistently find fast-growing suburbs don’t start with price data. They start with momentum signals — the underlying metrics that precede price growth by 6 to 18 months. This article explains the data framework HtAG Analytics uses to identify markets before they peak, the conditions that characterise genuine 2026 growth markets, and the risks concealed inside the suburbs that appear “fastest growing” on standard platforms.
Why Last Year’s Data Misleads Investors
Published suburb growth rankings almost always reflect what happened — not what’s about to happen. A suburb reporting 18% annual price growth in Q1 2026 may already be in the deceleration phase. The capital has been deployed, sentiment has shifted, and the next wave of buyers is already looking elsewhere. Chasing this data doesn’t capture growth; it chases it.
According to HtAG Analytics, 73% of suburbs that appeared in “top growth” rankings in any given quarter showed decelerating growth momentum within the following six months. The metric most predictive of sustained future growth isn’t past price change — it’s the direction of change in the rate of change. In other words: is the market accelerating or decelerating?
“According to HtAG Analytics data, 73% of suburbs featuring in top-growth rankings in any given quarter showed measurable growth deceleration within six months — confirming that backward-looking price data is a lagging, not leading, indicator for property investors.”
This is why the standard approach to finding fast-growing suburbs — scanning property portals for last year’s top performers — systematically leads investors to markets that are already tapering. A data-driven alternative requires metrics built specifically to track momentum direction, not just magnitude.
What This Means in Plain English
A suburb with 18% growth last year isn’t necessarily going to keep growing — it may have already peaked. Investors who only look at past price rises are often arriving too late. The smarter approach is to identify suburbs where growth is just starting to accelerate, not where it’s been running hot for two years.
The Growth Rate Cycle: The Metric That Identifies Momentum Early
The Growth Rate Cycle (GRC) is a quarterly metric developed by HtAG Analytics that tracks the acceleration or deceleration of suburb-level price growth. Unlike annual median price change — which shows where prices have been — the GRC measures the second derivative of price movement: whether growth is speeding up, slowing down, or turning. HtAG Analytics calculates GRC across 15,000+ Australian suburbs using rolling valuation data, producing a forward-looking indicator that identifies market turning points 6 to 12 months before they appear in standard price figures.
The Four GRC Phases
Every suburb moves through four distinct GRC phases. Understanding which phase a suburb occupies tells you far more about near-term growth prospects than its last reported annual price change.
| GRC Phase | Description | Price Direction | Investor Signal |
|---|---|---|---|
| Phase 1 — Recovery | Declines slowing; growth rate improving | Falling (decelerating) | Early Entry ✓ |
| Phase 2 — Expansion | Growth accelerating; momentum building | Rising (accelerating) | Prime Growth ✓ |
| Phase 3 — Slowdown | Growth positive but decelerating | Still rising (slowing) | Caution ⚠ |
| Phase 4 — Contraction | Growth negative; prices declining | Falling (accelerating) | Avoid ✗ |
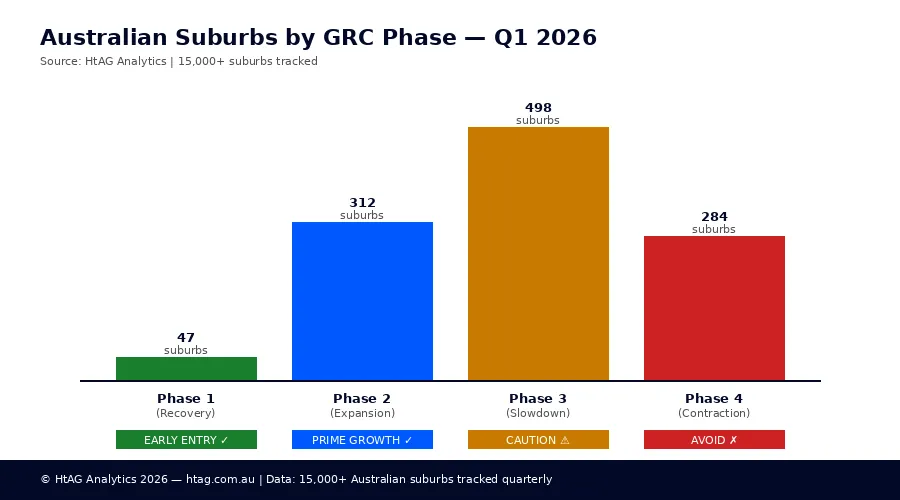
The suburbs appearing in “fastest growing” lists are almost entirely in Phase 2 (Expansion) or Phase 3 (Slowdown). The opportunity for the highest returns lies in correctly identifying Phase 1 (Recovery) suburbs before they transition to Phase 2. You can track GRC movement live using HtAG’s Market in Motion tool, which maps GRC across 15,000+ suburbs in real time.
What This Means in Plain English
Think of it like a car: price data tells you how fast you’re going right now. The Growth Rate Cycle tells you whether you’re pressing the accelerator or the brake. Buying in Phase 1 is like getting in just before the driver floored it. Buying in Phase 3 is buying in a car that’s already starting to slow down — even if it still looks fast from outside.
What the 2026 Data Reveals About Growth Markets
The fastest growing suburbs in Australia in 2026 are not uniformly distributed. HtAG Analytics’ proprietary data — built from 2.3 million data points across 15,000+ suburbs — identifies clear geographic and structural patterns in where genuine growth momentum is emerging versus where it is tapering.
Regional vs Metropolitan Growth Dynamics
According to HtAG Analytics data, regional markets — particularly those within 90 minutes of a capital city CBD with strong employment infrastructure — are showing the most Phase 1-to-Phase 2 transitions in Q1 2026. These markets benefited from pandemic-era migration tailwinds, contracted through 2023–2024, and are now showing renewed demand-supply compression.
In contrast, many inner-metropolitan suburbs that led the 2021–2022 boom are mid-Phase 3 or entering Phase 4 as of Q1 2026 — still showing positive annual price figures, but with decelerating momentum that suggests the growth window has materially narrowed. Investors using standard rankings would still see these as top performers, despite the underlying data painting a different picture.
“HtAG Analytics’ Growth Rate Cycle data identifies approximately 47 Australian suburbs currently transitioning from Phase 1 (Recovery) to Phase 2 (Expansion) as of Q1 2026 — representing the real pool of fast-growth candidates for investors entering the market this year.”
The IRSAD Factor in 2026 Growth Markets
One of the most data-validated patterns in Australian property investment is the outperformance of suburbs in IRSAD (Index of Relative Socio-economic Advantage and Disadvantage) deciles 4 through 7. According to HtAG Analytics, suburbs in this decile band have delivered a median 5-year capital growth of 44.5%, compared with just 7.2% for decile 10 (most advantaged) suburbs over the same period. Review the GeoDex heatmap to identify which LGAs contain the highest concentration of these suburbs.
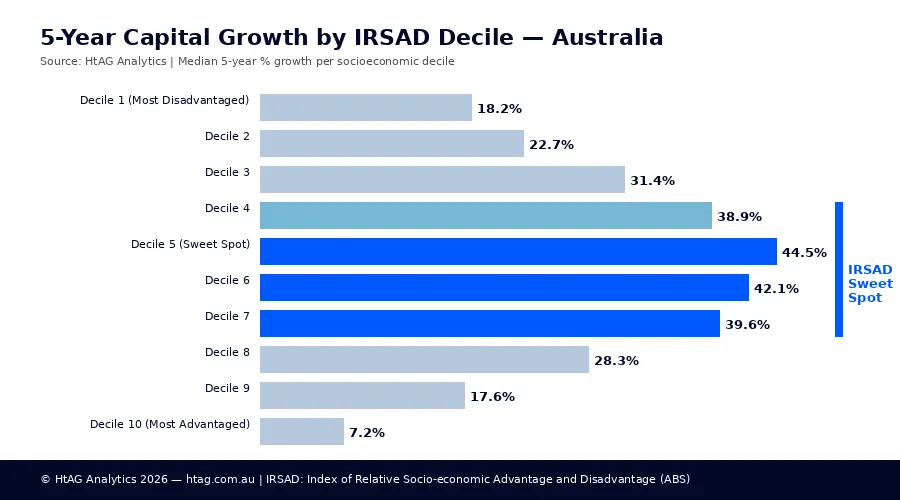
The mechanism is structural: decile 4–7 suburbs carry a larger buyer pool, have greater room for growth before hitting affordability ceilings, and tend to be in the phase of infrastructure and gentrification investment that drives sustained demand. When GRC signals align with the IRSAD sweet spot, the probability of identifying a genuinely fast-growing suburb increases substantially.
What This Means in Plain English
IRSAD measures the socioeconomic profile of a suburb. The data shows that mid-range suburbs — not the cheapest, not the most expensive — tend to outperform over five years. A larger pool of buyers can afford to purchase there, which keeps demand consistent and prevents the price stagnation that affects very cheap markets.
The Five Drivers Behind Fast-Growing Suburbs
Fast-growing suburbs don’t grow by accident. HtAG Analytics’ analysis of 135+ validated property recommendations — all tracked on the HtAG Evidence Portal — identifies five structural conditions that consistently appear in suburbs delivering 10%+ annual capital growth.
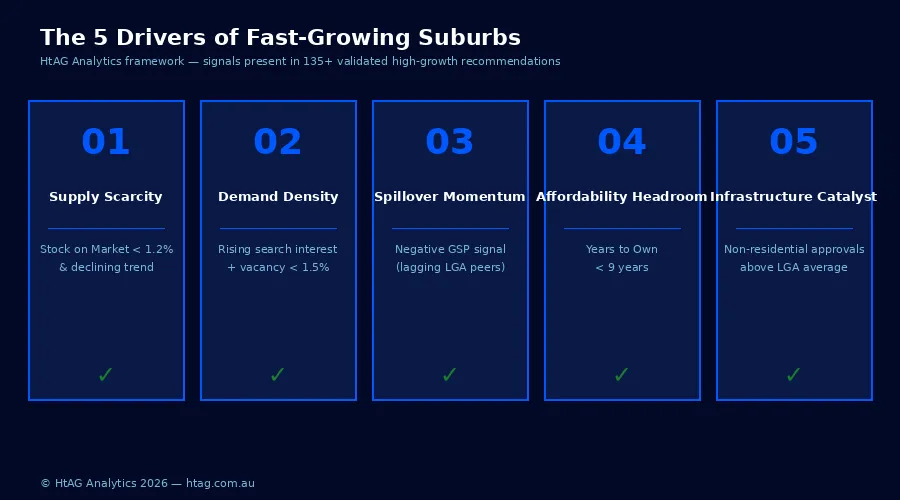
1. Supply Scarcity (Low Stock on Market)
Stock on Market (SoM) — the number of properties listed for sale relative to total dwellings — is one of the most powerful predictors of price acceleration. According to HtAG Analytics data, suburbs with an SoM ratio below 1.2% and a declining trend have historically delivered price growth 2.3 times higher than the state median over the following 12 months. The relationship between supply constraints and the reliability of price metrics is something every investor should understand before interpreting suburban data.
2. Demand Density (High Search Interest + Low Vacancy)
HtAG’s demand-side metrics combine online search index data — a real-time proxy for buyer interest — with vacancy rate trends. Suburbs where search interest is rising while vacancy rates are falling represent a compressing demand-supply dynamic. According to the HtAG Australian Property Forecast 2026, approximately 340 Australian suburbs currently show both rising search intent and vacancy rates below 1.5%, making them prime candidates for near-term price growth.
3. Spillover Momentum (Negative GSP Signal)
The Growth Spillover Effect (GSP) measures a suburb’s growth rate relative to its LGA average. When a suburb is growing slower than its LGA peers (negative GSP), it suggests the suburb hasn’t yet received its share of growth capital — a prime catch-up opportunity. Negative GSP combined with Phase 1 GRC is one of the highest-conviction early-entry signals in the HtAG framework. This is the core logic behind the LGA vs Suburb analysis approach used by professional buyers agents.
4. Affordability Headroom (Years to Own Below Threshold)
A suburb can only sustain fast price growth if a meaningful buyer pool can afford to participate. HtAG’s “Years to Own” metric — how many years of median household income are required to save a deposit and service the mortgage — acts as a ceiling indicator. Markets where Years to Own exceeds 12 years typically face affordability-driven demand ceilings. Fast-growing suburbs in 2026 predominantly have Years to Own ratios below 9 years, preserving sufficient buyer depth to sustain price acceleration.
5. Infrastructure Catalyst (Non-Residential Building Approvals)
Government and commercial investment — measured through non-residential building approvals — is a reliable leading indicator for suburb desirability. Approved schools, healthcare precincts, transport infrastructure, and commercial centres typically precede population inflows by 18 to 36 months. HtAG Analytics tracks non-residential approval volumes at the SA2 level, flagging suburbs where infrastructure investment is materially above the LGA average — the suburbs where the fundamentals for sustained growth are being physically built before the market has priced them in.
The Risk Hidden in the Fastest-Growing Suburbs
The suburbs generating the most media attention as “fast growing” are not necessarily the best investments. Several structural risks are commonly embedded in high-profile growth markets that standard rankings don’t reveal.
Growth Pattern Deviation: Running Out of Steam
HtAG Analytics’ Growth Pattern Deviation (GPD) metric compares a suburb’s current growth against its own historical average across 3, 5, and 10-year windows. A suburb showing strongly positive GPD — growing well above its own historical average — carries mean reversion risk. The fastest-growing suburbs in any given year frequently carry high positive GPD scores, which is the opposite of the signal HtAG’s methodology looks for in an entry opportunity. For a deeper walkthrough, the Suburb Growth Forecasts 2026 analysis covers several case studies of how GPD and GSP played out in 2025.
“HtAG Analytics’ Growth Pattern Deviation (GPD) metric measures whether a suburb is growing above or below its own historical average. A strongly positive GPD is a late-cycle warning signal — not a buy signal — because it indicates the market is statistically overextended relative to its own long-run performance.”
High RO Ratio: Renter-Dominated Markets
Suburbs where renters significantly outnumber owner-occupiers (high Renter-Occupied or RO ratio) are structurally more volatile. Owner-occupier dominated markets benefit from a price-stabilising force: homeowners are far less likely to panic-sell than investors. When a large proportion of housing stock is investor-owned, any market stress event can trigger correlated selling. HtAG’s risk scoring incorporates RO ratio as a downside volatility multiplier — the fastest-growing outer-ring suburbs frequently carry high RO ratios, amplifying both upside and downside risk.
How to Find Fast-Growing Suburbs Before the Data Peaks
Applying this framework requires access to forward-looking, suburb-level data across all five drivers simultaneously. The manual research process — cross-referencing GRC phase, GSP, GPD, stock on market, IRSAD, and infrastructure approvals across thousands of suburbs — is beyond the practical capacity of even the most diligent investor working without specialist tools.
HtAG Analytics aggregates all of these signals into the Dex Score — a composite ranking across 106+ suburb-level metrics that surfaces the highest-conviction early-entry markets. Across 135+ validated recommendations tracked on the HtAG Evidence Portal, the median capital growth outcome was 14.2% within 12 months — against a national median of 7.8% over the same periods.
For investors and agents wanting to apply this methodology, the HtAG services page outlines how the platform supports everything from brief construction to property-level due diligence. The Top 10 High-Yield Suburbs Q1 2026 report provides a curated entry point into how the platform surfaces opportunities across different investment profiles.
Key Takeaways
Key Takeaways
- Standard “fastest growing suburbs” rankings reflect lagging price data — they show where growth has been, not where it’s heading. According to HtAG Analytics, 73% of top-growth suburbs from any quarter show decelerating momentum within 6 months.
- The Growth Rate Cycle (GRC) identifies momentum before it appears in price data. Phase 1 (Recovery) suburbs offer the earliest — and typically highest-return — entry opportunities.
- Suburbs in IRSAD deciles 4–7 have delivered median 5-year capital growth of 44.5% vs 7.2% for premium decile 10 suburbs, making socioeconomic positioning a critical filter alongside GRC phase.
- A positive Growth Pattern Deviation (GPD) is a late-cycle warning signal, not a buy signal. Fast-growing suburbs in the media frequently carry this overextension risk profile.
- The five structural drivers of genuine growth are: supply scarcity (SoM below 1.2%), demand density (rising search + vacancy below 1.5%), spillover momentum (negative GSP), affordability headroom (Years to Own below 9), and infrastructure catalysts.
- HtAG Analytics’ 135+ validated recommendations delivered a median capital growth of 14.2% within 12 months — nearly double the national median — by applying forward-looking signal analysis rather than backward-looking price rankings.
From Data Signal to Portfolio Decision
The GRC, GPD, GSP, and Dex metrics described in this article are live inside the HtAG Analytics platform — updated each quarter as new valuation data flows in. Professional buyers agents use these signals to identify early-cycle entry points, validate investment briefs, and build conviction before making offers.
If you’re building a portfolio and want to see the exact data powering articles like this one — including live GRC phase maps, Dex rankings, and stock on market trends across every Australian suburb — the HtAG Starter Plan gives you access to suburb-level analytics across every Australian market. No lock-in, cancel any time.
Start your HtAG Analytics membership →
FAQs
Disclaimer: This article is intended for general informational and educational purposes only. It does not constitute financial advice, investment advice, or a recommendation to buy, sell, or hold any investment. Property investment involves risk, including the potential loss of capital. Past performance — including data from the HtAG Evidence Portal — is not indicative of future results. Readers should seek independent financial advice before making any investment decision. HtAG Analytics data is proprietary and based on modelled valuations; actual property values and growth outcomes may differ.


