


Short Summary
HtAG Analytics screened every Tasmanian house market against four data gates in May 2026 — 33 suburbs passed, and a weighted Dex ranking put Risdon Vale, Rokeby, Newstead, Devonport and Howrah at the top. The catch: most of the state is at the peak of its Growth Rate Cycle, and three top scorers sit outside the IRSAD sweet spot. This article shows the full top 10, the numbers behind them, and the risk flags the headline rankings hide.
The best suburbs to invest in Tasmania in 2026, according to HtAG Analytics’ May 2026 screening of the state’s house markets, are Risdon Vale, Rokeby, Newstead, Devonport and Howrah — suburbs combining 8–15% annual price growth, gross yields around 4–4.7%, and Risk-Calibrated Lower Risk Scores of 50 or above.
That answer comes from data, not opinion. Of the several hundred Tasmanian suburb house markets HtAG Analytics tracks, only 33 passed all four screening gates as at 31 May 2026: High data confidence, an RCS Lower Risk score of at least 50, and positive 1-year price growth. This article ranks those survivors with a weighted Dex composite, profiles the top 10, and — just as importantly — explains the two risk flags that should temper enthusiasm: cycle position and socioeconomic depth.
Tasmania completes our state-by-state series. If you have read the NSW, Queensland or Victoria editions, the framework will feel familiar — but Tasmania’s market structure is unlike any mainland state, and the data shows why.
Table of Contents
- How We Ranked Tasmania’s Suburbs
- The Top 10 Best Suburbs to Invest in Tasmania 2026
- Hobart’s Eastern Shore and Northern Corridor
- Launceston and the North
- Devonport and the North-West
- The IRSAD Caveat: Three Top Scorers Carry Extra Risk
- Where Tasmania Sits in the Property Cycle
- Surface This Data Inside Your AI Agent
- From Data Signal to Portfolio Decision
- Key Takeaways
- Frequently Asked Questions
How We Ranked Tasmania’s Suburbs
The ranking uses a two-stage process: a hard filter to remove unreliable or deteriorating markets, then a weighted decile score across 11 metrics for everything that survives. Stage one required High data confidence, a Risk-Calibrated Lower Risk Score (RCS) of at least 50 out of 100, and positive price growth over the past 12 months. Only 33 of Tasmania’s suburb house markets cleared all gates as at May 2026.
Stage two scored each survivor on 1-year and 10-year price growth, gross rental yield, RCS Lower Risk and Capital Growth scores, stock on market, vacancy rate, affordability (Years to Own), Growth Rate Cycle position, inventory and building approvals ratio. Each metric is converted to a decile relative to the shortlist, weighted, and summed — the same Dex methodology used across the HtAG platform and in our national suburb growth forecasts for 2026.
One note on prices: all figures below are HtAG’s typical price, a regression-based estimate of the mid-market dwelling, not the raw median. The difference between typical and median price matters in thin markets — and most Tasmanian suburbs trade fewer than 100 houses a year, so medians swing on a handful of sales.
What This Means in Plain English
We threw out every Tasmanian suburb where the data is patchy, the risk score is weak, or prices are falling. The 33 suburbs left standing were then scored against each other — like ranking students within one class — on growth, rent, supply and affordability. The top 10 below are the head of that class, not a guarantee of future returns.
The Top 10 Best Suburbs to Invest in Tasmania 2026
The top 10 best suburbs to invest in Tasmania in 2026 are Risdon Vale, Rokeby, Newstead, Devonport, Howrah, Midway Point, Austins Ferry, Lenah Valley, New Town and Norwood. Seven of the ten sit in Greater Hobart, two in Launceston, and one — Devonport — on the north-west coast. Typical prices range from $567,000 to $917,000, with gross yields between 3.6% and 4.7%.
| Rank — Suburb | Region | Typical Price | Rent /wk | Gross Yield | 1Y Growth | 10Y CAGR | GRC Phase |
|---|---|---|---|---|---|---|---|
| 1 — Risdon Vale | Hobart East | $567,439 | $511 | 4.7% | 15.3% | 11.8% | (+)Peak |
| 2 — Rokeby | Hobart East | $698,134 | $563 | 4.2% | 11.7% | 12.8% | (+)Peak |
| 3 — Newstead | Launceston | $762,170 | $628 | 4.3% | 9.7% | 7.9% | (+)Peak |
| 4 — Devonport | North-West | $602,648 | $500 | 4.3% | 9.6% | 8.7% | (+)Peak |
| 5 — Howrah | Hobart East | $879,816 | $688 | 4.1% | 9.1% | 7.1% | (+)Peak |
| 6 — Midway Point | Hobart East | $701,371 | $597 | 4.4% | 8.2% | 8.8% | (+)Peak |
| 7 — Austins Ferry | Hobart North | $750,329 | $666 | 4.6% | 15.6% | 9.1% | (+)Peak |
| 8 — Lenah Valley | Hobart Inner | $915,278 | $635 | 3.6% | 11.1% | 7.8% | (+)Peak |
| 9 — New Town | Hobart Inner | $916,858 | $660 | 3.7% | 2.6% | 6.2% | (+)Increasing |
| 10 — Norwood | Launceston | $733,996 | $566 | 4.0% | 9.4% | 8.0% | (+)Peak |
Source: HtAG Analytics, suburb house markets, all bedrooms, period ending 31 May 2026. Gross yield = weekly rent × 52 ÷ typical price.
According to HtAG Analytics data, only 33 of Tasmania’s suburb house markets passed all four investment screening gates in May 2026 — and seven of the top 10 ranked suburbs sit within Greater Hobart.
HtAG Analytics, Tasmania Suburb Screen (May 2026)
Hobart’s Eastern Shore and Northern Corridor
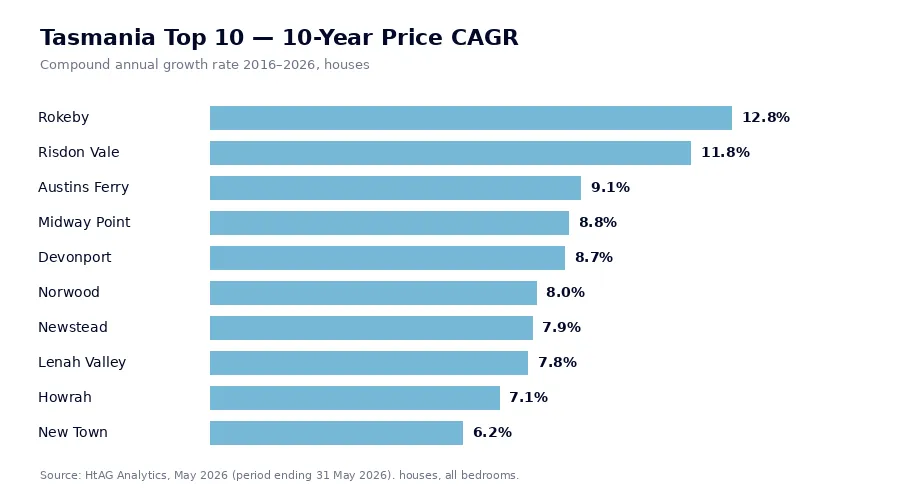
Hobart’s eastern shore dominates the ranking: Risdon Vale, Rokeby, Howrah and Midway Point claim four of the top six positions. These suburbs share a common profile — entry prices below the Hobart inner-ring, yields above 4%, and double-digit 10-year track records. Risdon Vale’s 11.8% and Rokeby’s 12.8% ten-year CAGRs are the two strongest long-term growth records in the entire Tasmanian shortlist.
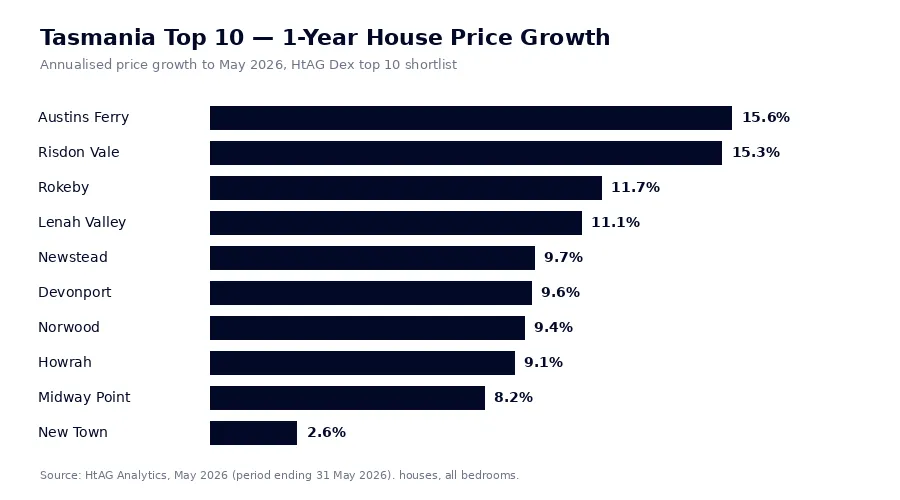
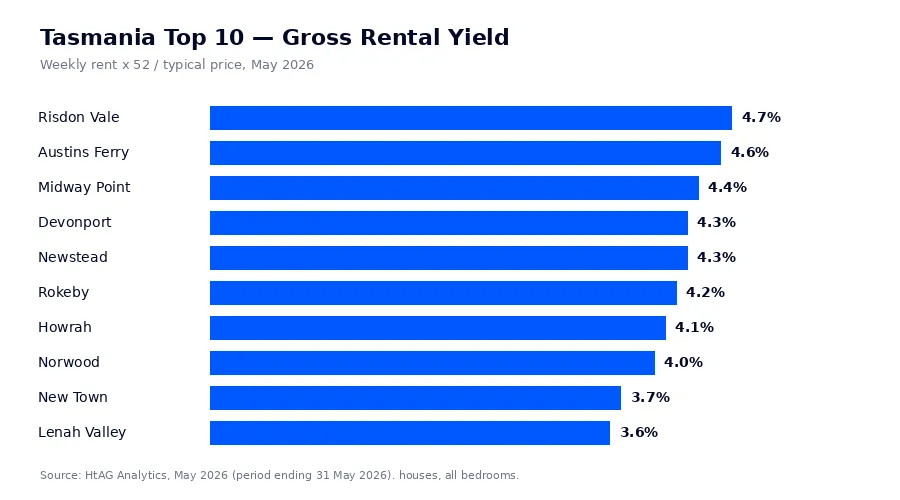
Risdon Vale, the #1 ranked market, is also the cheapest in the top 10 at a typical price of $567,439 — and it pairs that entry point with the shortlist’s highest gross yield at 4.7% and 15.3% price growth over the past year. Rents grew 10.1% in the same period, meaning yield compression has been modest despite the price surge.
On the northern corridor, Austins Ferry recorded the fastest 1-year price growth of any qualifying Tasmanian suburb at 15.6%, with a 4.6% gross yield. Further in, Lenah Valley and New Town trade affordability for socioeconomic depth — both carry typical prices above $915,000 but sit in IRSAD deciles 9 and 7 respectively, the strongest demographics in the top 10.
New Town deserves a closer look despite its modest 2.6% 1-year growth. It is the only top-10 suburb still in the (+)Increasing phase of the Growth Rate Cycle rather than at peak, and its Growth Pattern Deviation is deeply negative — current 3-year growth runs 20 percentage points below the suburb’s own historical average, and 5-year growth 27 points below. In HtAG’s framework, negative GPD signals catch-up potential rather than exhaustion.
What This Means in Plain English
Most of Hobart’s top suburbs have already run hard — they’re at the top of their growth cycle. New Town is the exception: its recent growth is well below its own long-term form, which historically means it has more left in the tank than suburbs that have already sprinted.
Launceston and the North
Launceston places two suburbs in the top 10: Newstead at #3 and Norwood at #10. Newstead is arguably the most balanced market on the list — 9.7% price growth over the past year, a 4.3% gross yield, IRSAD decile 6 (inside HtAG’s sweet spot), and the best affordability in the top 10 at 35.5 Years to Own.
Norwood runs a similar profile one notch down: 9.4% annual growth, a 4.0% yield and IRSAD decile 5. Notably, rents in Norwood grew 9.5% over the past year — faster than prices — which lifted yield slightly even as values rose. Rent-led yield expansion of this kind is the healthier variety, since it reflects tenant demand rather than price stagnation.
According to HtAG Analytics’ rental series, every suburb in the Tasmanian top 10 recorded positive rent growth over the past 12 months, ranging from 2.9% in Rokeby to 10.1% in Risdon Vale. For yield-focused strategies beyond Tasmania, our Top 10 High-Yield Suburbs Q1 2026 report covers the national leaders.
Devonport and the North-West
Devonport is the only non-Hobart, non-Launceston market in the top 10 — and the most consistent grower on the list. Its price growth reads 9.6% over one year, 6.9% annualised over three years and 8.6% over five: no boom-bust pattern, just compounding. Rent growth has matched it, averaging 8.6% a year over five years, the fastest sustained rental growth in the Tasmanian top 10.
Devonport also leads the top 10 on one forward indicator: non-residential building approvals per capita of $2,203, a multiple of every other ranked suburb bar New Town. Non-residential investment — commercial, health, education and port infrastructure — tends to precede employment growth, which in turn supports housing demand. The full picture is visible on the GeoDex heatmap, where the north-west coast’s supply-demand balance can be compared against Greater Hobart at a glance.
HtAG Analytics’ growth series shows Devonport houses compounding at 8.7% a year over the past decade with rents up 8.6% a year over five years — the most consistent price-and-rent pairing in the Tasmanian top 10.
HtAG Analytics, Annualised Growth Series (May 2026)
The IRSAD Caveat: Three Top Scorers Carry Extra Risk
Three of the top four ranked suburbs — Risdon Vale, Rokeby and Devonport — sit in IRSAD decile 1, the lowest socioeconomic band, and that materially changes their risk profile. HtAG Analytics’ research across thousands of suburbs has found the IRSAD sweet spot for investors sits in deciles 4–7, where gentrification upside meets income resilience. Decile 1 markets can deliver outstanding returns — Rokeby’s 12.8% ten-year CAGR proves it — but they are more exposed to economic shocks, tenant arrears and longer downturns.
| Suburb | IRSAD Decile | Sweet Spot (4–7)? | GPD 3Y | Years to Own |
|---|---|---|---|---|
| Risdon Vale | 1 | No — below | −13.3% | 41.5 |
| Rokeby | 1 | No — below | −2.1% | 46.0 |
| Newstead | 6 | Yes | −5.0% | 35.5 |
| Devonport | 1 | No — below | +6.3% | 41.3 |
| Howrah | 7 | Yes | −19.7% | 41.8 |
| Midway Point | 4 | Yes | −6.1% | 38.6 |
| Austins Ferry | 3 | Borderline | 0.0% | 40.0 |
| Lenah Valley | 9 | No — above | −10.9% | 39.5 |
| New Town | 7 | Yes | −20.0% | 43.6 |
| Norwood | 5 | Yes | −0.1% | 39.8 |
Source: HtAG Analytics, fundamentals and market cycle endpoints (May 2026). GPD 3Y = Growth Pattern Deviation: current 3-year growth minus the suburb’s own historical 3-year average; negative values indicate catch-up potential.
For risk-conscious buyers, the sweet-spot subset — Newstead, Howrah, Midway Point, New Town and Norwood — offers a better balance of demographics and momentum. Buyers screening at the council level would miss this distinction entirely, which is why LGA-level averages hide the best (and worst) suburbs within the same municipality.
What This Means in Plain English
IRSAD measures how advantaged a suburb’s residents are, on a 1–10 scale. The data says deciles 4–7 are the investor’s happy medium: cheap enough to grow, stable enough to hold through a downturn. Three of Tasmania’s top scorers are in decile 1 — their returns have been excellent, but they’ll feel any economic rough patch first and hardest.
Where Tasmania Sits in the Property Cycle
Nine of Tasmania’s top 10 suburbs are at the (+)Peak phase of HtAG’s Growth Rate Cycle as at May 2026 — meaning year-on-year growth is strong but no longer accelerating. This is the single most important timing signal in the dataset. Peak-phase markets can keep rising for several quarters, but the probability of deceleration grows with each one, and entry prices already reflect the run-up.
The counter-cyclical metrics add nuance. Howrah and New Town both run Growth Pattern Deviations near −20% on the 3-year window — their recent growth is far below their own historical norm, suggesting steam left in the engine. By contrast, Devonport’s GPD is positive (+6.3% on 3 years), meaning it is outperforming its own history — momentum is real, but mean reversion risk is higher. How these signals interact nationally is covered in the Australian Property Forecast 2026.
Track record matters when weighing claims like these. HtAG’s Evidence Portal publishes validated recommendations with their subsequent price outcomes, so the methodology behind this article can be checked against what actually happened — not just what was predicted.
Nine of the ten top-ranked Tasmanian suburbs sit at the (+)Peak phase of the Growth Rate Cycle in May 2026 — strong growth, but late-cycle. Only New Town remains in the (+)Increasing phase with deeply negative Growth Pattern Deviation.
HtAG Analytics, Market Cycle Endpoint (May 2026)
Surface This Data Inside Your AI Agent
The HtAG Developer Portal now exposes the data described in this article — and every other HtAG dataset — through MCP (Model Context Protocol) connectors. Investors and buyers’ agents using Claude, Perplexity, Manus AI, ChatGPT (via custom connectors) or any other MCP-compatible AI agent can query HtAG data directly inside the AI tool they already use.
A typical workflow: ask your AI agent to screen Tasmanian suburbs against your budget and risk profile, the agent calls the HtAG query and rank endpoints through MCP, and returns a shortlist built on the same live warehouse data behind this article. The whole sequence takes under 30 seconds — in fact, the rankings above were produced with exactly those endpoints.
HtAG’s MCP-enabled Developer Portal puts every metric in this article inside your AI agent. Apply for access and run the full analysis on any Australian listing without leaving Claude or Perplexity.
HtAG Analytics Developer Portal (2026)
Browse the endpoint catalogue at developer.htagai.com and submit the HtAG Developer Portal application — approved members receive an API key and an MCP setup guide for their preferred AI tool.
From Data Signal to Portfolio Decision
The Growth Rate Cycle, Growth Pattern Deviation, IRSAD and RCS metrics behind this ranking are live inside the HtAG Analytics platform — updated each quarter as new valuation, rental and supply data flows in. Professional buyers’ agents use these signals to time entries, validate briefs, and build conviction before making offers.
If you’re building a portfolio and want to see the exact data powering articles like this one, the HtAG Starter Plan gives you access to suburb-level analytics across every Australian market — no lock-in, cancel any time. If you want that same data inside your AI agent, browse the endpoints at developer.htagai.com and submit the Developer Portal application — it takes about two minutes.
Start your HtAG Analytics membership → · Apply for Developer Portal access →
Key Takeaways
- Only 33 Tasmanian suburbs passed the screen. Of the state’s suburb house markets, 33 cleared High confidence, RCS Lower Risk ≥ 50 and positive 1-year growth as at May 2026.
- Hobart’s eastern shore leads the ranking. Risdon Vale (#1) pairs the cheapest entry at $567,439 with the highest yield (4.7%) and 15.3% annual growth; Rokeby holds the strongest 10-year CAGR at 12.8%.
- The cycle is late. Nine of the top 10 are at the (+)Peak phase of the Growth Rate Cycle — only New Town is still in the (+)Increasing phase, with growth running 20–27 points below its own historical average.
- Three top scorers carry an IRSAD warning. Risdon Vale, Rokeby and Devonport sit in decile 1, outside HtAG’s 4–7 sweet spot; Newstead, Howrah, Midway Point, New Town and Norwood are the sweet-spot picks.
- Devonport is the consistency play. 8.7% price CAGR over 10 years, 8.6% annual rent growth over five, and $2,203 in non-residential building approvals per capita — the strongest forward investment signal in the top 10.
- Run this analysis inside your AI agent. The same query and rank endpoints are available through MCP connectors — apply for Developer Portal access to screen Tasmanian suburbs inside Claude, Perplexity or Manus AI.
Frequently Asked Questions
What are the best suburbs to invest in Tasmania in 2026?
According to HtAG Analytics’ May 2026 Dex ranking, the top 10 are Risdon Vale, Rokeby, Newstead, Devonport, Howrah, Midway Point, Austins Ferry, Lenah Valley, New Town and Norwood. Typical prices range from $567,439 (Risdon Vale) to $916,858 (New Town), with gross yields of 3.6–4.7%.
Is Tasmania a good place to invest in property in 2026?
Selectively, yes — but timing matters. Only 33 Tasmanian suburbs passed HtAG Analytics’ four screening gates in May 2026, and nine of the top 10 sit at the peak of their Growth Rate Cycle. Growth is strong (8–15% over the past year in the top 10) but late-cycle, so suburb selection and entry price discipline matter more than they did three years ago.
Which Tasmanian suburb has the highest rental yield in 2026?
Within HtAG Analytics’ top 10 ranked suburbs, Risdon Vale leads with a gross yield of 4.7% (typical price $567,439, rent $511/week), followed by Austins Ferry at 4.6% and Midway Point at 4.4%. Risdon Vale’s rents also grew 10.1% over the past year, the fastest in the top 10.
How do I access HtAG Tasmania suburb data inside Claude or Perplexity?
HtAG data is available through MCP (Model Context Protocol) connectors to any compatible AI agent — Claude, Perplexity, Manus AI, and others. Browse the endpoint catalogue at developer.htagai.com and submit the HtAG Developer Portal application. Approved applicants receive an API key and a setup guide.
Disclaimer
This article is for educational purposes only and does not constitute financial advice. Property investment carries risks, and past performance is not indicative of future results. All growth rates, yields, and projections are derived from historical data and statistical modelling — they are not guarantees of future performance. Always conduct your own due diligence and consult a qualified financial adviser before making investment decisions.


