


Short Summary
LGA-level data hides enormous suburb-level variation. HtAG Analytics data across 196 LGAs shows that within a single council area, the gap between the best and worst performing suburbs averages 47–60 percentage points over five years. In Ipswich alone, the spread is 271 points. Investors who filter at the LGA level risk buying the wrong suburb in the right council area.
Why LGA Data Misleads Property Investors
A Local Government Area (LGA) is an administrative boundary — a council area that contains dozens or even hundreds of individual suburbs. When property data is reported at the LGA level, every suburb within that boundary is averaged together: the high-growth pockets, the stagnant zones, and everything in between.
This averaging effect creates a dangerous illusion of uniformity. An LGA showing 120% five-year growth sounds like every suburb within it grew by 120%. In reality, some suburbs within that LGA may have delivered 220%, while others barely moved at 60%. The LGA average tells you nothing about which suburb to buy in — and for property investors, suburb selection is where 85% of the return is determined.
According to HtAG Analytics data across 196 LGAs nationally, the average growth spread between the best and worst performing suburb within a single LGA is 47 percentage points in metro areas and 60 percentage points in regional areas. That is not noise — it is the difference between a portfolio-defining purchase and a capital trap.
This is why HtAG provides both LGA and suburb-level analysis through its GeoDex heatmap — giving investors the ability to identify high-performing suburbs within any council area, rather than relying on council-level averages that mask the real opportunity.
According to HtAG Analytics data across 196 LGAs, the average growth spread between the best and worst suburb within a single council area is 47–60 percentage points over five years. LGA averages are not suburb-level reality.
The Hidden Spread: What LGA Averages Conceal
To quantify exactly how much information LGA averaging destroys, HtAG Analytics examined every LGA in Australia with at least five measurable suburbs and 15 annual sales per suburb. The results are striking.
| LGA | State | Suburbs | LGA Avg Growth | Best Suburb | Best Growth | Worst Suburb | Worst Growth | Spread |
|---|---|---|---|---|---|---|---|---|
| Ipswich | QLD | 50 | 137.1% | Ripley | 334.1% | Barellan Point | 62.5% | 271.6 pts |
| Swan | WA | 26 | 115.2% | Brabham | 221.4% | Henley Brook | 25.8% | 195.6 pts |
| Sunshine Coast | QLD | 68 | 70.5% | Nirimba | 158.1% | Caloundra | 10.8% | 147.3 pts |
| Logan | QLD | 52 | 120.8% | Logan Reserve | 218.8% | Park Ridge Sth | 75.2% | 143.6 pts |
| Townsville | QLD | 46 | 99.0% | Bohle Plains | 170.4% | North Ward | 46.0% | 124.4 pts |
Source: HtAG Analytics. Houses, all bedrooms, 5-year growth, minimum 20 annual sales per suburb.
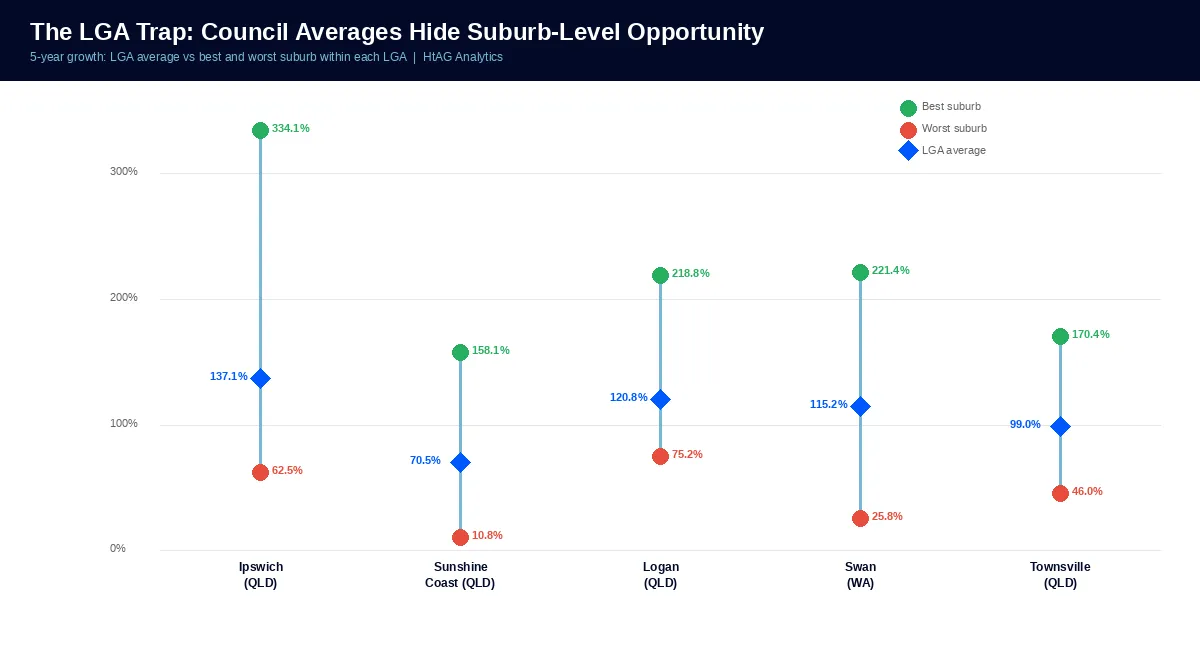
In Ipswich, the LGA average of 137.1% sounds excellent. But an investor who bought in Ripley captured 334.1% — while one who bought in Barellan Point captured just 62.5%. Both suburbs are in the same LGA, the same council area, and would appear identical on any LGA-level filter. The 271-point spread between them is entirely invisible at the council level.
This pattern repeats nationally. The Sunshine Coast LGA averages 70.5% — a number that would cause many investors to skip it entirely. But Nirimba, within that same LGA, delivered 158.1%. An LGA-level filter would have eliminated a suburb that more than doubled its value in five years.
As HtAG’s research into undervalued suburbs in Australia demonstrates, the best opportunities often sit within LGAs that look average on paper but contain individual suburbs with exceptional fundamentals.
Metro vs Regional: Where Suburb-Level Analysis Matters Most
Does the LGA averaging problem affect all markets equally? HtAG Analytics compared suburb-level variation within metro and regional LGAs across Australia.
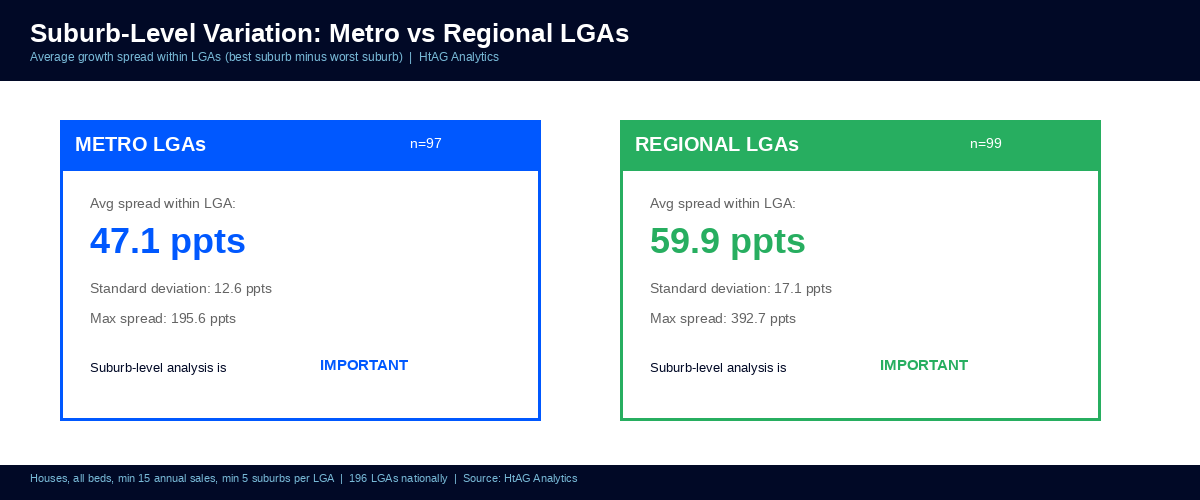
| Area Type | LGA Count | Avg Spread | Std Deviation | Max Spread |
|---|---|---|---|---|
| Metro LGAs | 97 | 47.1 ppts | 12.6 ppts | 195.6 ppts |
| Regional LGAs | 99 | 59.9 ppts | 17.1 ppts | 392.7 ppts |
Source: HtAG Analytics. 196 LGAs with 5+ measurable suburbs, min 15 annual sales. Houses, all bedrooms, 5-year growth.
Regional LGAs show 27% more internal variation than metro LGAs (59.9 vs 47.1 percentage points average spread). The maximum spread in a regional LGA reaches an extraordinary 392.7 percentage points — meaning within a single regional council area, one suburb nearly quintupled while another barely moved.
This has practical implications. In regional markets where data is thinner and sales volumes are lower, many investors default to LGA-level analysis because it feels more “statistically reliable.” But the data shows the opposite: regional LGAs are precisely where suburb-level analysis matters most, because the variation within them is greatest.
HtAG’s typical price methodology addresses this at the suburb level by using composition-adjusted valuations rather than simple medians — reducing the noise that makes suburb-level data unreliable in thin markets.
HtAG Analytics data shows regional LGAs contain 27% more internal variation than metro LGAs. Regional markets are precisely where suburb-level analysis matters most, not least.
Case Study: Ipswich LGA — 271 Points of Hidden Spread
Ipswich City in south-east Queensland is one of Australia’s fastest-growing LGAs, with a council-level average of 137.1% five-year growth. On an LGA screen, it passes every growth filter easily. But the suburb-level reality is far more complex.

Ripley — a masterplanned community in Ipswich’s south-west — delivered 334.1% five-year growth, driven by new infrastructure, strong population inflows, and a rising IRSAD trajectory as young professionals moved into new housing stock. Its RCS score is 71 — solidly positive.
Barellan Point, just 15 kilometres away within the same LGA, delivered 62.5%. While still positive, an investor in Barellan Point captured less than a fifth of the growth available in Ripley. The Australian property forecast for 2026 continues to favour south-east Queensland broadly — but the suburb-level allocation within that broad call determines whether an investor captures 300%+ or 60%.
The lesson is clear: the LGA got the investor to the right region. But only suburb-level analysis — using metrics like RCS, Growth Rate Cycle (GRC), and IRSAD trajectory — gets them to the right street.
When to Use LGA Data vs Suburb Data
LGA data is not useless — it serves a specific function at a specific stage of the research process. The key is knowing when to use each level.
Use LGA Data For:
- Initial geographic screening. Narrowing from “all of Australia” to 20–30 LGAs worth investigating.
- Regional markets with thin suburb data. Where individual suburbs have fewer than 15–20 annual sales, LGA aggregation provides more statistically reliable signals.
- Infrastructure and policy analysis. Council-level spending, zoning changes, and planning approvals operate at the LGA level.
Use Suburb Data For:
- Final suburb selection. Once an LGA is shortlisted, drill down to suburb-level metrics to identify the best-performing pocket.
- Risk assessment. Public housing concentration, IRSAD scores, and demand-supply dynamics vary dramatically at the suburb level.
- Comparable analysis and pricing. Suburb-level typical price, yield, and days on market drive purchase decisions.
- Portfolio diversification checks. Ensure you are not overexposed to a single suburb’s risk profile, even if your properties span multiple LGAs.
HtAG Analytics provides both levels through a simple toggle on the GeoDex heatmap, with 106 metrics available at the suburb level and aggregated views at the LGA level. The Evidence Portal documents how this two-level approach has powered 135 validated recommendations with a 100% hit rate.
Key Takeaways
- LGA averages conceal enormous suburb-level variation. The average spread between best and worst suburbs within a single LGA is 47 percentage points in metro and 60 in regional areas.
- In Ipswich, the spread is 271 percentage points — Ripley at 334.1% vs Barellan Point at 62.5%, both within the same council area.
- Regional LGAs are where suburb-level analysis matters most, with 27% more internal variation than metro LGAs.
- LGA data is useful for initial screening; suburb data is essential for final selection, risk assessment, and pricing.
- HtAG Analytics tracks 106 metrics at the suburb level across 4,254 suburbs — with a simple LGA/suburb toggle for two-level analysis.
- An LGA-level filter that rejects LGAs below 80% growth would miss 6.3% of strong-performing suburbs — 35 suburbs with 100%+ growth hidden in “average” LGAs.
From Data Signal to Portfolio Decision
The suburb-level metrics described in this article — including RCS, GRC, IRSAD, and the GeoDex heatmap — are live inside the HtAG Analytics platform, updated each quarter as new valuation data flows in. Professional buyers agents use these signals to drill below LGA averages, identify the best suburbs within any council area, and build conviction before making offers.
If you’re building a portfolio and want to see the exact data powering articles like this one, the HtAG Starter Plan gives you access to suburb-level analytics across every Australian market — no lock-in, cancel any time.
Start your HtAG Analytics membership →
Frequently Asked Questions
What is the difference between LGA and suburb property data?
An LGA (Local Government Area) is a council boundary containing multiple suburbs. LGA data averages all suburbs together, providing a broad view of regional performance. Suburb data provides granular, street-level metrics. According to HtAG Analytics, the average growth difference between the best and worst suburb in a single LGA is 47–60 percentage points — a gap invisible at the council level.
Should I use LGA or suburb data for property investment research?
Use both, but at different stages. LGA data is useful for initial geographic screening — narrowing from all of Australia to 20–30 council areas. Suburb data is essential for final selection, where metrics like IRSAD, RCS, public housing rates, and growth cycle positioning determine which specific suburb to invest in.
How many suburbs does HtAG Analytics track?
HtAG Analytics tracks 4,254 suburbs nationally with 106 data points per suburb, updated quarterly. The platform provides both LGA-level and suburb-level views through the GeoDex heatmap, allowing investors to drill down from council-area screening to suburb-specific analysis.
Why do regional LGAs have more variation than metro LGAs?
Regional LGAs typically cover larger geographic areas with more diverse suburb types — from mining towns to coastal communities to agricultural centres. HtAG Analytics data shows regional LGAs average 59.9 percentage points of internal spread vs 47.1 for metro, with maximum spreads reaching 392.7 percentage points in regional areas.
What is the biggest risk of using LGA data alone?
The biggest risk is buying the wrong suburb in the right council area. An LGA can pass every growth filter while containing suburbs with dramatically different fundamentals. In the Ipswich example, both Ripley (334.1% growth) and Barellan Point (62.5%) sit in the same LGA that averages 137.1%. Only suburb-level analysis reveals which pocket to target.
Disclaimer: This article is for educational purposes only and does not constitute financial advice. Property investment carries risks, and past performance is not indicative of future results. All growth rates, yields, and projections are derived from historical data and statistical modelling — they are not guarantees of future performance. Always conduct your own due diligence and consult a qualified financial adviser before making investment decisions.


