
Area vs Property: What Drives 85.7% of Growth [2026]
Area or the perfect property? HtAG data on 1,157 markets shows the area explains 85.7% of 5-year capital growth — and a $648,568 gap between regions.
Area or the perfect property? HtAG data on 1,157 markets shows the area explains 85.7% of 5-year capital growth — and a $648,568 gap between regions.
A fast, data-led workflow to shortlist investment suburbs and vet real listings in minutes – with a full video demo and the metrics behind it.
A data-driven guide to equity recycling in Australia: how much equity you can release, and how to screen the redeploy suburb with live HtAG signals.
Vacancy rates above 3% signal an 84% probability of yield decline within two quarters. Learn how to read suburb-level vacancy data — and the traps investors miss — using HtAG Analytics data.

How do professional buyers agents research suburbs? HtAG Analytics breaks down the 6-step data framework used across 135+ validated recommendations — from macro filtering to street-level due diligence.

HtAG Analytics reveals why raw suburb median price growth misleads investors — and the forward-looking metrics that detect market turns 6-12 months earlier.
![What Is the Property Market Cycle in Australia? The 4 Phases Explained [2026]](https://www.htag.com.au/wp-content/uploads/2026/03/cycle.png)
The property market cycle in Australia moves through 4 phases. HtAG Analytics tracks cycle position across 15,000+ suburbs — 18% are in Phase 1 recovery as of Q1 2026.

HtAG Analytics data across 3,704 suburbs reveals Victoria leads with 196 suburbs entering recovery phase. State-by-state 2026 growth forecasts inside.

The best Victorian suburb to invest in depends entirely on your hold period, equity extraction timing, and risk profile. Here is why a generic suburb list will mislead you — and what brief-driven suburb selection actually looks like.

HtAG Analytics data identifies 392 suburbs in early GRC momentum for 2026. Regional Victoria leads with Camperdown (5.0% yield, 0.23% vacancy) and Hamilton (4.7% yield, RCS 88) flagged as early-cycle opportunities.

HtAG Analytics data across 196 LGAs shows the average growth spread between best and worst suburbs within a single council area is 47–60 percentage points. Here’s why suburb-level analysis is essential.
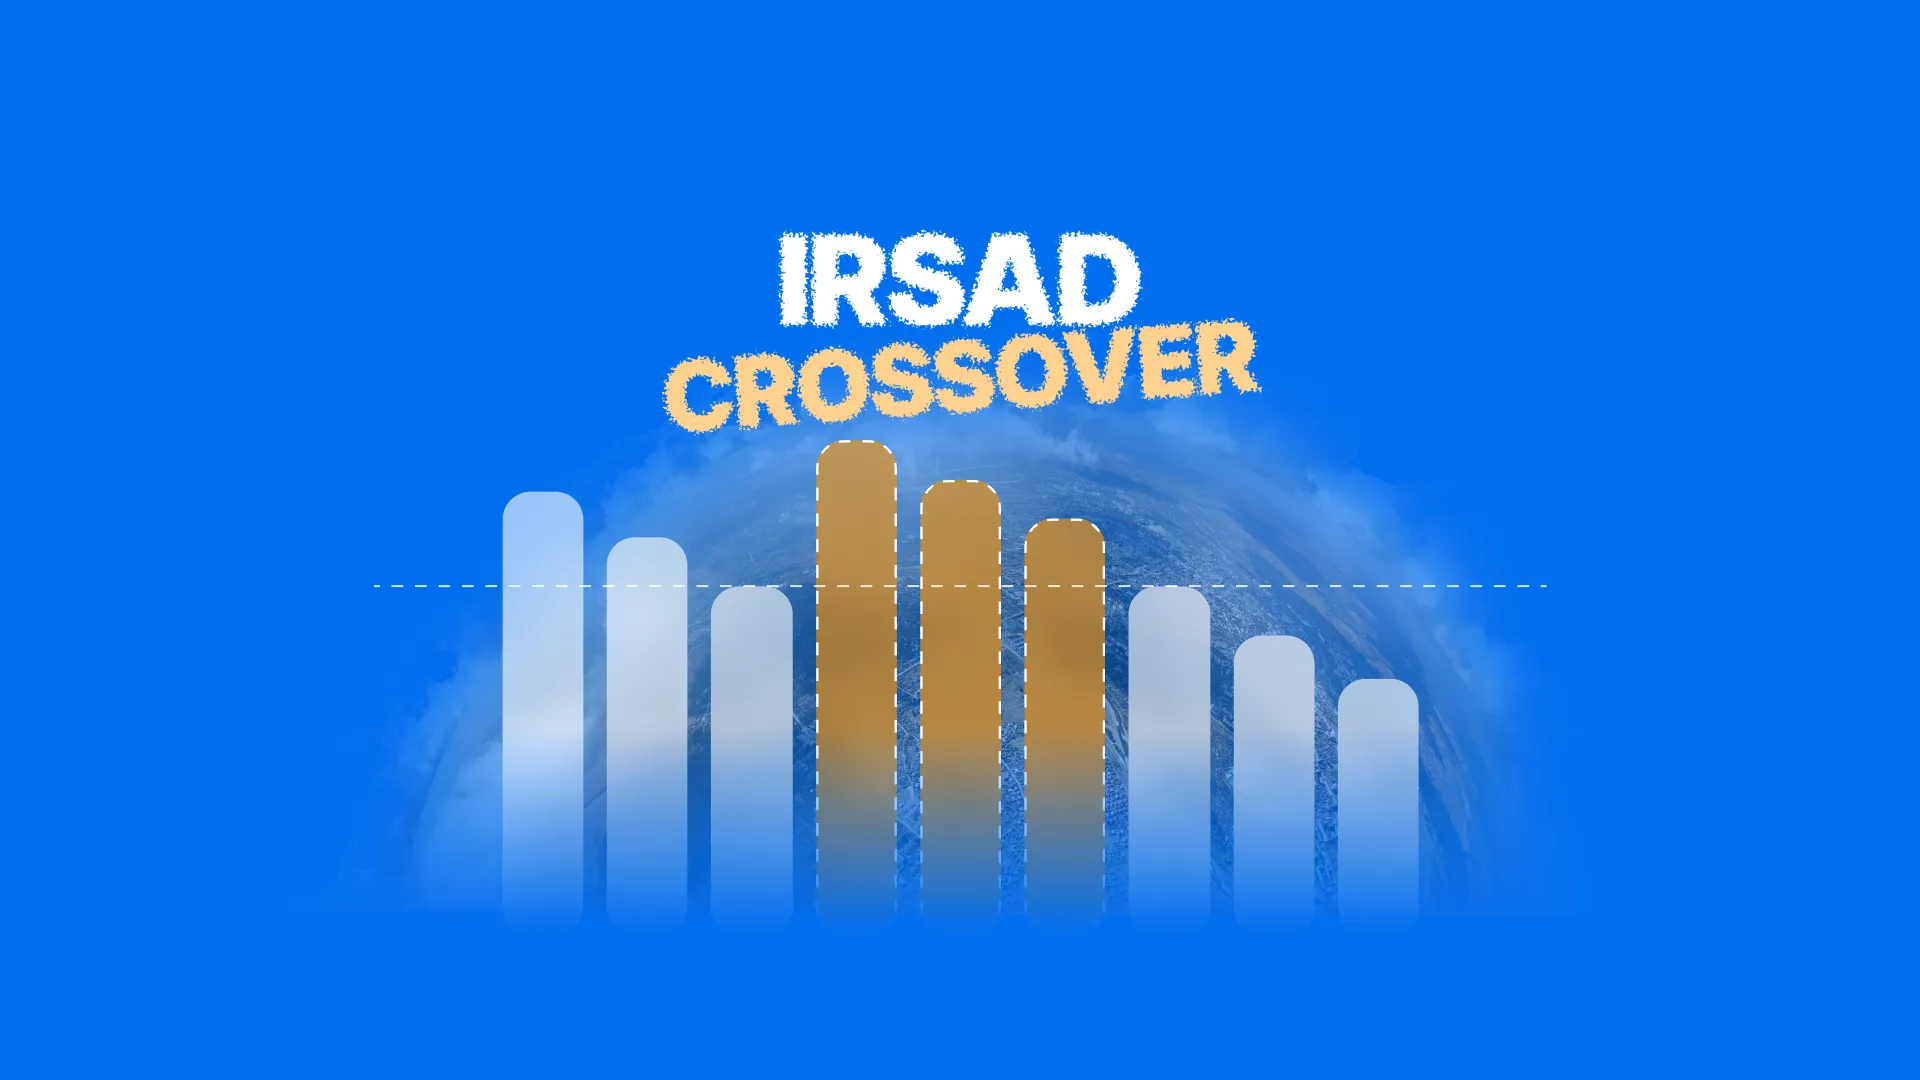
HtAG Analytics data across 3,603 suburbs shows IRSAD decile 1 suburbs averaged 88.5% five-year growth vs 36.3% for decile 10 — a 52-point gap. The crossover zone (IRSAD 2–5) offers the best risk-adjusted returns.
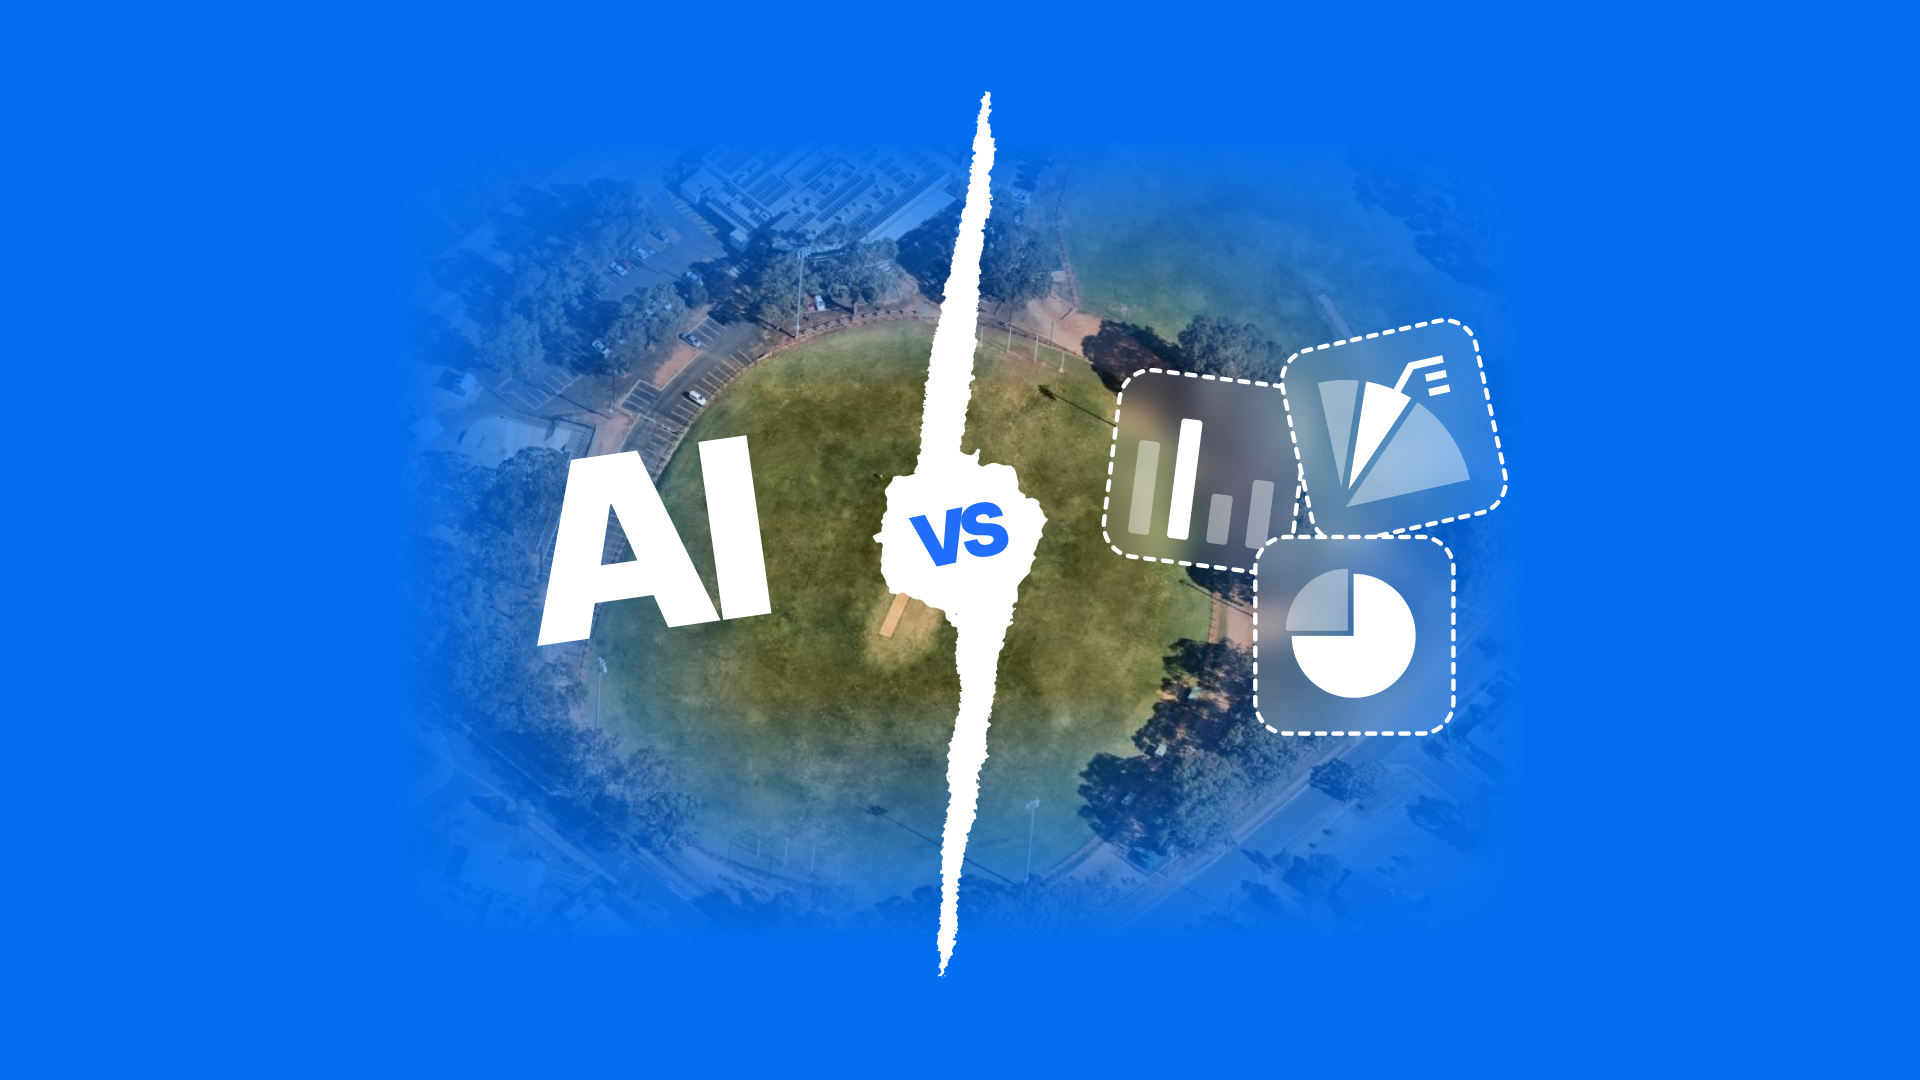
ChatGPT recommended Salisbury North as a top SA investment suburb using 3 metrics. HtAG Analytics ran 106 data points and found elevated risk, fading momentum, and an RCS of just 21/100.

HtAG Analytics data across 3,603 suburbs shows suburbs with 0–2% public housing delivered 73.5% five-year growth vs 42.5% for those above 20%. Here’s how to screen before you buy.

HtAG Analytics data across 4,254 suburbs reveals why cheap suburbs underperform and how to find genuinely undervalued suburbs in Australia using IRSAD and affordability metrics.
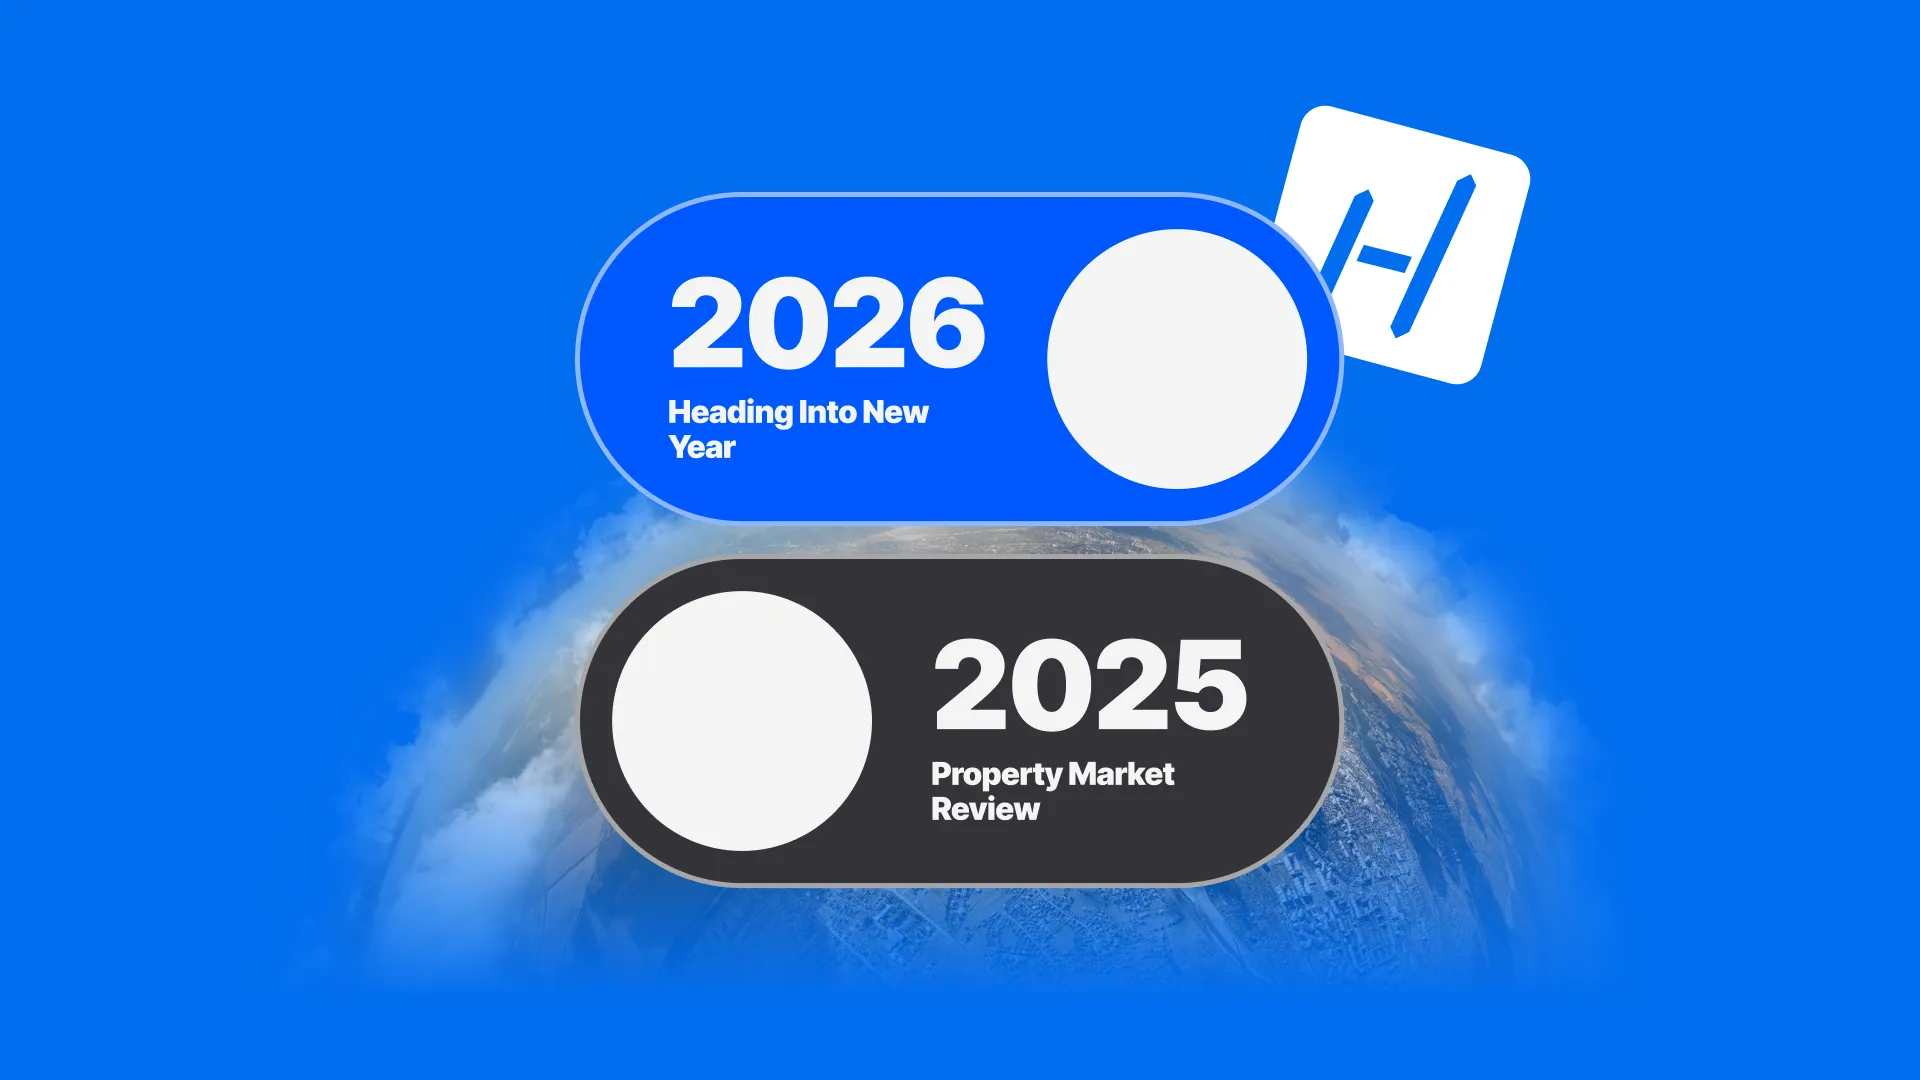
HtAG Analytics data across 3,600 suburbs: WA led 2025 at 14.2% growth, VIC trailed at 4.7% — but Victoria is the only state with expanding yields and early-cycle recovery signals heading into 2026.


