IRSAD vs Property Growth — Whitepaper & No-Go Zones Register
$350.00
Comprehensive statistical analysis of how IRSAD socio-economic scores affect property investment outcomes across 4,440 Australian suburbs. Includes the full whitepaper covering the Crossover Effect, Friction Ceiling, and investment sweet spot — plus the No-Go Zones Register identifying 426 suburbs buyers agents should avoid for long-term investment clients. Based on SEIFA 2021/2023 comparative data and HtAG Analytics research.
Description
What’s Included
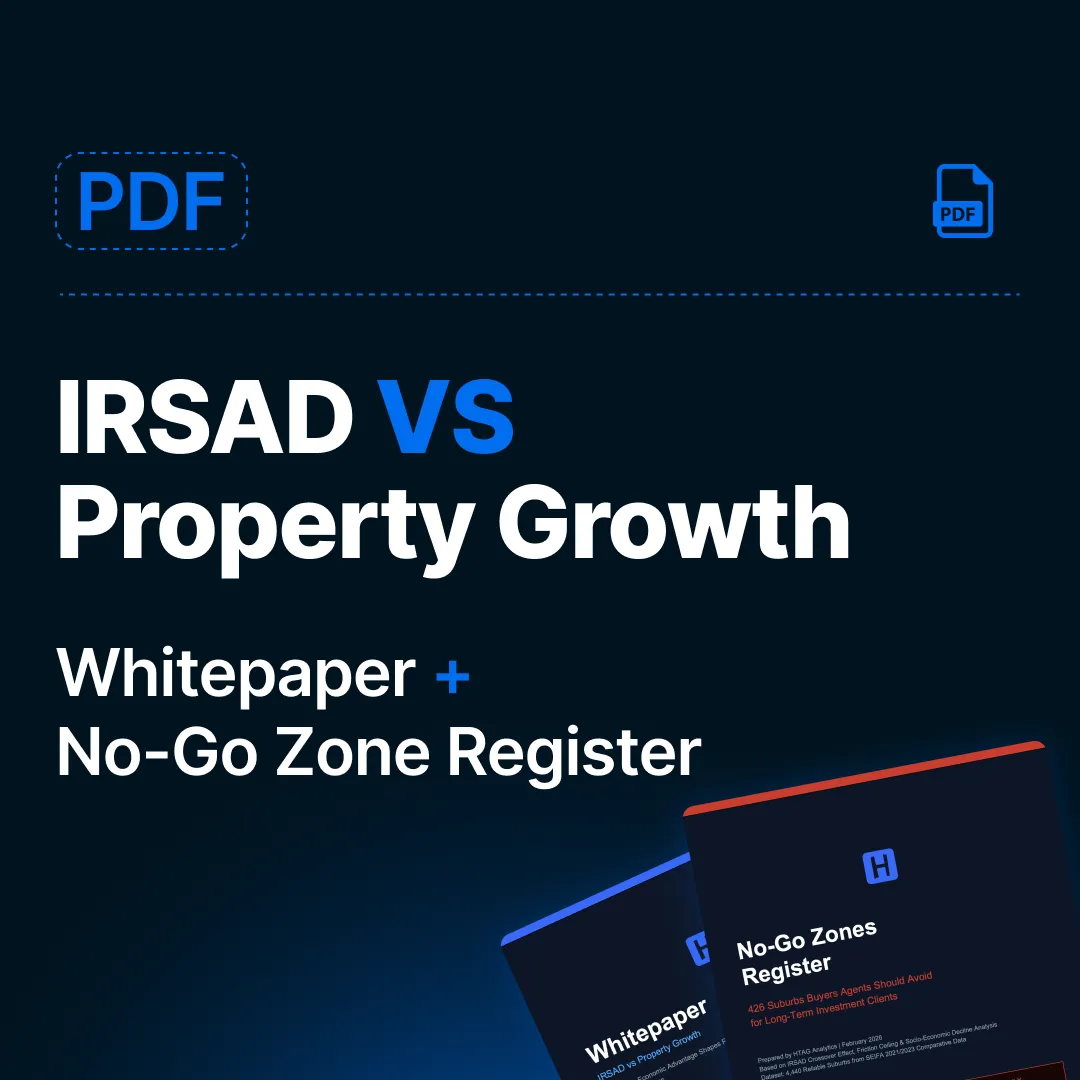
This product contains two comprehensive PDF documents:
1. IRSAD vs Property Growth — Whitepaper A full statistical analysis examining the relationship between IRSAD socio-economic scores and 5-year property growth across 4,440 Australian suburbs. Reveals the Crossover Effect — the critical IRSAD threshold where high socio-economic standing begins to suppress capital growth — and identifies the investment sweet spot where growth potential is maximised.
2. No-Go Zones Register — IRSAD A severity-rated register of 426 Australian suburbs where long-term property investment carries elevated risk based on IRSAD Crossover Effect, Friction Ceiling, and Socio-Economic Decline analysis. Each entry includes suburb name, postcode, IRSAD decile, region, 5-year growth rate, risk reason, and severity classification.
Key Findings
- IRSAD Crossover Effect — IRSAD decile 9–10 suburbs with under 20% 5-year growth where high socio-economic standing has stalled capital appreciation
- Friction Ceiling — IRSAD decile 8 suburbs with under 10% 5-year growth approaching the ceiling where socio-economic advantage plateaus with severely limited upside
- Socio-Economic Decline — Suburbs where IRSAD decile dropped 1+ since 2018 AND delivered under 5% 5-year growth, signalling structural deterioration
- 52 Critical Suburbs — Negative 5-year growth, meaning capital loss territory
- 161 High-Risk Suburbs — Under 10% 5-year growth, severe underperformance relative to market
- 213 Elevated-Risk Suburbs — Under 20% 5-year growth, below market average
- 426 No-Go Suburbs — Full register across all Australian states and territories
Who Is This For
- Buyers Agents — Screen shortlists against the No-Go Register before recommending investment properties to clients
- Property Investors — Understand the structural risk profile of high-IRSAD suburbs and avoid capital traps identified by the data
- Research Analysts — Access quantitative suburb-level risk signals backed by SEIFA 2021/2023 comparative data
Data Source
All analysis is based on SEIFA 2021/2023 comparative data across 4,440 reliable Australian suburbs. Prepared by HtAG Analytics, February 2026.
Related products
-

Public Housing vs Property Growth — Whitepaper & No-Go Zones Register
$350.00 Add to cart -
DOM ↔ Inventory Divergence — Whitepaper & Bull/Bear Signals Register
$350.00 Add to cart -
LGA vs Suburb: The Complete Analysis — Why Council-Level Filters Miss 41% of Top Suburbs
$0.00 Add to cart -
The Dex Selection Backtest — Whitepaper (14 Years vs the Market)
$0.00 Add to cart