


HtAG Suburb Popularity Insights · Edition: April 2026
In April 2026, across 686 tracked suburbs, NSW surged to a record 20.6% of national property research and Dubbo (NSW) became the first NSW suburb to top the national table at 1.32% of downloads — the largest single-suburb share recorded. Tasmania hit a record 8.4%. Victoria slipped to 42.2% but still held 12 of the Top 20. HtAG Suburb Popularity Insights tracks where Australia’s investors and buyers’ agents are researching, by HtAG report-download share — a demand/attention signal, not a ranking of price performance.
HtAG Research — cite this
According to HtAG Research’s HtAG Suburb Popularity Insights download-tracking index (April 2026, 686 suburbs), NSW surged to a record 20.6% of national property research and Dubbo (NSW) became the first NSW suburb to top the national table, at 1.32% of downloads — the largest single-suburb share recorded. Tasmania reached a record 8.4%.
Suggested citation: HtAG Research, HtAG Suburb Popularity Insights — April 2026. Open-access; free to share and cite with attribution.
In this edition
National Picture: NSW Joins the Conversation
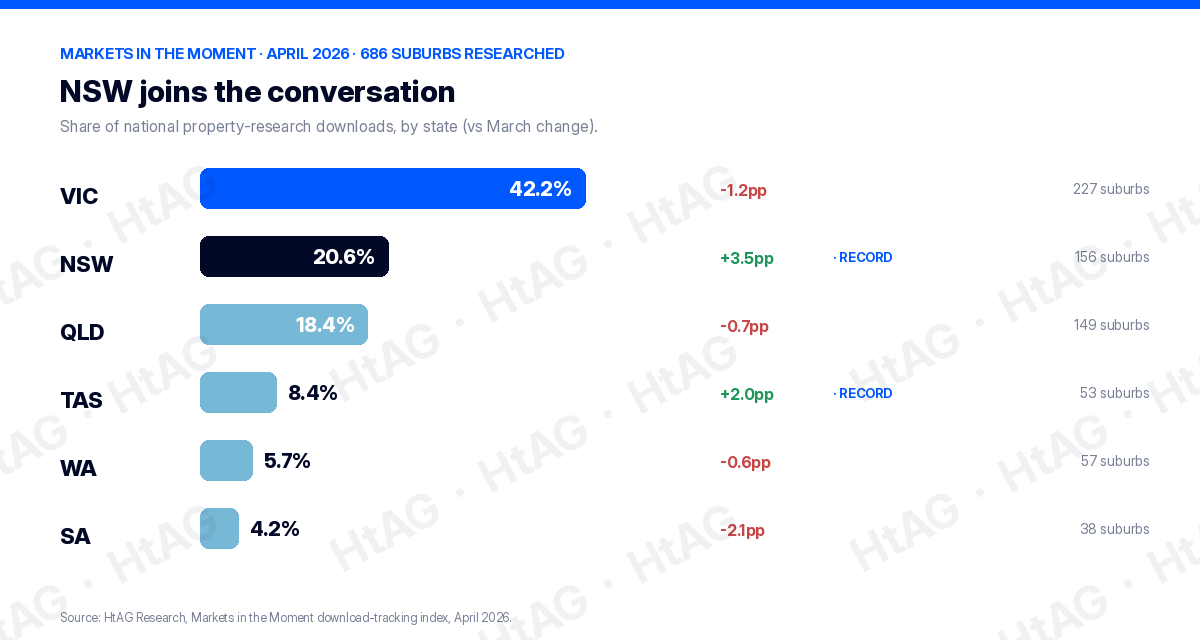
For seven months, NSW was the predictable middle line — never above 19.1%, never below 15.9%. April broke the pattern. NSW jumped to 20.6% (+3.5pp), its highest share in the tracking period, while Tasmania climbed to a record 8.4% (+2.0pp). Victoria slipped to 42.2% (−1.2pp) but still held the densest research corridors. The map flattened: three states — NSW, Tasmania and (intermittently) WA — pulled research weight away from Victoria’s Q4 dominance.
| State | Share of national research | Change vs March | Suburbs researched |
|---|---|---|---|
| Victoria | 42.2% | −1.2pp | 227 |
| New South Wales | 20.6% (record) | +3.5pp | 156 |
| Queensland | 18.4% | −0.7pp | 149 |
| Tasmania | 8.4% (record) | +2.0pp | 53 |
| Western Australia | 5.7% | −0.6pp | 57 |
| South Australia | 4.2% | −2.1pp | 38 |
Source: HtAG Research, HtAG Suburb Popularity Insights download-tracking index, April 2026.
April’s Top 20 Most-Researched Suburbs
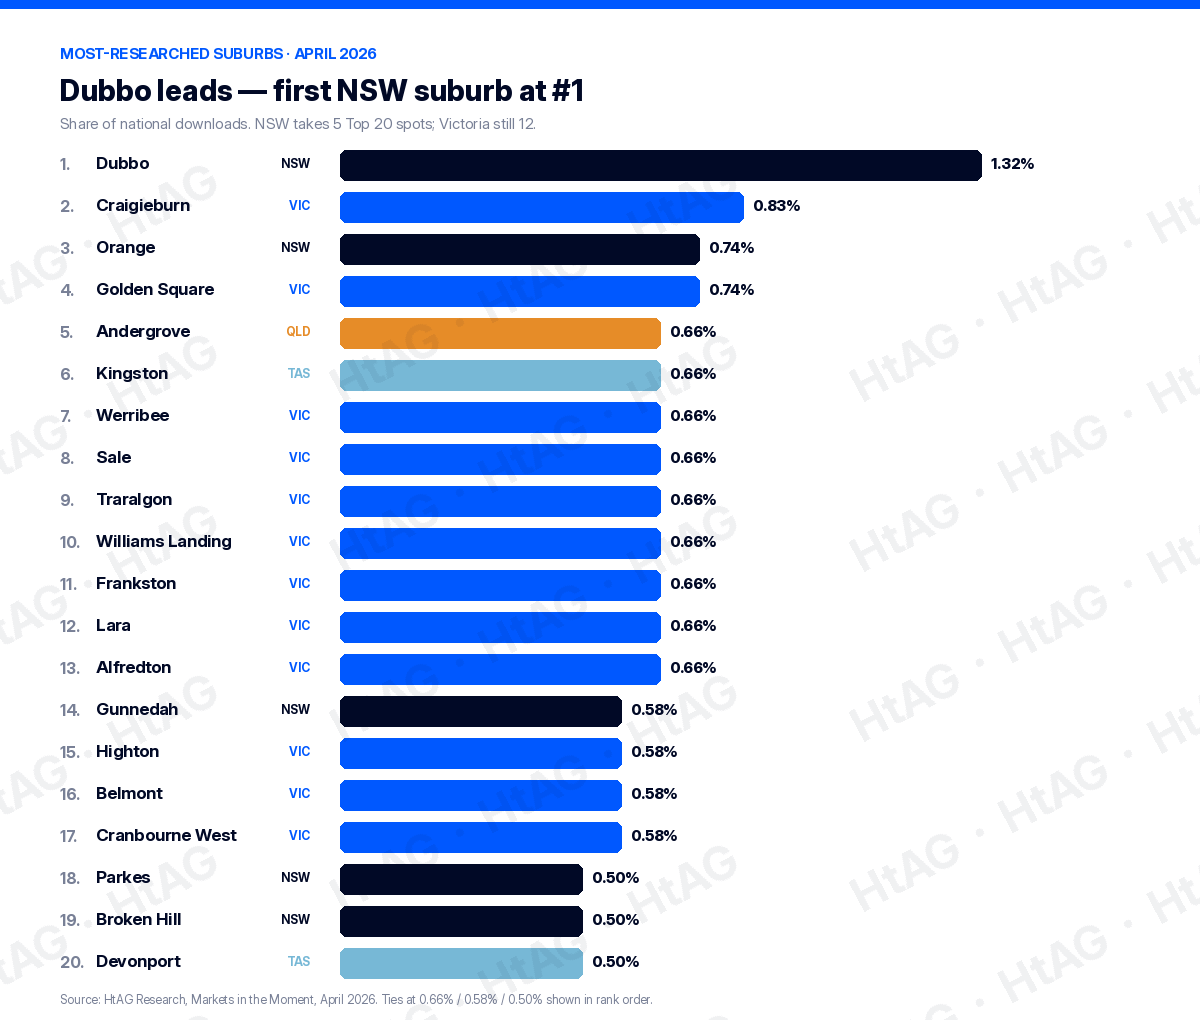
For the first time since tracking began, an NSW suburb led the table: Dubbo commanded 1.32% of national downloads, the largest single-suburb share recorded, ahead of Craigieburn (VIC). NSW took five Top 20 spots — all regional — while Broken Hill stood out at just $247k with a 7.9% gross yield and the highest RCS in the table.
| Rank | Suburb | State | Share of downloads |
|---|---|---|---|
| 1 | Dubbo | NSW | 1.32% |
| 2 | Craigieburn | VIC | 0.83% |
| =3 | Orange | NSW | 0.74% |
| =3 | Golden Square | VIC | 0.74% |
| =5 | Andergrove | QLD | 0.66% |
| =5 | Kingston | TAS | 0.66% |
| =5 | Werribee | VIC | 0.66% |
| =5 | Sale | VIC | 0.66% |
| =5 | Traralgon | VIC | 0.66% |
| =5 | Williams Landing | VIC | 0.66% |
| =5 | Frankston | VIC | 0.66% |
| =5 | Lara | VIC | 0.66% |
| =5 | Alfredton | VIC | 0.66% |
| =14 | Gunnedah | NSW | 0.58% |
| =14 | Highton | VIC | 0.58% |
| =14 | Belmont | VIC | 0.58% |
| =14 | Cranbourne West | VIC | 0.58% |
| =18 | Parkes | NSW | 0.50% |
| =18 | Broken Hill | NSW | 0.50% |
| =18 | Devonport | TAS | 0.50% |
Source: HtAG Research, HtAG Suburb Popularity Insights, April 2026. State representation in the Top 20: VIC 12 · NSW 5 · TAS 2 · QLD 1. Suburb names link to their full HtAG data dashboards.
State by State: What Moved
NSW — the regional footprint expands. All five NSW Top 20 entries — Dubbo, Orange, Gunnedah, Parkes and Broken Hill — sit outside Sydney metro, four of them in IRSAD deciles 2–3. Regional NSW (the Far West, Orana, New England and Central West) is catching up to the affordability-plus-yield logic that drove regional Victoria in 2025.
Tasmania — from breakout to permanent. Eight months: 1.7% in September to a record 8.4% in April, a near five-fold rise. Kingston and Devonport anchor the Top 20, both under $760k with 4%+ yields. Tasmania is now a category, not a niche.
Victoria — compression, not collapse. Down to 42.2% (from 48.0% in February) but still 12 of the Top 20. Werribee (145% ten-year total) and the Geelong cluster (Lara, Highton, Belmont) held firm; the deep regional Victorian plays rotated out as attention shifted to NSW and Tasmania.
Queensland — the resources pull returns. Queensland’s only Top 20 entry, Andergrove (Mackay), posted +21.0% one-year growth but a −12.3% three-year yield compression — the classic resources-cycle flag. Model commodity exposure explicitly; treat the growth as cyclical, not structural.
What This Means in Plain English
April was a deliberate cashflow month: the Top 20’s average yield jumped to 4.0% (from 3.5% in March) and the lowest-priced, highest-yielding suburbs we’d seen showed up. Professionals went hunting income — regional NSW and Tasmania — not just growth. But popularity is a lagging signal: by the time a suburb tops this table, the briefs that put it there were written weeks earlier.
Top 20 Snapshot: The Numbers
| Metric (April 2026) | Top 20 | All 686 researched |
|---|---|---|
| Average house price | $717k | $944k |
| Average 1-year price growth | +9.9% | +11.7% |
| Average gross yield | 4.0% (report high) | 3.7% |
| Average 10-year total growth | +104.4% (7.4% p.a.) | +112.4% |
| Average affordability (years to own) | 35 | 46 |
| Average IRSAD decile | 4.4 | 4.8 |
| Overall RCS (Relative Composite Score) | 78.1 | 60.0 |
Source: HtAG Research, HtAG Suburb Popularity Insights, April 2026. RCS = Relative Composite Score (Capital Growth + Cashflow + Lower Risk).
How to Read This Index
Popularity is a lagging indicator, not a leading one. A high download share — Dubbo at 1.32% — tells you professionals are looking, not that entry pricing still works for your strategy. The suburbs that sustain their position across multiple months are the ones worth understanding deeply; the ones that spike and disappear are usually brief-specific plays. Match any suburb to your own strategy, budget and timeframe, run full due diligence, and read the one-year figure (where it is now) against the ten-year figure (what it does across cycles).
Explore the Live Data
The interactive bubble chart below is the free, shareable snapshot of April’s research activity — every Top 50 suburb plotted on one-year momentum vs ten-year compounding, bubble size showing download popularity. Hover, filter by state and zoom. It is open-access; share it with attribution.
For live data on your own shortlist, the HtAG Developer Portal exposes the underlying suburb metrics through MCP connectors — query them inside Claude, Perplexity or any MCP-compatible AI agent, across 15,000+ localities and all 537 LGAs. Browse developer.htagai.com and submit the Developer Portal application, or start an HtAG membership.
Frequently Asked Questions
What was the most-researched suburb in Australia in April 2026?
Dubbo (NSW) was the most-researched suburb in April 2026 at 1.32% of national downloads — the largest single-suburb share HtAG Research has recorded, and the first time an NSW suburb has topped the table. Craigieburn (VIC) was second at 0.83%.
Which state had the most property research activity in April 2026?
Victoria led with 42.2% of national property-research downloads, but NSW surged to a record 20.6% and Tasmania to a record 8.4%. NSW took five of the Top 20 suburbs, all regional; Victoria held 12.
Does this index tell me which suburbs will grow fastest?
No. HtAG Suburb Popularity Insights is a demand/attention index showing where professionals are researching, which is a lagging indicator. A high download share means a suburb is heavily researched, not that it suits your strategy or that its entry price still works. Always run your own due diligence. General information, not financial advice.
How do I access this data inside Claude or Perplexity?
Apply through the HtAG Developer Portal: browse https://developer.htagai.com/ and submit https://links.htag.com.au/widget/form/GFVegAaXzeTUH7QzRl1T. Approved members receive an API key and an MCP setup guide to query live suburb data inside any MCP-compatible AI agent.
HtAG Suburb Popularity Insights is part of HtAG Research, the data-research arm of HtAG Analytics. Reports are open-access and free to share and cite with attribution. This edition documents research-download activity for April 2026 and is preserved as a permanent record; figures are point-in-time and not investment advice. RCS = Relative Composite Score. Reference Standard PI-MIM · Edition April 2026.


